Active Living Research
Promoting activity-friendly communitiesMaking the Case for Designing
Active Cities
This report was prepared by:
James F. Sallis, PhD, Active Living Research, University of California, San Diego Chad Spoon, MRP, Active Living Research, University of California, San Diego
Contributors:
Nick Cavill, PhD, MPH, MFPH, Cavill Associates Ltd, United Kingdom Jessa Engelberg, BA, UCSD / SDSU Public Health Joint Doctoral Program Klaus Gebel, PhD, James Cook University, Australia
Debbie Lou, PhD, University of California, San Diego
Mike Parker, BSc, Progress Health Partnerships, United Kingdom
Christina M. Thornton, JD, MA, UCSD / SDSU Public Health Joint Doctoral Program Amanda Wilson, MSRS, Active Living Research
Carmen L. Cutter, MPH, Active Living Research
Ding Ding, PhD, MPH, The University of Sydney, Australia
For a Web-based version of this report, visit:
http://activelivingresearch.org/making-case-designing-active-cities
A peer-reviewed paper based on this report is available online through open access:
Sallis, JF, et al. (2015). Co-benefits of designing communities for active living: an exploration of literature. International Journal of Behavioral Nutrition and Physical Activity, 12:30. DOI 10.1186/s12966-015-0188-2. Available at:
TABLE OF CONTENTS
Executive Summary ... 3
Introduction …. ... 4
Making the Case Methodology ... 4
Results of Reviews ... 9
Open Spaces / Parks / Trails ... 11
Urban Design / Land Use ... 13
Transportation Systems ... 15
Schools ... 18
Buildings / Workplaces ... 20
Review of Grey Literature in Europe ... 22
Special Report on Active Living and Climate Change ... 24
Conclusions .... .... ... 26
Recommendations ... 30
References …. …. ... 32
ACKNOWLEDGEMENTS
Active Living Research
Promoting activity-friendly communitiesExecutive Summary
Creating "activity-friendly environments" is recommended to promote physical activity, but potential co-benefits of such environments have not been well described. An extensive but non-systematic review of scientific and "gray" literature was conducted to explore a wide range of literature to understand the co-benefits of activity-friendly environments on physical health, mental health, social benefits, safety/injury prevention, environmental sustainability, and economics. Five physical activity settings were defined: parks/trails, urban design, transportation, schools, and
workplaces/buildings.
KEY FINDINGS
• A total of 418 higher-quality findings were summarized based on direction of association and quality of source.
• The overall summary indicated 22 of 30 setting by outcome combinations showed “strong” evidence of co-benefits.
• Each setting had strong evidence of at least 3 of the 6 benefits, and parks and trails had strong evidence of all 6
co-benefits. Thus, for each setting there are multiple features that can be designed to both facilitate physical activity and produce co-benefits.
• All five physical activity settings could be designed so they have positive effects on economic outcomes,
including increased home value, greater retail activity, reduced health care costs, and improved productivity.
• Activity-friendly design in all settings had strong evidence of environmental co-benefits based on reduced pollution
and carbon emissions.
• There were many gaps in evidence of co-benefits in the schools and workplace settings as well the health consequences
of environments that support active travel.
• Overall, there was little evidence of negative consequences of activity-friendly environments.
IMPLICATIONS
Introduction
As demonstrated in Designed to Move (www.designedtomove.org), physical inactivity is a major challenge to health and well-being globally. There are 5 million deaths worldwide attributable to physical inactivity (Lee, et al, 2012), most people are not sufficiently active, physical activity is declining in many countries, and this is a global problem with the biggest burden in low and middle income countries (Ng & Popking, 2012). Increasing physical activity is a goal of the United Nations through its non-communicable disease initiative (UN, 2011).
Physical activity has been engineered out of people's lives, but efforts are underway worldwide to re-integrate physical activity into daily lives through environmental changes. The UN, World Health Organizations, national physical activity plans, US Centers for Disease Control and Prevention, US Institute of Medicine, and other scientific groups worldwide have identified creating built environments and implementing policies that support active living as essential for increasing physical activity and improving health.
There are special opportunities to create more activity-friendly environments through actions taken by city
governments. Actions at the city level can affect urban design, transportation systems, parks and recreation facilities, schools, and workplaces/buildings. These actions are often led by mayors. Thus, we look to mayors for leadership in creating activity-friendly environments, and mayors around the world are showing leadership and achieving results. An important barrier to environmental changes that support physical activity is that decision-makers do not consider physical activity an important enough rationale to justify policy changes and investments. Even if a decision-maker is well aware of the important effects of physical activity on health and health care costs, health may not be on the agenda of the decision-maker. Decisions taken in the transportation, city planning, parks and recreation, education,
architecture, and business fields often determine whether environments facilitate, or create barriers to, physical activity. Health is often not part of the mission of these groups. Though mayors, city councilors, and similar officials work everyday to balance competing interests, most of them do not understand that environments that support physical activity produce additional benefits for their communities. Thus, creating activity-friendly environments can be a solution that solves multiple problems. For example, changing zoning codes to favor mixed use developments is likely to enhance property values and reduce carbon emissions. Having parks in neighborhoods has been linked with physical health and mental health benefits.
However, there is no resource that describes the full range of co-benefits of activity-friendly environments. We undertook an exploration of an extremely diverse literature ranging from mental health and injury prevention to real estate prices and climate change. We searched in the scientific literature and beyond. We asked for guidance from scholars and advocates working in diverse fields. We looked hard for international evidence and dug into "green" benefits that related to pollution and carbon emissions. The hunt uncovered hundreds of relevant studies and reports that can be used to create a profile of the multiple benefits of each environmental feature. We believe this report can be a useful decision tool. Because mayors and city councilors must address a very broad set of issues, knowing how a single decision can affect several outcomes may change that decision. Built environment decisions often involve large financial commitments, and they create the form and character of cities that last for decades, even centuries. Decisions about built environments should consider the full range of consequences, including physical activity, and this report is meant to be a tool for decision-makers.
The main audience for this report is mayors, city officials, practitioners from multiple sectors, and advocates. The goal is to summarize the available science in a non-technical way so non-scientists can use the evidence in their decision-making.
Making the Case Methodology
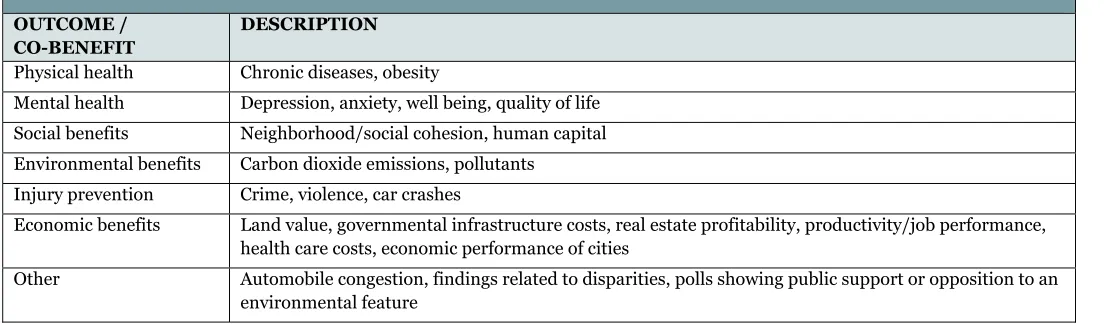
We first developed a list of potential outcomes or co-benefits of activity-supportive built environments (Table 1). With guidance from international experts convened at a September 2013 Active Cities workshop, we then identified built environment features from each of the five Designed to Move (DTM) settings that research had shown to be related physical activity (Table 2). We used these built environment features to structure and narrow the scope of the literature search.
Table 1: Outcomes of Activity Supportive Built Environments OUTCOME /
CO-BENEFIT
DESCRIPTION
Physical health Chronic diseases, obesity
Mental health Depression, anxiety, well being, quality of life Social benefits Neighborhood/social cohesion, human capital Environmental benefits Carbon dioxide emissions, pollutants
Injury prevention Crime, violence, car crashes
Economic benefits Land value, governmental infrastructure costs, real estate profitability, productivity/job performance, health care costs, economic performance of cities
Other Automobile congestion, findings related to disparities, polls showing public support or opposition to an environmental feature
Table 2: Built Environment Features Correlated with Physical Activity BUILT ENVIRONENT
ATTRIBUTE
DESCRIPTION REFERENCE
Open Spaces / Parks / Trails
Design features Size, amenities/facilities Godbey, 2010; Ding, 2011; Sallis, Adams, 2011 Presence/proximity Existence of and distance to Ding, 2011; Bauman, 2012; Sallis, 2012
Trails Proximity to and design of Sallis, Adams, 2011; Sallis, 2012
Programs, promotion, and events
Park-based programming Godbey, 2010
Park incivilities / civilities Existence of or lack of graffiti, litter, anti-social behavior (public drinking, loitering)
Molnar, 2004; Miles, 2008; Sallis, Adams, 2011
Public gardens Godbey, 2010
Urban Design / Land Use
Density Population and housing density Ding, 2011; Bauman, 2012; Sallis, 2012 Mixed land use Mix of destinations, distance to destinations Ding, 2011; Bauman, 2012; Sallis, 2012 Streetscale pedestrian design Including buffers, building set-back, form based
codes, street lights, etc
Heath, 2006
Greenery Street trees/shrubbery, gardens Ding, 2011;
Bauman, 2012 Incivilities Graffiti, vacant/dilapidated buildings, litter,
anti-social behavior (public drinking, loitering)
Molnar, 2004; Miles, 2008; Ding 2011
[image:5.612.40.576.385.688.2]Transportation Systems Pedestrian/bicycle
infrastructure
Sidewalks, bike lanes, bike parking Ding, 2011; Bauman, 2012; Sallis, 2012
Crosswalk markings Crosswalks (intersections as its own location) Badland, 2005 Traffic calming Speed bumps, curb-cuts, road diet, other
engineering infrastructure
Badland, 2005; Rothman, 2014
Public transportation Bus, train Sallis, Adams, 2011; Bauman, 2012; Sallis, 2012
Traffic speed/volume Ding, 2011
Safe routes to school Engineering, programming, promotion and events
Sallis, 2012; Stewart, 2014
Ciclovia/play streets Open streets Sarmiento, 2010; Torres, 2013
Managed parking Parking access U.S. EPA, 2006
Schools
School siting Location of school (suburban, urban, rural) McMillan, 2009 Recreation facilities Physical education facilities and equipment,
presence of PE teachers
Davison, 2006; Spengler, 2012
Shared use agreements Community use of school facilities Spengler, 2012; Lafleur, 2013
Workplaces / Buildings
Building siting Access to active transportation opportunities Zimring, 2005 Mixed land use around
worksite
Mix of destinations, distance to destinations Ding, 2011; Bauman, 2012; Sallis, 2012
Building site design Design of property that building sits upon Zimring, 2005 Building itself Stair design, exercise equipment presence,
shower/locker presence, skip-stop elevators
Zimring, 2005; Nicoll, 2009
Worksite physical activity policies and programs
Exercise classes, discounted gym membership, active transportation promotion policies, parking cash out programs, point-of-decision prompts
Proper, 2003; Crespo, 2011
Workplace furniture design Sit-stand desks Alkhajah, 2012
Literature Review
We began the literature review with a snowball sampling of topic experts. Using our ALR network of diverse experts, we asked 20 leaders with expertise in the five DTM settings for their help in identifying:
• Groups/organizations working on these issues worldwide
• Must see reports/papers, both peer-reviewed and grey literature
• Websites
• Cities that have implemented activity-friendly built environment changes
• Recommendations for other experts in the field we should speak with
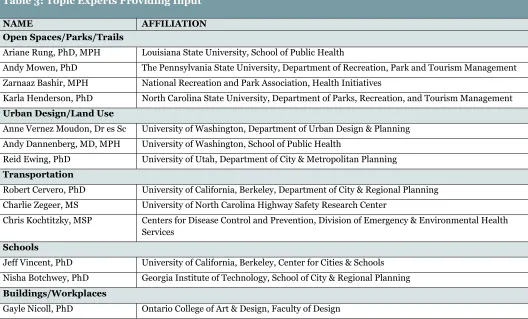
Of the 20, we received input from 13 experts (Table 3). From November 2013 through February 2014, ALR staff
reviewed the recommended resources, looking for evidence focused on our identified built environment features and co-benefits. Some of the recommended resources focused specifically on physical activity as an outcome and were
targeted literature searches using the built environment features and co-benefits as search terms to uncover additional resources. However, systematic literature reviews designed to identify all relevant papers were not feasible given the large scope of the search. Abstractors were instructed to use multiple synonyms for search terms because terms vary by discipline. Search engines included Scopus, PubMed, Google Scholar, ISI Web of Science, MEDLINE, PsychINFO, Academic Search Premier, ClimateArk, and Google.
Table 3: Topic Experts Providing Input
NAME AFFILIATION
Open Spaces/Parks/Trails
Ariane Rung, PhD, MPH Louisiana State University, School of Public Health
Andy Mowen, PhD The Pennsylvania State University, Department of Recreation, Park and Tourism Management Zarnaaz Bashir, MPH National Recreation and Park Association, Health Initiatives
Karla Henderson, PhD North Carolina State University, Department of Parks, Recreation, and Tourism Management Urban Design/Land Use
Anne Vernez Moudon, Dr es Sc University of Washington, Department of Urban Design & Planning Andy Dannenberg, MD, MPH University of Washington, School of Public Health
Reid Ewing, PhD University of Utah, Department of City & Metropolitan Planning Transportation
Robert Cervero, PhD University of California, Berkeley, Department of City & Regional Planning Charlie Zegeer, MS University of North Carolina Highway Safety Research Center
Chris Kochtitzky, MSP Centers for Disease Control and Prevention, Division of Emergency & Environmental Health Services
Schools
Jeff Vincent, PhD University of California, Berkeley, Center for Cities & Schools Nisha Botchwey, PhD Georgia Institute of Technology, School of City & Regional Planning Buildings/Workplaces
Gayle Nicoll, PhD Ontario College of Art & Design, Faculty of Design
Abstracting Process
During the abstracting process, basic information on the built environment feature, co-benefit, study sample
Table 4: Grading the Evidence for Resource Abstracting Process
SCORE TYPE OF EVIDENCE
4.5 Peer-reviewed, systematic review paper (including meta-analysis)
4 literature) Peer-reviewed, non-systematic review paper (from scientific literature) or non-peer-reviewed review paper (from grey
3.5 Any (singular) peer-review study
3 Any (singular) non peer-reviewed study, such as a technical report from a government agency or academic center
2 review Non-analytic studies (for example, case reports, case series, simulations) or advocacy report without a clear literature
1 Expert opinion, formal consensus
Table 5: Direction of Association of Evidence for Resource Abstracting Process
SCORE ASSOCIATION
+ A favorable association was found between feature and co-benefit (feature associated with "better" level of co-benefit) - An unfavorable association was found between feature and benefit (feature associated with "worse" level of
co-benefit)
0 (zero) No association or inconsistent evidence was found between feature and co-benefit
The initial goal was to be inclusive in finding relevant sources of information. For scientific literature, reviewers were instructed to find systematic or non-systematic reviews first. If reviews were located, then the individual studies did not need to be searched, except for publications since the latest review. In cases where a review paper did not provide adequate specificity or quantification in the findings, selected primary studies from that review paper were abstracted to illustrate specific findings. If reviews were not located, then individual studies were searched. For gray literature, reports from credible organizations were targeted, from such groups as government agencies, academic centers, and selected advocacy groups. Newspapers, magazines, and blogs were not searched, except to identify citations of or links to more credible reports. Abstracting tables were cross-checked by other staff for accuracy and clarity.
To ensure a global perspective, ALR contracted with two international consultants to replicate the literature review process as well as provide additional expertise. Nick Cavill, PhD and Mike Parker of Cavill Associates, a public health consultant firm based in the United Kingdom, conducted a search of grey European literature, uncovering and
abstracting a total of 46 reports. Ding Ding, PhD, MPH of the University of Sydney and Klaus Gebel, PhD of James Cook University, Australia, conducted a literature search focused on the association between the built environment features and climate change related outcomes, and case studies of successful programs, policies, or planning initiatives that were successful in reducing carbon emissions. Ding and Gebel added a total of 31 reports to the overall MTC abstracting.
Synthesizing the Findings
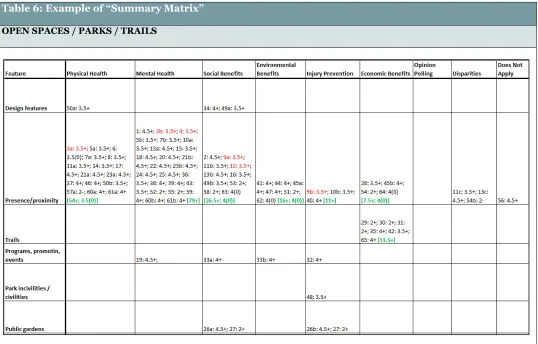
Communicating so many findings is a challenge, so several ways of summarizing the results in a visual manner were created. To illustrate areas with strong research evidence as well as research gaps, ALR staff created summary matrices that visually show which built environment features have (and do not have) evidence supporting a co-benefit (see Table 6 for example; for full document, see Excel spreadsheet titled “Summary Matrix” at http://activelivingresearch.org/ making-case-designing-active-cities. Each finding from the Data Abstracting tables is listed in the appropriate cell along with its associated grade of evidence and direction of association. Individual papers that were counted as part of a review paper, and therefore also abstracted, are coded in red on the Summary Matrix to help prevent double counting of findings. The Summary Matrix helps to identify specific policy and built environment changes that cities can pursue within a DTM setting.
[image:9.612.40.578.279.623.2]An overall “Making the Case” summary table identifies which DTM settings have the most overall evidence. The table was calculated by aggregating the "grading the evidence" scores for each built environment feature for each co-benefit within each DTM setting (see Tables 8 - 12). Dark green cells have the highest levels of evidence, light green cells have moderate evidence, white cells lack sufficient evidence to make a judgment, and pink cells have evidence of unfavorable associations. Thus, decision-makers can see at a glance which environmental features have the best evidence of multiple benefits.
Table 6: Example of “Summary Matrix” OPEN SPACES / PARKS / TRAILS
Results of Reviews
The color-coded "matrix" tables that follow summarize the evidence of co-benefits for each key feature. There is a separate table of features for each of the five built environment settings. Some of the features are programs or social environment attributes that can complement a favorable built environment or possibly compensate for an unfavorable built environment.
We used a "quasi-quantitative" approach to summarizing the results of the literature reviews. Summary scores were created by summing the weights of evidence from each resource. Thus, the summary scores roughly indicate both the quantity and quality of the evidence. Cells in each table are color coded based on three levels of summary scores. We judge a positive finding from a literature review to be moderate evidence, because if coders found a good-quality review, they did not necessarily continue searching for specific studies. We did not want to set the bar too high, because we expected many of these topics not to be well studied. Thus, one high quality study does not merit a summary of "moderate" evidence, but a good review is considered "moderate" evidence.
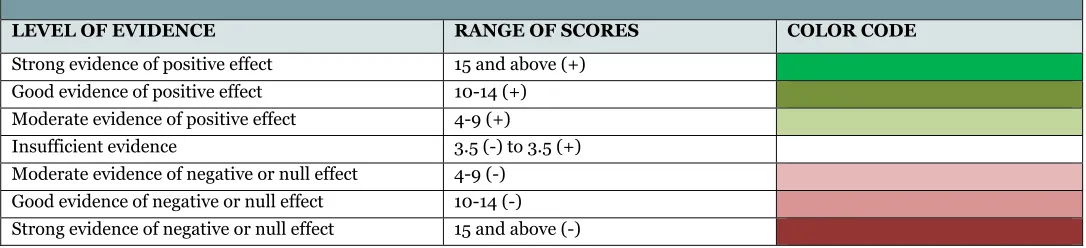
We calculated "net" scores by subtracting the weight of negative and zero scores from the weight of plus scores (Table 7). Thus, evidence of negative or null findings were counted against positive findings. The color-coded “matrix” tables can be interpreted as follows:
• "4+" net score indicates moderate evidence (light green), because this is equivalent to one non-systematic
review.
• "10+" net score indicates good evidence (medium green), because this is equivalent to more than two reviews.
• "15+" net score indicates strong evidence (dark green), because this is equivalent to more than three reviews.
• A net score of less than 4 indicated insufficient evidence and was coded with a white background.
• The same rules were used to summarize negative and null findings, with net negative or null findings coded in
shades of red.
• A white cell with no numbers indicated that we found no credible evidence on this topic.
• In creating the summary scores, resources with quality scores of "1" or "2" were not counted because they were
[image:10.612.36.579.415.539.2]not considered credible enough.
Table 7: Summary of Scores and Color Codes for Each Level of Evidence
LEVEL OF EVIDENCE RANGE OF SCORES COLOR CODE
Strong evidence of positive effect 15 and above (+) Good evidence of positive effect 10-14 (+) Moderate evidence of positive effect 4-9 (+)
Insufficient evidence 3.5 (-) to 3.5 (+)
Moderate evidence of negative or null effect 4-9 (-) Good evidence of negative or null effect 10-14 (-) Strong evidence of negative or null effect 15 and above (-)
Summary of Results by Setting
There are 3 parts of the presentation of results for each setting.
1. Key results and interpretations for each table.
2. Matrix table, with color codes and numerical scores for positive, null, and negative findings.
3. Samples of compelling findings from the “Data Abstracting Table”, to give a flavor of the types of studies
Open Spaces / Parks / Trails
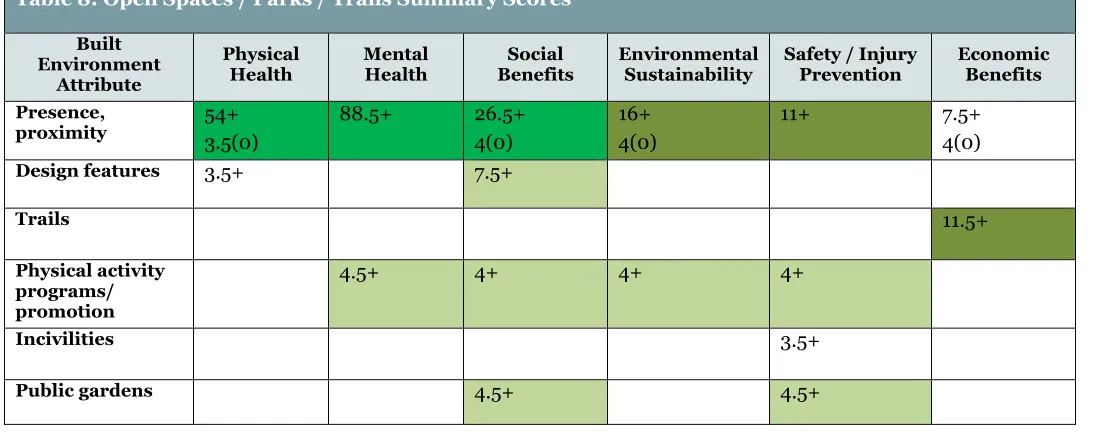
There were 69 entries in the open space/parks/trails category. Of 36 cells in the matrix table (Table 8), 3 had strong evidence of co-benefits, 3 had good evidence, and 7 had moderate evidence. Specific findings include:
• Park presence/proximity had good to strong evidence of all co-benefits, except economic.
• Physical activity programs and promotions had moderate evidence for 4 co-benefits.
• Public gardens had moderate evidence of social and injury prevention benefits.
• Trails had good evidence of economic benefits.
• There are many gaps in research on co-benefits of all parks and trails features, except park proximity and
physical activity programs and promotion.
[image:11.612.35.584.262.478.2]Current evidence supports a conclusion that having a park nearby with substantial programs and promotion produces a wide range of health and environmental benefits beyond physical activity.
Table 8: Open Spaces / Parks / Trails Summary Scores Built
Environment Attribute
Physical
Health Mental Health Benefits Social Environmental Sustainability Safety / Injury Prevention Economic Benefits
Presence,
proximity 54+ 3.5(0) 88.5+ 26.5+ 4(0) 16+ 4(0) 11+ 7.5+ 4(0)
Design features 3.5+ 7.5+
Trails 11.5+
Physical activity programs/ promotion
4.5+ 4+ 4+ 4+
Incivilities 3.5+
Public gardens 4.5+ 4.5+
Highlights of Key Parks and Recreation Findings 1. Physical Health
a. Presence/Proximity: Diabetic individuals taking 30-minute walks in a forest experienced lowered blood
glucose levels far more than the same amount of time spent doing physical activity in other settings. The
half-hour forest walks resulted in larger drops in blood glucose than three hours of cycling. (NRPA
Report, 2010)
b. Presence/Proximity: The risk of cardiovascular and respiratory disease mortality decreased with
increasing green areas for males (p < 0.001), and was lowest for the greenest wards (cardiovascular disease: incidence rate ratio (IRR) 0.95, 95% CI 0.91-0.98; respiratory disease: IRR 0.89, 95% CI 0.83-0.96). Thus, males living in the greenest urban wards in the UK had a 5% lower risk of cardiovascular disease mortality and 11% lower risk of respiratory disease mortality than those in the least green wards. In contrast, no association with urban green space was found among females for cardiovascular and
respiratory mortality.(Richardson & Mitchell, 2010)
c. Presence/Proximity: In areas where 90% of the environment around the home is green, only 10.2% of
the residents feel unhealthy, as compared with areas in which 10% of the environment is green, where
2. Mental Health
a. Presence/Proximity: People living more than 1km away from a green space resulted as having 1.42
higher odds of experiencing stress than those living less than 300m from a green space. An analysis of the association between stress and visits to green spaces showed that respondents who do not report stress have 1.57 (95% CI 1.40–1.76) higher odds of visiting a green space at least a few days a week than those reporting stress. The results also showed that the more often respondents visited green spaces,
the less stress they experienced. (Stigsdotter, 2010)
b. Presence/Proximity: 8 studies found that separation from nature via modern living is detrimental to
human development, health, and wellbeing and that regular contact with nature, such as provided by
parks, is required for mental health.(Maller, 2008)
c. Presence/Proximity: Scientists in the Netherlands examined the prevalence of anxiety disorders in more
than 345,000 residents and found that people who lived in residential areas with the least green spaces had a 44 percent higher rate of physician-diagnosed anxiety disorders than people who lived in the greenest residential areas. The effect was strongest among those most likely to spend their time near home, including children and those with low levels of education and income. In addition, the prevalence of physician diagnosed depression was 33 percent higher in the residential areas with the fewest green
spaces, compared to the neighborhoods with the most. (NRPA Report, 2010)
d. Presence/Proximity: In one study, researchers found that a 20-minute walk in an urban park benefited
concentration performance of children with ADHD. The performance boost was at least as large as the peak performance boost shown for two widely prescribed ADHD medications. Researchers aren’t the only ones who have tracked these benefits. In a nationwide survey, parents of kids with ADHD rated after-school activities in outdoor settings as significantly more helpful than those not in these settings. (NRPA Report, 2010)
3. Social Benefits
a. Presence/Proximity: Significant relation between both the percentage of green in 1 km (p < 0.05) and in
3 km (p < 0.01) radii around people's home and their feelings of loneliness. People with more green
space in their living environment feel less lonely. (Maas, 2009)
b. Presence/Proximity: Spending time in green outdoor common spaces is systematically related to
stronger social integration and a stronger sense of local community. In a study of inner-city older adults in Chicago, Ill., USA, the total amount of variation in sense of local community explained by exposure to
green common spaces was 5%. (Kweon, 1998)
c. Design Features: As part of Mayor Michael Bloomberg's PlaNYC 2030 and a three-way partnership
between the board of education, the department of parks and recreation and The Trust for Public Land, New York City is rebuilding derelict schoolyards for students and opening them to the full community outside school hours. Each playground renovation begins with an in-depth participatory design phase and includes a 3-month student design phase. Following reconstruction of playgrounds, observations revealed a 25% increase in structured games and competition and a 240% increase in unstructured play. Unstructured activity is valuable in helping less athletic children enjoy recreation and develop social
skills and imagination. (Harnik, 2011)
4. Environmental Benefits
a. Presence/Proximity: Carbon storage and annual removal by urban park trees and soils in the United
States is estimated at about:
• Carbon storage (trees): 75 million tons ($1.6 billion)
• Carbon storage (soils): 102 million tons of carbon ($2.1 billion)
• Annual carbon removal (trees): 2.4 million tons ($50 million) (Nowak & Heisler, 2010)
b. Presence/Proximity: Urban trees in the lower 48 states are estimated to remove 783,000 tons of
pollution per year.(NRPA Report, 2010)
c. Programs, promotion, events: Automobile traffic reduces park use. According to careful attendance
million more visitors annually to Golden Gate Park. A calculation by the Center for City Park Excellence indicates that closure of John F. Kennedy Drive seven days a week could increase total park usership by
69%, from about 12 million uses to 20 million uses a year. (Harnik, 2011)
5. Economics
a. Presence/Proximity: The value of an average home increases with proximity to neighborhood parks,
special parks, lakes, and rivers, with benefits ranging from a low of 0.0035% of sales price for every one percent decrease in the distance to the nearest neighborhood park, to a high of 0.0342% for every one percent decrease in the distance to the nearest lake. These effects are statistically significant at or near
the 1% level.(Anderson, 2006)
b. Trails: Public investments in the Platte River Greenway, Denver totaling about $70 million has fueled
$2.5 billion in residential, commercial, retail, sports and entertainment projects along the corridor. (Harnik, 2011)
c. Trails: On average about 30 percent of gross revenues were attributed to The Great Allegheny Passage
trail (higher than the 25.5% reported in the 2008-2009 survey). (Great Allegheny Passage Survey
Report, 2012)
6. Injury Prevention
a. Programs, promotions, events: In Kansas City, crime in Kessler Park decreased by 74% the year that 2.6
miles of Cliff Drive were turned car-free on weekends. (Harnik, 2011)
b. Presence/Proximity: In a study conducted in an inner-city Chicago low-rise apartment development,
building with more vegetation were associated with: lower rates of homicide, assault, robbery, theft, burglary, and arson. Buildings with high levels of vegetation had 52 percent fewer total crimes than
buildings with low levels of vegetation. (NRPA Report, 2010)
c. Public Gardens / Park Incivilities / Civilities: 8 studies found that community gardens increase
community cohesion, reduce graffiti and violence and enhance self-image of residents. (Maller, 2008)
d. Public Gardens / Park Incivilities / Civilities: In Wichita, Kansas, a garden coordinator estimated that
graffiti was reduced by about 75% and gang activity decreased after the installation of a “planting peace”
community garden. (Shefte, 2014)
Urban Design / Land Use
There were 202 entries in the urban design category. Of 30 cells (Table 9), 8 had strong evidence of co-benefits, 5 had good evidence, and 6 had moderate evidence. In the urban design category, 4 cells had moderate or good evidence of negative effects, and 1 cell had strong evidence of negative effects. Specific findings include:
• Mixed use, greenery, street scale design, and connectivity had evidence of 4 to 5 co-benefits.
• All urban design features had strong evidence of green/environmental benefits, except evidence was good for
streetscale design.
• All urban design features had evidence of economic benefits, and the evidence was strong for mixed use.
• Only greenery had strong evidence of mental health benefits. None had evidence of injury prevention benefits.
• Residential density had the most complex pattern with good evidence of negative health effects, strong evidence
of environmental sustainability, and good evidence of economic benefits.
Table 9: Urban Design / Land Use Summary Scores Built Environment Attribute Physical Health Mental Health Social Benefits Environmental Sustainability
Safety / Injury Prevention
Economic Benefits
Residential
density 19+ 21.5(0)
7.5- 13.5+ 14.5(0) 88+ 21(0) 3.5- 4.5(0) 7.5- 15+ 3.5(0)
Mixed land use 28+
17(0) 4- 4.5+ 4- 33+ 11(0) 95+ 21(0) 4.5(0) 11- 22.5+ 3.5(0) 4- Streetscale
pedestrian design 7.5+ 7.5+ 7.5+ 7+
Greenery 20.5+
3.5(0)
26.5+ 12+ 39.5+ 12+
Accessibility & Street connectivity 30+ 12(0) 7.5- 14.5+ 3.5(0) 35.5+ 3.5(0)
4.5(0) 12.5+
3.5(0)
Highlights of Key Urban Design and Land Use Findings 1. Physical Health
a. Urban greenness: Patients in hospital rooms facing a park had a 10% faster recovery and needed 50%
less strong pain medication compared to patients whose rooms faced a building wall.(Bolund, 1999)
b. Walkability: A 5% increase in walkability was associated with a … 0.23 point reduction in BMI. (Frank,
et al, 2006)
c. Density / Block size: Contrary to expectations, the hypothesised most walkable neighbourhood (high
density, small block stratum) had the greatest mean and median BMI. After adjusting for demographic covariates, physical activity and clustering due to neighbourhood, no conclusive effect of population
density by block size on BMI was found (β=−1.024, 95% CI −2.408 to 0.359). (McDonald KN, Oakes
JM, Forsyth A, 2012)
2. Mental Health
a. Urban greenness: People who lived in proximity to natural space had significantly improved mental
health up to three years after their move. Compared to pre-move mental health scores, individuals who
moved to greener areas (n = 594) had significantly better mental health in all three post-move years (P
= .015; P = .016; P = .008), supporting a “shifting baseline” hypothesis. Individuals who moved to less
green areas (n = 470) showed significantly worse mental health in the year preceding the move (P =
.031) but returned to baseline in the post-move years. (Alcock, et al, 2013)
b. Urban greenness: A moderately significant association between city forest and park and a 87% recovery
rate from stress. (Hansmann, Hug, & Seeland, 2007)
c. Urban greenness: Individuals reported less mental distress and higher life satisfaction when they were
living in greener areas. (White, 2013)
3. Social Benefits
a. Mixed use: Cross sectional study of 100 Seattle census tracts found businesses located in residential
b. Density / Mixed use: Every 1 percent increase in the proportion of individuals driving to work in a neighborhood is associated with a 73 percent decrease in the odds of any individual having a
neighborhood social tie and a 71 percent decrease in any individual having more ties (Freeman, 2001)
c. Density / Mixed use/ Connectivity: Reported crime is 5 times higher in New Urbanist layouts; 6 of the
first 7 reasons burglars stated for selecting a particular property were related to access routes. (Stone
Jr., Bachman, 2000)
4. Environmental Benefits
a. Mixed use / Density: Exhaustive review. "When viewed in total, the evidence on land use and driving
shows that compact development will reduce the need to drive between 20 and 40 percent…So, as a rule of thumb, it is realistic to assume a 30 percent cut in VMT with compact development. Making
reasonable assumptions...[this could] reduce total transportation-related CO2 emissions ...by 7 to 10
percent in 2050." (Ewing, et al, 2008)
b. Walkability: Survey of 6,994 adults in Washington state. A 5% increase in walkability was associated
with a 6.5% fewer vehicle miles traveled, 5.6% fewer grams of oxides of nitrogen emitted, and 5.5%
fewer grams of volatile organic compounds emitted. (Frank, et al, 2006)
c. Urban greenness: In Chicago, increasing tree cover in the city by 10% may reduce the total energy for
heating and cooling by 5 to 10%. (Sorensen, et al, 1997)
5. Economics
a. Walkability: Comprehensive review: making places better for walking can: boost footfall and trading by
up to 40%; raise retail rents by 20%; In a study of Hong Kong included in this review, there was a 17%
increase in retail rents from pedestrianisation. (Lawlor, 2013)
b. Walkability: Retail properties with a Walk Score® ranking of 80 were valued 54% higher than
properties with a Walk Score® ranking of 20. This was accompanied by an increase in net operating income (NOI) of 42% for the more walkable properties. Office properties showed identical higher premium values, although rental apartments showed only a 6% premium if they were in walkable locations. Walkability was associated with higher value for all types of properties. Properties with a Walk Score of 80 were worth 29% to 49% more than properties with a score of 20. Consistent with their
higher values, study found higher net operating incomes for all property types as well. (Pivo & Fisher,
2010)
c. Walkability: A careful study in 15 cities, controlling for a variety of contextual factors, found that
shifting from average to above-average Walk Score® ratings raised the housing values by $4,000 to $34,000, depending upon the metropolitan area. The amounts tended to be greater in dense urban areas such as Chicago and San Francisco and lower in low-density cities such as Tucson and Fresno. (Cortright, 2009)
d. Mixed use / Density: 60 percent of respondents favor a neighborhood with a mix of houses, stores, and
other businesses that are within walking distance, rather than neighborhoods requiring driving between home, work, and recreation. Respondents indicated that while the size of a home or yard does matter,
most are willing to compromise size for a preferred neighborhood and less commuting. (Community
Preference Survey, 2013)
6. Injury Prevention: n/a
Transportation Systems
There were 81 entries in the transportation systems category. Of 48 cells (Table 10), 5 had strong evidence of co-benefits, 2 had good evidence, and 6 had moderate evidence. One cell had good evidence of negative impact. Specific findings include:
• Pedestrian and bicycle facilities had the best evidence of multiple co-benefits, followed by lower traffic speed
• Strong evidence of co-benefits was most evident in the injury prevention and economic domains.
• Traffic calming had strong evidence of injury prevention benefits.
• Public transport had strong evidence of economic benefits and mixed evidence of environmental benefits.
• Many cells had inadequate evidence. Even in well-studied topics, there was little study of health consequences of
transportation decisions.
Environmental strategies to promote active transportation, provide public transportation, and protect pedestrians and bicyclists from automobile traffic had good to strong evidence of multiple benefits, particularly in the areas of
[image:16.612.38.579.232.502.2]economics, injury prevention, and environmental protection. Physical and mental health and social benefit consequences of transportation systems are poorly studied.
Table 10: Transportation Systems Summary Scores
Built Environment
Attribute
Physical
Health Mental Health Benefits Social Environmental Sustainability Safety / Injury Prevention Economic Benefits
Pedestrian /
Bicycle facilities 3+ 7+ 10.5+ 3.5(0) 27.5+ 4(0) 22.5+ 3.5(0)
Crosswalk
markings 6(0) 4-
Traffic calming 3.5+ 3.5(0) 3+ 3+
3-
23+ 3+
Public
Transportation 3.5- 28.5+ 17.5(0) 20+ 4-
Traffic speed/
Volume 3.5+ 3+ 14+ 7+ 7+
Safe routes to
school 3+ 3.5+ 9.5+ 4(0)
Ciclovia / Play
streets 7+ 3.5+
Managed parking 10.5+
Highlights of Key Transportation Findings 1. Physical Health
a. Traffic volume: The size of the traffic density effect is about 0.27 BMI attained units over the 10–90th
percentile of the 150 m traffic distribution. This translates into about a 5% increase in attained BMI at
age 18. (Jerrett, 2010)
b. Traffic calming: A rise in physical component summary (PCS) scores between the first and second
surveys that constituted a statistically significant improvement in physical health status. (Morrison,
2004)
c. Public transportation: Adults living in blocks with TransMilenio (bus rapid transit) stations were less
likely to have higher scores of health-related quality of life (β = –2.2; P = .041). Likewise, adults living
further than 500 m from TransMilenio stations were more likely to report perceiving their health status
2. Mental Health
a. Traffic calming: Mental component summary scores (MCS) fell slightly in men and improved slightly in
women between the first and second surveys, but neither change was statistically significant. (Morrison,
2004)
3. Social Benefits
a. Ciclova: 89% of participants said the event changed their feelings for the city in a positive way and 74%
felt the city was more vibrant during the event. The majority strongly agreed/agreed (88.1%) that Open
Streets strengthens the local community. (Hipp, 2013)
b. Public transportation: Among those who say their community is served by public transit, 75% say they
are satisfied with its quality. Among residents who are denied access to mass transit because their area
does not offer it, half (51%) say they are dissatisfied with the lack of availability. (Urban Land Institute,
2013)
c. Traffic calming: One study found that traffic calming helps make public streets lively and friendly,
encourages community interaction, and attracts customers to commercial areas. (Litman, 1999)
4. Environmental Benefits
a. Public transportation: Public transportation produces 95% less carbon monoxide (CO), 90% less in
volatile organic compounds (VOCs), and about half as much carbon dioxide (CO2) and nitrogen oxide
(NOx), per passenger mile, as private vehicles. (Shapiro, 2002)
b. Ped/bike infrastructure (sidewalks): The addition of sidewalks to all roadways would lead to a VMT
reduction of 1.142 miles per person-day. This equates to a total of 182.938 million miles reduced across the entire population of Dane County during year 2002. Multiplying this VMT reduction amount by the average unit cost of $0.045 per vehicle-mile for motor vehicle air pollution (VTPI, 2006) gave an annual
air pollution cost saving of $8.23 million. (Guo, 2010)
5. Injury Prevention
a. Traffic calming / Ped/bike infrastructure: Modification of the built environment can substantially
reduce the risk of pedestrian-vehicle crashes. Highly effective countermeasures include: single-lane roundabouts, sidewalks, exclusive pedestrian signal phasing, pedestrian refuge islands and increased
intensity of roadway lighting. (Retting, 2003)
b. Safe Routes to School: After SRTS interventions, annual rate of pedestrian injury decreased 33% (95%
confidence interval [CI]: 30 to 36) among school-aged children (5- to 19-year-olds) and 14% (95% CI: 12 to 16) in other age groups. Annual rate of school-aged pedestrian injury during school-travel hours decreased 44% (95% CI: 17 to 65) from 8.0 injuries per 10,000 population in the pre-intervention period (2001-2008) to 4.4 injuries per 10,000 population in the post-intervention period (2009-2010) in census tracts with SRTS interventions. The rate remained virtually unchanged in census tracts
without SRTS interventions (0% [95% CI: -8 to 8]). (Dimaggio, 2013)
c. Traffic calming (Road Diet): Road diets typically reduce crash rates by 47% on major highways through
small urban areas, by 19% on corridors in larger city suburban areas, and 29% overall. (USDOT)
d. Ped/bike infrastructure (complete streets) / Traffic speeds: Lower traffic speeds as a result of complete
streets tend to reduce traffic collision rates and severity, and therefore crash costs, particularly injury
risk for pedestrians and cyclists. (USDOT)
e. Ped/bike infrastructure (Bike lanes): There are consistent data (two review studies) showing that
marked bike lanes on roads reduce motor vehicle–bicycle collisions by as much as 50%. (Pollack, 2012)
6. Economic Benefits
a. Health care costs; Economic performance of cities: By 2040, investments in bike facilities in the range
of $138 to $605 million will result in health care cost savings of $388 to $594 million, fuel savings of $143 to $218 million, and savings in value of statistical lives of $7 to $12 billion. The benefit-cost ratios for health care and fuel savings are between 3.8 and 1.2 to 1, and an order of magnitude larger when
b. Traffic volume: A further externality of private motorized transport is traffic congestion that imposes significant costs on economic efficiency as time lost due to congestion reduces productivity. Congestion costs in Canada are as high as US$4.5 billion nationally of which 80% is accounted for by the country’s three largest urban regions: Greater Toronto (43%), Montreal (21%) and Vancouver (17%). In the US, congestion has led urban Americans to travel 5.5 billion hours more and to purchase an extra 11 billion litres of fuel for congestion-related costs of US$121 billion in 2011.150 In 2005, the cost of congestion in Australia’s eight capital cities was US$7.1 billion, comprised of private time costs (37%), business time costs (38%), extra vehicle operating costs (13%) and extra air pollution (12%). The immense economic impact of traffic congestion is further illustrated by the case of Cairo, which costs Egypt as much as 4%
of its GDP. (UNHSP)
c. Ped/bike infrastructure (bike lanes): A conservative estimate of the annual economic impact of the
bicyclists is $60 million. The annual economic impact of cyclists is almost nine times as much as the one-time expenditure of public funds used to construct special bicycle facilities in the region (Outer
Banks, NC). (Lawrie, 2004)
d. Ped/bike infrastructure: Almost all of the studies (n=20) identified (UK and beyond) report economic
benefits of walking and bicycling interventions which are highly significant, and these average 13:1. For
UK interventions only the average figure is higher, at 19:1. (Davis, 2010)
e. Public transportation: It is estimated that every $10 million in capital investment in public
transportation yields $30 million in increased business sales, and that every $10 million in operating investment in public transportation yields $32 million in increased business sales. For every $10 million invested, over $15 million is saved in transportation costs to both highway and transit users. These costs
include operating costs, fuel costs, and congestion costs. (Cambridge Systematics, 1999)
f. Ped/bike infrastructure (bike trail): For every quarter mile nearer to an off-street bicycle trail, the
median home value increases by $510 in Minneapolis-St. Paul, MN. (Krizek, 2006).
g. Pedestrian/bicycle infrastructure (Biking vs auto use): In Portland, OR, people who traveled to a
shopping area by bike spent 24% more per month than those who traveled by car ($75.66 vs. $61.03 per
month, respectively). (Clifton, 2012)
Schools
There were 27 entries in the school setting category. Of 18 cells (Table 11), 2 cells had strong evidence of co-benefits, 1 cell had good evidence, and 5 cells had moderate evidence. Specific findings include:
• Siting schools near the homes of students had strong evidence of environmental sustainability and moderate
evidence of mental health and economic benefits.
• Having recreation facilities at schools had strong evidence of mental health and good evidence of physical health
benefits.
• Shared use agreements had moderate evidence of social benefits, injury prevention, and economic benefits.
[image:18.612.42.573.553.690.2]The co-benefits of school environment features were poorly studied for most outcomes.
Table 11: Schools Summary Scores Built
Environment Attribute
Physical
Health Mental Health Benefits Social Environmental Sustainability Safety / Injury Prevention Economic Benefits
School siting 3.5+ 4.5+ 21.5+ 3- 4+
Recreation
facilities 16+ 3.5(0) 16.5+ 3.5+ 3.5+
Shared use
Highlights of Key School Findings 1. Physical Health
a. Recreation facilities: Obesity was negatively related to child-reported but not parent-reported access to
physical activity facilities and availability of bicycle and walking trails. (Dunton, 2008)
b. Recreation facilities: The number of locked schoolyards was positively related to obesity in children
BUT proximity to playgrounds, parks and play areas were unrelated to BMI in children. (Dunton, 2008)
c. Recreation facilities: Weight of youth is inversely to the spatial accessibility to recreational physical
activity facilities. A literature review showed 4 of 9 studies where excess weight was inversely associated
to the accessibility of various recreational infrastructures. (Casey, 2014)
d. Recreation facilities: Gymnasium and playground provision in 5th grade were not predictive of a lower
obesity or overweight trajectory both overall and for stratifications separately by gender, obesity, or overweight status in kindergarten, household poverty, region, and climate zone. Gymnasium availability was associated with an additional 8.3 min overall and at least an additional 25 min of PE per week for schools in humid climate zones; but, no significant findings were obtained for gymnasium and
playground adequacy in relation to obesity trajectory. (Fernandes, 2010)
e. Recreation facilities: Schools represented 44% of potential neighborhood sites for physical activity and
the number of locked schools was associated with significantly higher BMI. (Scott, 2007)
2. Mental Health
a. Recreation facilities: Controlling for the racial/ethnic composition of a school and the percent of
students receiving reduced or free lunches, schools that had a renovated schoolyard had more of their
students passed the state mandated math test (Lopez, 2008).
b. Recreation facilities: CRF (college recreation facility) usage, while simultaneously controlling for other
important academic, financial and social fit factors, had a positive association with academic success (Huesman, 2007). Freshmen who used the SRC (student recreation complex) persisted (didn't drop out) at a greater rate after 1 semester and after 1 year than their counterparts who did not use the SRC. Users earned slightly higher GPAs and more credit hours at the end of the first year. This finding was of particular interest because the study also revealed that the SRC nonusers entered college with higher
high school GPAs and higher ACT/SAT scores than SRC users. (Belch, 2000)
c. Recreation facilities: Teachers reported that children were more social, creative, and resilient when
unstructured play materials were provided on the playground. Children who were creative, rather than very physically capable, became leaders in activity; the unstructured materials promoted play between children who had not played together previously--including children who had formerly been excluded. (Bundy, 2008)
3. Social Benefits
a. Joint use agreements: All 68 faculty/staff respondents agreed that the joint use program had a positive
impact on the school and that it was beneficial to students. They reported that the program provided needed opportunities for PA, incurred social benefits (e.g., making new friends), kept students out of
trouble, and promoted healthy lifestyles. (Maddock, 2008)
b. Joint use agreements: Public schools can serve as community “hubs,” and offer a range of medical,
social, and other support services. (Filardo, 2010)
c. Joint use agreements: On-site services that promote intergenerational use, such as health care, job
training, or a senior center, give seniors and childless professionals a vested interest in their
neighborhood school. (Chung, 2002)
4. Environmental Benefits
a. School siting: Neighborhood schools produce less emissions than schools located on outskirts of town.
b. School siting: Emissions are 3−8 times lower for the neighborhood-only scenario as for the current scenario; distance traveled by automobile is more than cut in half. Busing rate drops by more than half
and busing distance declines by more than an order of magnitude. (Marshall, 2010)
c. School siting: A Safe Route to School program in Marin County, California calculated that, after the
fourth year, the percentage of children arriving and leaving school in a family car dropped from 55 percent to 42 percent, or 4,250 fewer car trips per day. This represents an annual reduction of roughly
1,000 tons of carbon dioxide emissions and 70 tons of other environmental pollutants. (Staunton,
2003)
5. Economics
a. School Siting: The presence of a local school supports higher property values. (Kuhlman, 2010)
b. School siting (community-centered schools): Keeping an existing school open increases home values in
surrounding neighborhoods and helps stabilize the area and its business activity, while closing them
slows the rise of home values. (Kuhlman, 2010)
c. School Siting: Building new schools costs more than renovating old schools. (Kuhlam, 2010)
d. School siting: Community-centered schools save on construction and operating costs. (Kuhlman, 2010)
e. School siting: School construction on undeveloped sites generates many new expenses for infrastructure
and government services, which eventually raise taxes for business and property owners. (Michigan
Land Use Institute)
f. Joint use agreements: Joint use partnerships can help the partners save money by reducing land costs
and allowing partners to share costs of space and programming. Partners may bring funding for capital
expenses or operating costs. (Cooper, 2008)
g. Joint use agreements: Using the public school as the location for community health centers, swimming
pools, libraries, or other public amenities or services, can thereby reduce overall public land assets,
capital funds, and total operating costs required (Filardo, 2010).
h. Joint use agreements: Joint use agreements allow a community to offer programs, facilities, and
services that it might otherwise not be able to afford. (Nathan, 2001)
6. Injury Prevention
a. Joint use agreements: Sharing community facilities such as libraries, parks and meeting spaces is a
sound community strategy that not only saves money and space, but also unites the public school and neighborhood through shared uses. Restoring the public character of public schools by serving as a community hub encourages members of the community to put their own resources into the school, including volunteer maintenance, mentoring, donations and cultural resources. Moreover, as a community hub, there are more eyes on the school grounds, and thus a greater degree of safety in the
school and in the neighborhood. (Chung, 2002)
Buildings / Workplaces
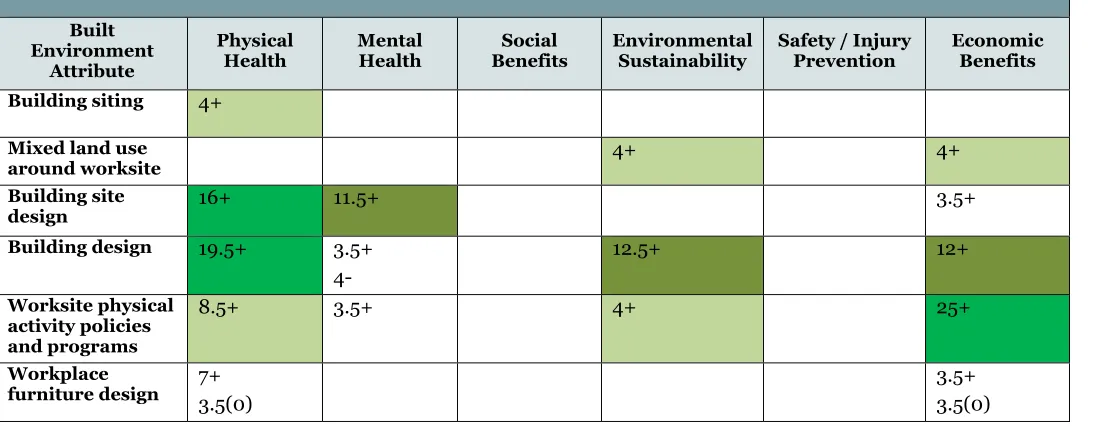
There were 39 entries in the workplace/building category (Table 12). Of 36 cells, 3 cells had good evidence of co-benefits and 3 cells had strong evidence. Specific findings include:
• Building site design features (mainly outdoor) had strong evidence of physical and good evidence of mental
health benefits.
• Features of the building design had strong evidence physical health and good evidence of environmental
sustainability and economic benefits.
• Physical activity programs and policies had strong evidence of economic benefits.
• 5 cells had evidence of moderate evidence.
Table 12: Workplaces / Buildings Summary Scores
Built Environment
Attribute
Physical Health
Mental Health
Social Benefits
Environmental Sustainability
Safety / Injury Prevention
Economic Benefits
Building siting 4+
Mixed land use
around worksite 4+ 4+
Building site
design 16+ 11.5+ 3.5+
Building design 19.5+ 3.5+
4-
12.5+ 12+
Worksite physical activity policies and programs
8.5+ 3.5+ 4+ 25+
Workplace
furniture design 7+ 3.5(0) 3.5+ 3.5(0)
Highlights of Key Workplaces and Buildings Findings
1. Economics: Productivity/Job Performance/Healthcare Costs
a. Worksite health program: Although the results of worksite health promotion (WHP) programs are
limited as to the impact on health and long-term outcome measures, but seems positive. Specific risk factors account for 25% of total employer health care costs, particularly employees with multiple co-morbidities of modifiable risk factors; ones with 7 of the risk factors (tobacco use, hypertension, hypercholesterolemia, overweight/obese, high blood glucose, high stress and lack of PA) costs employees 228% more in health care costs compared with those lacking any of these risk factors. Reviews found that because WHP programs vary a lot it is hard to declare the cost of savings but at least
$3 savings per $1 invested. (Goetzel & Ozminkowski, 2008)
b. Worksite health program: Employees who participate in WHP programs have lower absentee rates,
where the more comprehensive the program is, the greater the improvement (ex: 12%). (Aldana &
Pronk, 2001; Bertera, 1993)
c. Worksite health program: Large employers adopting wellness programs see substantial positive returns,
even within the first few years after adoption. Employee wellness programs costs $144 and generates $358 worth of savings per person through reducing healthcare costs. Medical costs fall about $3.27 for every dollar spent on wellness pro- grams, and absentee day costs fall by about $2.73 for every dollar
spent. (Baicker et al., 2010)
d. Worksite fitness center: Participation in worksite fitness centers is significantly associated with
improved productivity and reduced work absence. Additionally those who did not join the fitness center were nearly twice as likely as participants to report health-related work limitations in time management and physical work, and 1.5 times as likely to report limitations in overall output. Assuming an average wage of US$200 per day, it was calculated that nonparticipants cost $258 more in lost work time per
employee than participants. (Burton et al., 2005)
e. Building design: The “StairWELL to better Health” CDC intervention is a low-cost intervention (less
than $16,000) that increases stair users (involves painting and carpeting, framed artwork, motivational signs, and music to the stairwell). Infrared beams were used to track the number of stair users.
(StairWELL CDC)
f. Building design: Lighting, particularly daylighting (lighting through daylight) has consistently shown to
absenteeism in office environments, and increases between 2.8-20% due to luminance levels have been found in other studies. Due to individual variation and preferences, providing the means of thermal and ventilation control to individuals is ideal. Personal control over temperature, air supply, sound masking
and lighting are associated with a 3% increase in productivity. (CABE, 2004)
g. Building design: In a case study in CA, Thayer identified 50% savings in lighting, cooling and ventilation
energy as well as a 15% reduction in absenteeism, due to an integrated daylighting design that
harmonized layout, orientation, and windows. (CABE, 2004)
2. Mental Health
a. Building design: High-rise housing is associated with elevated psychological distress, especially among
low-income mothers. The quality of the neighborhood, in terms of social and physical attributes, are associated with greater psychological distress and poorer cognitive development in children in lower
quality neighborhoods. (Evans, 2003)
3. Physical Health (Chronic Diseases)
a. Worksite health program: Comprehensive worksite health promotion programs, that include 1) training
and support of coordinators; 2) health risk appraisals; 3) on-site classes, safety meetings, and self-help options; 4) environmental changes, e.g., smoking policy, cafeteria offerings, and blood pressure machines; and 5) recognition, decreased the number of employees with three or more risk factors by 14% and risk levels improved among high-risk individuals in 6 of the 7 risk factors (i.e. BP, cholesterol,
etc.) over two years. (Bertera, 1993)
b. Standing desk: A sit-stand workstation paradigm reduces musculoskeletal complaints without
considerably affecting data entry efficiency. (Huseman et al., 2009)
c. Standing desk: Differences as high as 25% have been attributed to differences in employees who report
being comfortable vs. uncomfortable. Even improved workstations with ergonomic chairs are associated
with a 23% increase in computer data entry and editing. (CABE, 2004)
d. Building design: Air quality studies have shown that buildings that improve delivery of outside air are
attributed to a decrease in Sick Building Syndrome (SBS). SBS is related to productivity, and it is estimated that a 10% reduction in reported SBS symptoms is associated with a 1.1% in productivity
among employees. (CABE, 2004)
4. Environmental Benefits
a. Mixed use: Residents of mixed-use neighborhoods use less motorized travel than those in purely
residential areas, where the average distance per trip was half of those in single use areas; also residents used alternative transportation more--12.2% of the time compared to 3.9% of the trips in single use areas. This can reduce VMT by at least 4% for an entire region or, in specific dense sections, VMT can be
reduced by as much as 17.6%. (Ewing & Kreutzer, 2006)
Review of Grey Literature in Europe
Cavill Associates, based in London, were commissioned to search the grey (not peer reviewed) literature for studies of co-benefits in the European region. The purpose was to ensure incorporation of international literature, and we expected most such literature to be from Europe. They found 31 reports with relevant information, mostly from
advocacy organizations, and they found 59 mentions of co-benefits of activity-friendly environments. Their examples of specific and quantitative findings are included here. Their findings are also included in the matrix tables reported above.
Co-benefits Identified in European Studies
1. Economic Benefits, including positive economic impact; improved tourism; increased housing prices; job creation; community cohesion.
a. Proximity to parks: Moderate to strong evidence that urban parks have a positive impact on the value of
nearby property (houses, apartments, land), although it is important to keep the limitations of the
2013)
b. Ped/bike infrastructure (bicycle): Annual economic benefit of cycling in the EU -27 of at least 205bn
Euros. The largest single benefit is health (80% of the total). The economic impact of cycling for tourism and the cycling industry amounts to 62 bn Euros; Congestion easing through cycling saved 24.2bn Euro (in 2010); fuel savings were 2.7-5.9 bn; reduced CO2 emissions 1.4-3.0bn Euros; reduced air pollution
0.9bn Euro; reduced noise pollution 0.3bn Euro (Davies N, et al, 2012)
c. Walkability: Walkability affects consumer transport costs. Improved walkability allows consumers to
save on vehicle expenses (“Affordability,” VTPI 2008). For example, one study found that households in automobile-dependent communities devote 50% more to transportation (more than $8,500 annually) than households in communities with more accessible land use and more multi-modal transportation
systems (less than $5,500 annually) (Litman, 2011)
2. Environmental Benefits, including general environmental benefits; improved air quality; reduced noise; reduced energy use and Carbon dioxide emissions; Integration of environmental and health concerns; improved biodiversity, air quality, water management; greater use of green space.
a. Cycling as transport: Between 1990 and 2007 greenhouse gas emissions from transport increased by
36% in the EU. By 2050the EU has set a target to reduce green house gas emissions by 80-95% (60% will need to come from transport sector). Emissions from bicycles are 10 times less than those from motorized vehicles. If levels of cycling in EU were equivalent to those of Denmark, bike use would help
achieve 12-26% of the 2050 target dependant on which transport mode the bike replaces. (Blondel, et
al, 2011)
b. Spatial Planning: There are 4 key spatial planning issues identified as likely to have more significant
impacts on health; transportation public spaces, housing and flooding.1/4 of the global disease burden is attributable to environmental factors. . The report found strong evidence that: the provision of space increases exercise; reductions in traffic reduces air pollution; green space improves mental health; moderate exercise improves health outcomes; provision of space to exercise needs to be safe and easily accessed. (Boyce and Pate, 2009)
c. Transport policy: Transport uses 30 per cent of total energy. Since the end of the 1990s, overall energy
consumption has been increasing across Europe. (Grenier and Cavill, 2007)
3. Injury Prevention, including reductions in injuries due to increase in modal share of walking and cycling and decline of motorised transport volume and speed.
a. Road design: Road design has a key influence on speed, excess and inappropriate speed contributes to
around 30% of fatal crashes in high income countries. Vulnerable road users are at particular risk. Pedestrians have a 90% chance of surviving a car crash at speeds below 30 kph. There is increased risk of death or serious injury between the ages of 10 - 11 years, with boys at greater risk than girls (65% of those killed or seriously injured are boys. 74% of casualties are on minor roads and the likelihood of dying as a car occupant is 5.5 times higher if parents are unemployed. Recommendations: Senior public health official required to support local highways authorities; Highways authorities should introduce engineering measures to reduce speeds in streets that are primarily residential or where cycle and
walking levels are high. (NICE, 2010)
b. Cycling City Policy: The number of cyclists killed or injured in accidents involving more than one party
was reduced by 20 per cent between 1999-2002. (Troelson et al, no date)
c. Transport policy: From the mid 1990s to 2000, road traffic fatalities declined in several EECA and SEE
countries, probably due to the economic recession (since lower growth is correlated with lower transport volumes) rather than road safety strategies. From 2000 to 2004-5 SEE countries showed a
slight decrease in the number of persons killed in traffic. (Grenier & Cavill, 2007)
4. Mental Health Benefits, including improvements to stress, wellbeing, mental health and cognitive function.
a. Green environments: Compared with exercising indoors, exercising in natural environments was
associated with greater feelings of revitalization and positive engagement, decreases in tension,