Dynamic topologies for sustainable and energy efficient traffic engineering in communication networks
190
0
0
Full text
(2)
(3) Abstract Energy consumption and related emissions have been in the public focus for some time. Contributions of the Information and Communication Technology (ICT) sector to increase the Greenhouse Gas (GHG) emissions are growing. Networks are responsible of a significant portion of the ICT energy footprint and are generally dimensioned for peak loads. For extended off-peak periods, resources continue to consume power, but are lightly used or unused. The goal of this project is to reduce power consumption in communication networks through network management techniques. This research investigates the concept of dynamic topologies, i.e. networks that adapt their topology according to traffic volume. In contrast to related work, this thesis addresses networks where nodes are both emanating and consuming traffic. This requires power models for routers and a reduced functionality power-state is proposed that bridges local demands to a single interface. The key aim of this study was to investigate power reductions that can be achieved by dynamic topologies. It proposes a novel network transformation and introduces mathematical programming models that result in energy-optimal topologies for given traffic loads. This part focuses on the optimisation problems and studies gains in static environments. Numerical results are presented for example networks using a large set of traffic matrices..
(4) ii Efficient heuristics are necessary for larger networks as mathematical programming models cannot be solved in practical time frames. Two sets of algorithms are proposed to find minimal network topologies. These rely either on link utilisation or node gravity to decide whether active devices can be switched off. To avoid hot spots and link overloads, shortest path weight setting techniques are implemented. Network resilience to failure is an important requirement of network operators. To account for resilience constraints, two additional programming models are formulated; one that protects individual links and one that protects traffic demands. Both models are studied and energy savings are compared to the original models. To demonstrate the feasibility of the approach a potential implementation of dynamic topologies using Multi Protocol Label Switching (MPLS) networks is introduced. Most MPLS functions and nodes are not affected by the proposal. A flow tracking and topology tracking mechanism is required at the network ingress; and all nodes have to include a power management function that controls the power state of routers. The impact of changes in routing patterns on active UDP and TCP flows has been investigated and found to be minimal. Aggregated flow-based performance has been analysed and the results show that there is no discernable impact on network performance. Adapting topologies of computer networks dynamically to traffic volumes is feasible and can lead to significant reductions in energy footprints. For the test networks, dynamic topologies reduce the average network power consumption, by 12-52 per cent depending on network load..
(5) Certification of Dissertation I certify that the ideas, designs and experimental work, results, analyses and conclusions set out in this dissertation are entirely my own effort, except where otherwise indicated and acknowledged. I further certify that the work is original and has not been previously submitted for assessment in any other course or institution, except where specifically stated.. A BDELNOUR M OHAMED A LNOUR A LDRAHO. Signature of Candidate. Date. ENDORSEMENT. Signature of Supervisor/s. Date.
(6)
(7) Acknowledgments My journey from 2009 until the present time has been long and filled with both happiness and sadness. Thankfully, with immeasurable help and support from many people, I have managed to survive so far. Therefore, I would like to express my deepest honour and appreciation to these wonderful people. My advisor, Dr. Alexander A. Kist has been a phenomenal source of inspiration and motivation throughout my PhD. I have learned a lot from his insights into problem solving and his work ethic. It is through his support, guidance and constant encouragement that I have been able to bring this work to a completion. I thank him profoundly. My wife has been unbelievably patient and supportive throughout what might have seemed to her a lengthy journey. My kids whose were asking me continually about my study. My parents have supported me remotely, asking me about every single issue and making supplication for me. I would like to thank them all for their support as I feel lucky to have them by my side. Dr. Andrew Maxwell, my associate supervisor, has also given me helpful advice and ongoing support throughout my candidature.. A BDELNOUR M OHAMED A LNOUR A LDRAHO University of Southern Queensland July 2013.
(8)
(9) Contents. Abstract. i. Acknowledgments. iv. List of Figures. xi. List of Tables. xv. Publications. xvi. Chapter 1 Introduction. 1. 1.1 Motivation and Scope . . . . . . . . . . . . . . . . . . . . . . . .. 4. 1.2 Summary of Original Contributions . . . . . . . . . . . . . . . .. 6. 1.3 Structure of the Thesis . . . . . . . . . . . . . . . . . . . . . . .. 8. Chapter 2 Background 2.1 Greenhouse Gas Emissions and Global Warming . . . . . . . .. 11 12.
(10) CONTENTS. vi. 2.2 The ICT Sector and Energy Efficiency . . . . . . . . . . . . . . .. 13. 2.3 Communication Networks and Energy Use . . . . . . . . . . .. 17. 2.4 Traffic Management and Network Optimisation . . . . . . . . .. 22. 2.5 Dynamic Topologies . . . . . . . . . . . . . . . . . . . . . . . .. 25. 2.6 Conclusion . . . . . . . . . . . . . . . . . . . . . . . . . . . . . .. 27. Chapter 3 Dynamic Topologies as a Multi-Commodity Flow Problem 29 3.1 Introduction . . . . . . . . . . . . . . . . . . . . . . . . . . . . . 3.1.1. 30. Motivation and Related Works . . . . . . . . . . . . . . .. 31. 3.2 Notation . . . . . . . . . . . . . . . . . . . . . . . . . . . . . . .. 32. 3.3 Assumptions and Node Standby Power Model . . . . . . . . . .. 32. 3.3.1. Standby Options. . . . . . . . . . . . . . . . . . . . . . .. 34. 3.3.2. Power Consumption Estimates . . . . . . . . . . . . . .. 37. 3.4 Multi-Commodity Flow Problem Formulation . . . . . . . . . .. 38. 3.4.1. Intuitive Network Model . . . . . . . . . . . . . . . . . .. 39. 3.4.2. Generic Link Flow Formulation . . . . . . . . . . . . . .. 40. 3.5 Node Bypass Transformation . . . . . . . . . . . . . . . . . . .. 42. 3.6 Node Bypass Problem Formulation . . . . . . . . . . . . . . . .. 46. 3.7 Simulation Configuration . . . . . . . . . . . . . . . . . . . . .. 48.
(11) CONTENTS. vii. 3.7.1. Test Networks . . . . . . . . . . . . . . . . . . . . . . . .. 48. 3.7.2. Device Power Model . . . . . . . . . . . . . . . . . . . .. 51. 3.7.3. Integer Linear Programming (ILP) Solver . . . . . . . .. 52. 3.8 Results . . . . . . . . . . . . . . . . . . . . . . . . . . . . . . . .. 52. 3.8.1. Eight Node Network – Bridged-All. . . . . . . . . . . . .. 3.8.2. Eight Node Network – Bridged-Local and Default Gateway 57. 3.8.3. Comparison of Power Consumption . . . . . . . . . . .. 57. 3.8.4. Twenty Two Node Network – Bridged-All . . . . . . . . .. 60. 3.9 Discussion . . . . . . . . . . . . . . . . . . . . . . . . . . . . . .. 61. 3.10 Conclusion . . . . . . . . . . . . . . . . . . . . . . . . . . . . . .. 64. Chapter 4 Algorithms to Generate Dynamic Topologies. 53. 67. 4.1 Introduction . . . . . . . . . . . . . . . . . . . . . . . . . . . . .. 68. 4.2 The Lightest Node First Algorithm (LNF) . . . . . . . . . . . . .. 69. 4.3 The Least Loaded Nodes Algorithm (LLN) . . . . . . . . . . . .. 72. 4.4 Improved Heuristics using Weight Settings . . . . . . . . . . . .. 73. 4.4.1. The Lightest Node First Algorithm with Weight Setting .. 74. 4.4.2. The Least Loaded Nodes Algorithm With Weight Setting. 75. 4.5 Evaluation and Analysis . . . . . . . . . . . . . . . . . . . . . .. 75.
(12) CONTENTS. viii. 4.5.1. Test Network and Traffic Data . . . . . . . . . . . . . . .. 76. 4.5.2. Network Power Consumption . . . . . . . . . . . . . . .. 77. 4.6 Simulation Results . . . . . . . . . . . . . . . . . . . . . . . . . .. 77. 4.6.1. Lightest Node First Algorithm (LNF) . . . . . . . . . . .. 78. 4.6.2. Least Loaded Nodes Algorithm (LLN). 80. 4.6.3. Lightest Node First Algorithm With Weight Setting (LN-. . . . . . . . . . .. FWS) . . . . . . . . . . . . . . . . . . . . . . . . . . . . . 4.6.4. 81. Least Loaded Nodes Algorithm With Weight Setting (LLNWS) . . . . . . . . . . . . . . . . . . . . . . . . . . . . .. 84. 4.7 Discussion . . . . . . . . . . . . . . . . . . . . . . . . . . . . . .. 86. 4.8 Conclusion . . . . . . . . . . . . . . . . . . . . . . . . . . . . . .. 87. Chapter 5 Dynamic Network Topologies and Network Resilience Constraints. 89. 5.1 Introduction . . . . . . . . . . . . . . . . . . . . . . . . . . . . .. 90. 5.2 Related Works . . . . . . . . . . . . . . . . . . . . . . . . . . . .. 91. 5.3 Problem Formulation . . . . . . . . . . . . . . . . . . . . . . . .. 93. 5.3.1. Problem (1) - Links are Protected . . . . . . . . . . . . .. 94. 5.3.2. Problem (2) - Demands are Protected . . . . . . . . . .. 95. 5.4 Evaluation and Analysis of Topologies . . . . . . . . . . . . . .. 96.
(13) CONTENTS. ix. 5.4.1. Network and Traffic . . . . . . . . . . . . . . . . . . . . .. 97. 5.4.2. Resulting Topologies . . . . . . . . . . . . . . . . . . . .. 97. 5.5 Network Energy Consumption . . . . . . . . . . . . . . . . . . . 101 5.6 Discussion . . . . . . . . . . . . . . . . . . . . . . . . . . . . . . 103 5.7 Conclusion . . . . . . . . . . . . . . . . . . . . . . . . . . . . . . 105. Chapter 6 Potential Dynamic Topology Implementations. 106. 6.1 Introduction . . . . . . . . . . . . . . . . . . . . . . . . . . . . . 107 6.2 Topology Management Using Open Shortest Path First (OSPF). 109. 6.3 Topology Management using MPLS . . . . . . . . . . . . . . . . 112 6.3.1. Network Management Function (NMF) . . . . . . . . . 112. 6.3.2. Topology and Flow Tracker (TFT) . . . . . . . . . . . . . 113. 6.3.3. Power Management Function (PMF) . . . . . . . . . . . 115. 6.3.4. Operation . . . . . . . . . . . . . . . . . . . . . . . . . . 115. 6.4 Performance of Real Time and Non-Real Time Flows . . . . . . 119 6.5 Simulation Environment . . . . . . . . . . . . . . . . . . . . . . 121 6.6 Simulation Results – DTM Operations . . . . . . . . . . . . . . 123 6.7 Simulation Results – Performance . . . . . . . . . . . . . . . . . 126 6.7.1. Background Web Traffic . . . . . . . . . . . . . . . . . . 126.
(14) CONTENTS. x. 6.7.2. UDP Traffic . . . . . . . . . . . . . . . . . . . . . . . . . 128. 6.7.3. Elastic TCP Traffic . . . . . . . . . . . . . . . . . . . . . . 129. 6.7.4. Power Savings and Flow State Timers . . . . . . . . . . . 129. 6.8 Operational Considerations . . . . . . . . . . . . . . . . . . . . 132 6.9 Conclusion . . . . . . . . . . . . . . . . . . . . . . . . . . . . . . 134. Chapter 7 Conclusions. 135. 7.1 Summary . . . . . . . . . . . . . . . . . . . . . . . . . . . . . . . 135 7.2 Contributions to this field . . . . . . . . . . . . . . . . . . . . . 137 7.3 Further Work . . . . . . . . . . . . . . . . . . . . . . . . . . . . . 138. Bibliography. 140.
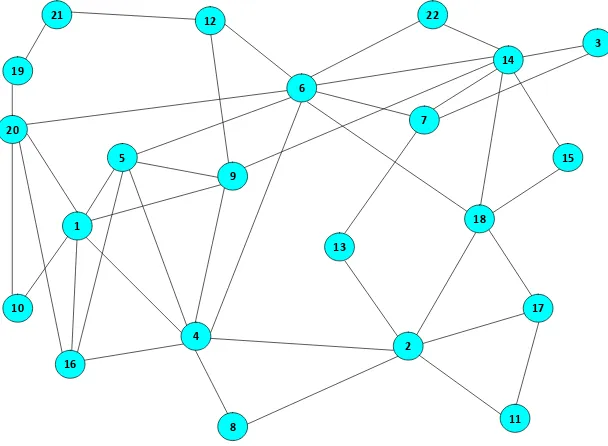
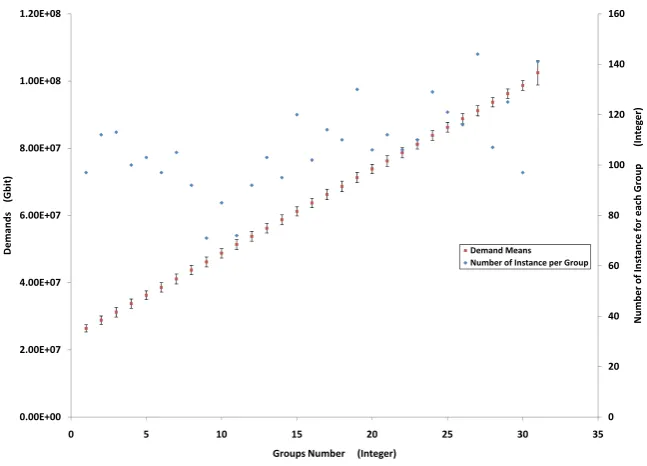
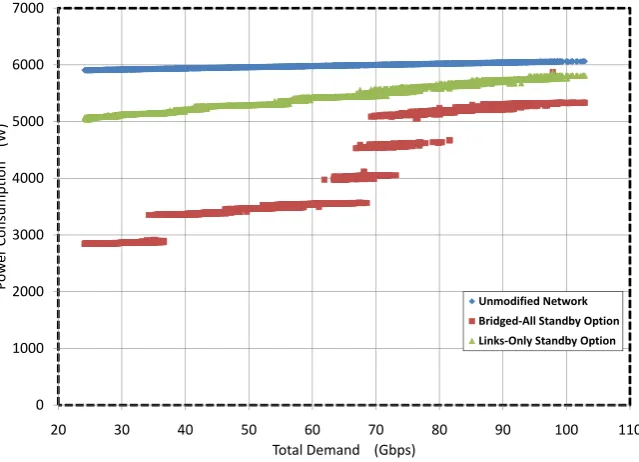
(15) List of Figures. 3.1 Low power state options . . . . . . . . . . . . . . . . . . . . . .. 36. 3.2 Extended node splitting transformation: a) original and (b) transformed . . . . . . . . . . . . . . . . . . . . . . . . . . . . . . . .. 41. 3.3 Node Bypass Transformation Algorithm . . . . . . . . . . . . .. 43. 3.4 Extended node splitting transformation: (a) original and (c) extended transformed network . . . . . . . . . . . . . . . . . . . .. 45. 3.5 Test topology – Eight nodes. . . . . . . . . . . . . . . . . . . . .. 48. 3.6 Test topology – Twenty Two nodes. . . . . . . . . . . . . . . . .. 49. 3.7 Demand Grouping. . . . . . . . . . . . . . . . . . . . . . . . . .. 50. 3.8 Power consumption versus total demand; eight node network; original network, links-only and bridged-all standby options. .. 53. 3.9 Number of active nodes versus total demand; 8 node network; bridged-all standby option. . . . . . . . . . . . . . . . . . . . .. 55. 3.10 Number of active nodes versus demand groups; eight node network; bridged-all standby option. . . . . . . . . . . . . . . . . .. 55.
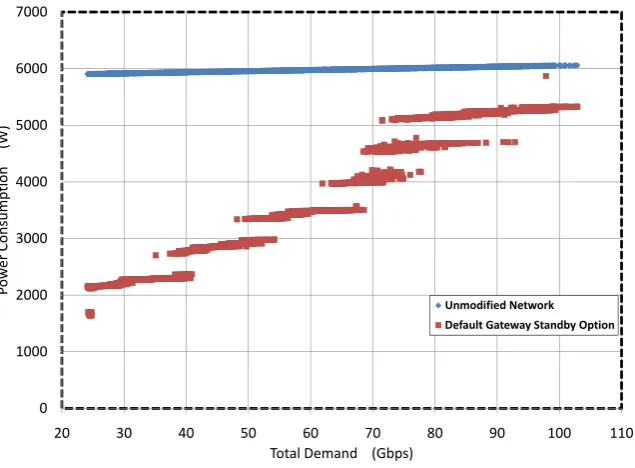
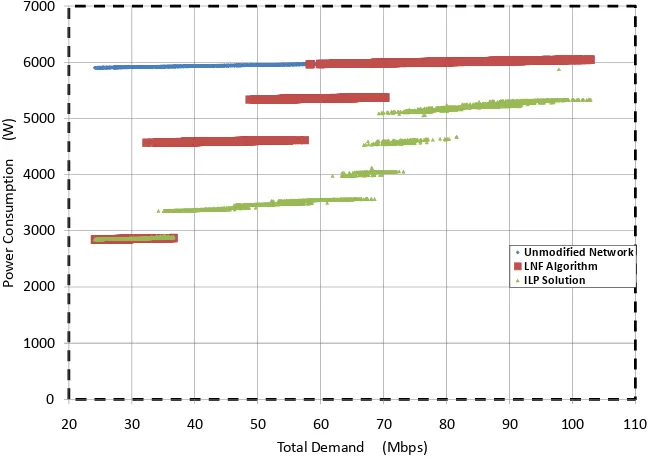
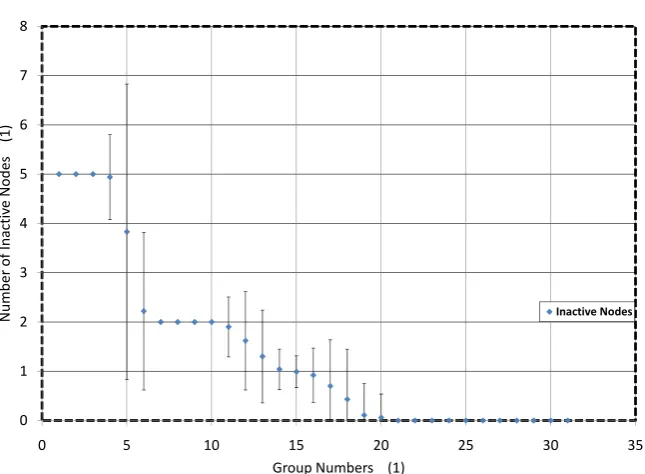
(16) LIST OF FIGURES. xii. 3.11 Power consumption versus total demand; 8 node network; original network and bridged-local standby options. . . . . . . . .. 58. 3.12 Power consumption versus total demand; eight nodes; original network and default gateway standby options. . . . . . . . . .. 58. 3.13 Number of active nodes versus demand groups; 8 nodes; bridgedlocal standby option. . . . . . . . . . . . . . . . . . . . . . . . .. 59. 3.14 Number of active nodes versus demand groups; eight nodes; default gateway standby option. . . . . . . . . . . . . . . . . . .. 59. 3.15 Power consumption versus total demand; 22 nodes; original network, links-only and bridged-all standby options. . . . . . .. 62. 3.16 Number of active nodes versus total demand; 22 nodes; bridgedall standby option. . . . . . . . . . . . . . . . . . . . . . . . . . .. 62. 4.1 The Lightest Node First Algorithm . . . . . . . . . . . . . . . . .. 70. 4.2 The Least Loaded Node Algorithm . . . . . . . . . . . . . . . .. 72. 4.3 The Lightest Node First Algorithm With Weight Setting . . . . .. 75. 4.4 The Least Loaded Node Algorithm With Weight Setting . . . .. 76. 4.5 Network power consumption, LNF algorithm vs. ILP . . . . . .. 78. 4.6 Active nodes, LNF algorithm . . . . . . . . . . . . . . . . . . . .. 79. 4.7 Grouped results, inactive nodes, LNF algorithm . . . . . . . . .. 79. 4.8 Network power consumption, LLN algorithm vs. ILP . . . . . .. 80. 4.9 Active nodes, LLN algorithm . . . . . . . . . . . . . . . . . . . .. 81.
(17) LIST OF FIGURES. xiii. 4.10 Grouped results, inactive nodes, LLN algorithm . . . . . . . . .. 82. 4.11 Network power consumption, LNFWS algorithm . . . . . . . .. 82. 4.12 Active nodes, LNFWS algorithm . . . . . . . . . . . . . . . . . .. 83. 4.13 Grouped results, inactive nodes, LNFWS algorithm . . . . . . .. 84. 4.14 Network power consumption, LLNWS algorithm . . . . . . . .. 85. 4.15 Active nodes, LLNWS algorithm . . . . . . . . . . . . . . . . . .. 85. 4.16 Grouped results, inactive nodes, LLNWS algorithm . . . . . . .. 86. 5.1 Test topology - eight nodes . . . . . . . . . . . . . . . . . . . . .. 98. 5.2 Reduced topology - links only – (1). . . . . . . . . . . . . . . . .. 99. 5.3 Reduced topology - links only (resilient) – (2). . . . . . . . . . .. 99. 5.4 Reduced topology - nodes and links – (3). . . . . . . . . . . . . 100 5.5 Reduced topology - nodes and links (resilient) - (4). . . . . . . . 100 5.6 Power consumption versus total demand, links-only options. . 102 5.7 Power consumption versus total demand, nodes and links options. . . . . . . . . . . . . . . . . . . . . . . . . . . . . . . . . . 103 5.8 Number of active nodes versus total demand. . . . . . . . . . . 104. 6.1 NMF flow chart of flow and topology tracker. . . . . . . . . . . 114 6.2 DTM flow chart of NMF. . . . . . . . . . . . . . . . . . . . . . . 116.
(18) LIST OF FIGURES. xiv. 6.3 Shortest and longest possible path . . . . . . . . . . . . . . . . 120 6.4 Test topology – original(a), reduced(b) and minimal (c). . . . . 121 6.5 Simulation network toplogy with four core MPLS nodes. . . . . 122 6.6 Load - Link (6,7) and (6,4) . . . . . . . . . . . . . . . . . . . . . 124 6.7 Load - Link (6,7). . . . . . . . . . . . . . . . . . . . . . . . . . . . 124 6.8 Load - Link(5,7). . . . . . . . . . . . . . . . . . . . . . . . . . . . 125 6.9 Load - Link(4,6). . . . . . . . . . . . . . . . . . . . . . . . . . . . 125 6.10 Load - Link(4,5). . . . . . . . . . . . . . . . . . . . . . . . . . . . 125 6.11 Load - Link(4,7). . . . . . . . . . . . . . . . . . . . . . . . . . . . 126 6.12 Link utilisation (8,11) . . . . . . . . . . . . . . . . . . . . . . . . 127 6.13 Link utilisation (10,11) . . . . . . . . . . . . . . . . . . . . . . . 128 6.14 UDP packet loss for the flow between Nodes 1 and 6. . . . . . . 129 6.15 UDP throughput for the flow between Nodes 1 and 6. . . . . . 130 6.16 TCP throughput for the flow between Nodes 1 and 6. . . . . . . 131 6.17 Relative energy increase . . . . . . . . . . . . . . . . . . . . . . 132.
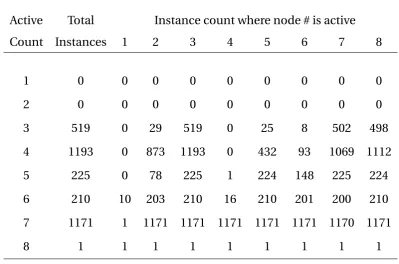
(19) List of Tables. 3.1 Mathematical notation used throughout the thesis . . . . . . .. 33. 3.2 Active Node Count . . . . . . . . . . . . . . . . . . . . . . . . .. 56. 3.3 Power Consumption of the eight Node Network . . . . . . . . .. 60. 4.1 Power Consumption [W] of the eight Node Network . . . . . .. 87.
(20) Publications The following publications were produced during the period of candidature: Aldraho, Abdelnour and Kist, Alexander A. and Maxwell, Andrew, “Performance Investigation of Dynamic Topologies in MPLS Networks”, International Symposium on Communications and Information Technologies (ISCIT)2012, Australia, Gold Cost,2012. Aldraho, Abdelnour and Kist, Alexander A., “Enabling Energy Efficient and Resilient Networks using Dynamic Topologies”, In:The Second IFIP Conference on Sustainable Internet and ICT for Sustainability (IFIP 2012), Italy, Pisa. 2012, pp 34-38,2012. Aldraho, Abdelnour and Kist, Alexander A., “Enabling Dynamic Topologies in Communication Networks”, In: 2011 Australasian Telecommunication Networks and Applications Conference (ATNAC 2011), Australia, Melbourne,2011. Kist, Alexander A. and Aldraho, Abdelnour, “Dynamic topologies for sustainable and energy efficient traffic routing”, Computer Networks, 55 (9). pp. 2271-2288. ISSN 1389-1286,2011. Aldraho, Abdelnour and Kist, Alexander A., “Enhanced heuristics to reduce power consumption of networks using weight setting”, In: 2010 Southern Region Engineering Conference (SREC2010), Toowoomba, Australia,2010..
(21) Publications. xvii. Aldraho, Abdelnour and Kist, Alexander A., “Heuristics for dynamic topologies to reduce power consumption of networks”, In: 2010 Australasian Telecommunication Networks and Applications Conference (ATNAC 2010), 31 Oct - 03 Nov 2010, Auckland, New Zealand,2010..
(22) Chapter 1 Introduction Climate change and global warming are major concerns in the world today and the rate of climate change has been linked to greenhouse gas (GHG) emissions. As GHG concentrations in the atmosphere increase, the planet’s ecosystem is adversely affected [1]. Global temperatures are increasing [2] and potential consequences include rising sea levels and increasing sea temperature, leading to an increase of peak tropical cyclone precipitation rates [3]. The increase in emissions in the last 150 years are largely due to human activities [4] and major sources include transportation, electricity generation, industry, agriculture and commercial and residential activities. Greenhouse gas emissions can be categorised according to the economic activities that lead to their production. The IPCC Climate Change 2007 report [5] identifies the following contributions. Energy production, which includes burning of coal, natural gas, and oil for electricity and heat is the largest contributor to emissions, accounting for 26% of 2004 global greenhouse gas emissions. The industry sector is responsible for 19% of 2004 global greenhouse gas emissions caused by fossil fuels burned on-site at facilities for energy. Land-use, land-use change and forestry account for 17% of 2004 global greenhouse gas.
(23) 2 emissions. This includes emissions from deforestation, land clearing for agriculture, fires and decay of peat soils. Agriculture is responsible for 14% of 2004 of greenhouse gas emissions. Activities include the management of agricultural soils, livestock, rice production, and biomass burning. Transportation is responsible for 13% of 2004 global greenhouse gas emissions involving fossil fuels burned for road, rail, air, and marine transportation. Commercial and residential buildings are responsible for 8% of 2004 global greenhouse gas emissions and the emissions come from on-site energy generation, burning fuels for heat in buildings and cooking in homes. Waste and wastewater are responsible for 3% of 2004 global greenhouse gas emissions including methane from landfills and wastewater. The Information and Communications Technology (ICT) sector contributed about 2% to the total annual global greenhouse gas (GHG) emissions in 2007 [6]. This contribution is expected to increase by 6% each year until 2020 [7]. The ICT sector has been widely advocated as being able to implement energy saving measures assisting other sectors in reducing their energy consumption [8] by applying the new technologies such as email, distance learning and video conference. At the same time, it is an energy consumer itself and therefore contributes to the increases in GHG emissions. Efforts to reduce energy use across the sector spans all ICT activities. Solutions to reduce the impact of ICT on global warming include green data centres [9] (servers, data storage systems and cooling systems), green hardware [10] (hubs, switches and computers), power management [11], and green networks and communications [12] (switches, gateways and links). In traditional data centres, for example, energy cost accounts for approximately 30 per cent of the operating costs of a data centre [13]. In an Internet data centre report, the worldwide energy cost of enterprise data centres has been estimated to exceed 30 billion US dollars per year in 2008 [14]. Therefore, data centre efficiencies are a major focus of energy saving efforts in the ICT industry [15]. Personal computers (PCs) are also considerable power.
(24) 3 consumers as most computers run all the time. Gartner [16] has estimated that the number of installed PCs worldwide exceeded 1 billion in 2008 and is growing at a rate of nearly 12 per cent annually. This means that it may reach 2 billion by early 2014. In 2006, Bray [17] summarised the power requirements of computers. PCs require between 36W and 250W when active, and between 1W and 27W in low power mode. In 2004, the average computer and monitor used 30% of their energy while idle and 40% of their energy outside business hours [18]. As these devices are often not used, it is possible to reduce the energy footprint by encouraging the employees or users to make changes to their using of PCs habits [19]. Most discussions about green ICT refers to hardware, but software is also an important factor [20] as the software requirements tend to determine the hardware design, which in turn has a significant impact on the amount and type of hardware used. All of these factors affect the energy consumption of the systems. In the last decade, Internet and network communication have become prevalent and most computing devices are now networked. As a consequence telecommunication networks have grown rapidly. This also means that telecommunication networks have become major energy consumers. Servers and communication networks consumed about 3% of the world’s electric energy in 2008 and this portion is increasing at a rate of 16-20% per year [21]. Zeadally et al. [22] have estimated that telecommunication networks consumed around 31% of the total energy used in the ICT sector in 2011. Power savings in networks can be achieved by changes to hardware and software, networking protocols, network traffic management and configuration. The majority of studies into ICT power usage have focused on individual devices rather than whole networks [23]. However, Giroire and Moulierac [24] focus on the operation of entire networks, albeit static networks. Some elements of the networks consume large amounts of electricity in order to operate. The possibility of reducing power consumption by switching off routers.
(25) 1.1 Motivation and Scope. 4. and links has been proposed by a number of studies, but they have not covered the dynamic topologies aspect. This research project focuses on potential savings using network management and optimisation techniques. The underlying rationale is based on network utilisation. According to [25] reduction of power consumption can be achieved by switching off network nodes and links while still assuring full connectivity and highest link utilization. ICT infrastructure is generally underutilised as it is dimensioned for peak loads and redundancy. Most servers, for example, normally operate at 20% to 30% of their peak load [26–29]. Backbone networks operate at similar utilisation levels, between 30% [30] and 50% [31, 32]. Adapting the network topology to utilisation levels can potentially lead to a reduction in the number of active network devices. This in turn reduces the total power consumption in the network. This research project consists of five major parts. The first part discusses the nature of dynamic network topologies to find optimal topologies to manage given traffic demands. The second part addresses how networks can deal with changing topologies, with a number of algorithms proposed to apply the network changes. The third part investigates network resilience in the context of reduced topologies. The fourth part proposes potential methodologies to change network topologies and suggests MPLS for that purpose. The final part investigates operational issues such as identifying suitable ways to trigger topology changes.. 1.1. Motivation and Scope. Energy use and energy efficiency have been major issues in the last decades; specifically in relation to the consumption of fossil fuel and subsequent effects on climate change [33]. Governments around the world have begun to take actions to reduce carbon emissions. For example, the Australian government has established programs to reduce carbon emissions and it has.
(26) 1.1 Motivation and Scope. 5. encouraged the business sector to take practical steps to contribute to the reduction of the impact of climate change [34]. The Australian government has also set ambitious targets to reduce Australia’s carbon emissions [35]. The ICT industry was one of the first sectors to make attempts to reduce greenhouse gas emissions [36]. Green networks are a key component that will help the ICT sector to reduce its impact on carbon emissions. Network infrastructure operates fully only for a fraction of the time. This leads to unnecessary power consumption, while the network is not being fully utilised. By focusing on green computer networks, there is an opportunity to reduce the impact of the ICT sector on the environment. This thesis focusses on the latter and will investigate the possibility of reducing power consumption by reducing the number of active nodes and links. A key constraint of this effort is that the level of network service must be maintained and the network devices will not be required to change in term of its hardware which is a significant point that helps to achieve the thesis target without network hardware changes. The main goal of this project was to reduce the power consumption in communication networks without affecting the network performance. A number of steps were taken to achieve this goal. Assuming that the network traffic and topology information is known, the first step was to establish whether reduced topologies offer significant energy savings. To identify power optimal topologies for given traffic loads, mathematical problems were formulated that attempt to reduce the number of active devices. As network nodes often originate and terminate traffic it was necessary to identify standby options for routers and to develop a power model for routers. These assumptions were necessary to estimate power savings. The networking models that are introduced in this thesis are not technology specific and can be applied to any networking technology. As Internet Protocol (IP) networks are the dominant technology at the moment, these are the focus of this thesis..
(27) 1.2 Summary of Original Contributions. 6. In a second step, network resilience was included as another constraint for the network model, as this is an important operational requirement of network operators. These theoretical evaluations demonstrated that considerable energy reductions are feasible in both studied network topologies cases and the next step was to investigate how dynamically changing topologies could be realised relying on existing protocols and technology. The requirement of such a scheme is to maintain the forwarding information for multiple topologies and a solution based on MPLS has been developed.. 1.2. Summary of Original Contributions. This work has used a generic router and link power model in combination with a novel network transformation model to formulate mathematical network models that minimise the power consumption of given networks. The work demonstrates that the concept of dynamic topologies is a feasible option to reduce the energy consumption of networks. A number of heuristics have been proposed to generate the optimal topologies in communication networks. Mathematical models have been developed that take resilience constraints into account and are used to evaluate savings. A potential implementation of the concept of dynamic topologies using MPLS has also been introduced and evaluated. Operational issues that impact on the feasibility of this proposal are also discussed. The work that is discussed in this thesis has resulted in publications [37], [38], [39], [40], [41] and [42]. The main contributions discussed in the individual chapters are summarised below:. • Study of potential low power modes for routers and of a generic network power model that allows the evaluation of the power consumption of networks..
(28) 1.2 Summary of Original Contributions. 7. • Proposal of a node bypass transformation that allows optimisation problems to automatically reduce the number of nodes in networks. • Development of optimisation problem formulations as Mixed Integer Linear Programs (MILP) for a multicommodity flow problem that reduces the number of active nodes and links. • Study of numerical results for two network topologies investigating potential energy savings.. These results were published in [37]. The contributions of Chapter 4 include:. • Development of heuristics to find optimal network configurations that reduce power consumption of networks. • Study of power consumption of reduced topologies in test networks. • Evaluation of Open Shortest Path First (OSPF) weight setting as an enhancement to the heuristics to avoid link overloads. • Implementation of a network emulator to study the performance of the proposed algorithms.. These results were published in [38] and [39]. The contributions of Chapter 5 include:. • Development of two multicommodity flow problem formulations to incorporate network resilience constraints. • Analysis of the performance of the proposed network models to show the feasibility of the approach..
(29) 1.3 Structure of the Thesis. 8. • Evaluation of numerical results comparing network power consumptions of networks with and without the resilience constraints.. These results were published in [40]. The contributions of Chapter 6 can be summarised as follows:. • Proposal of a mechanism to implement dynamic topologies in MPLS networks with minimal changes to current forwarding mechanisms. • Analysis of the impact of topology changes on the performance of individual UDP and TCP flows. • Design of a network management function, a flow tracker at each ingress router and a router function that is able to change router power states. • Investigation of the impact on the real time traffic and non-real time traffic in dynamic topologies and discussion of the implications for energy saving. • Discussion of the practical considerations to identify the suitable methods to upsize or downsize the topology.. Results discussed in this chapter led to two publications [41, 42].. 1.3. Structure of the Thesis. The remainder of this thesis is organised as follows: Chapter 2 provides the context to greenhouse gas (GHG) emissions and the contribution of Information and Communication Technology (ICT) to those emissions. A general overview of GHG emissions is presented and their impact on the environment is discussed. The link between ICT GHG emissions and global GHG.
(30) 1.3 Structure of the Thesis. 9. emissions is established and their impact and contribution on global warming outlined. Specifically communication networks are investigated in more details. Teletraffic engineering, network management are also discussed as these are relevant to the solutions that are presented in the thesis. Finally, dynamic topologies as an optimisation problem are put into context. Chapter 3 establishes whether the concept of dynamic topologies is feasible and whether energy savings are possible. The results provide an indication of what potential savings are likely. This chapter discusses mathematical models that are formulated as multicommodity flow problems. A network transformation is proposed and mathematical programming models for optimal topologies are introduced to reduce the energy consumption for a given network topology. Link flow formulation and node bypass transformation are presented to find optimal solutions. Integer Linear Programming (ILP) is used to solve the optimisation problems. Using a generic router power model, potential energy savings are evaluated for two topologies. Numerical results demonstrate the feasibility of the proposal. In Chapter 4 the ability to apply the network changes is investigated. The mathematical models that have been introduced in Chapter 3 have shown that the optimal topologies exist; however solving the mathematical programs is complex. This chapter proposes a number of heuristics: The Lightest Node First and the Least Loaded Node algorithms. Both algorithms use the link utilisation to decide whether an active device can be switched off or not. The Least Loaded Node algorithm calculates the load of the nodes while the Lightest Node First algorithm computes the capacity of the nodes to identify devices that can potentially be turned off. The Shortest Path Weight Setting is employed with those algorithms to prevent link overloads. As part of the algorithms, optimal weight sets are calculated that balance the traffic load in the reduced networks. Numerical results illustrate energy savings that are possible by reconfiguring the network..
(31) 1.3 Structure of the Thesis. 10. Network resilience is a major concern for commercial communication network operators. In Chapter 5, a network resilience model is proposed based on the models discussed in Chapter 3. The aim is to protect networks from link failures and two alternative problem formulations are presented, one that protects links and one that protects demands. Numerical results are presented that highlight energy savings in networks with resilience constraints. Potential implementations of dynamic topologies and related network protocol performance are discussed in Chapter 6. To realise dynamic topologies, networks have to maintain multiple topologies at the same time. An approach using MPLS and flow tracking is discussed in this chapter. Assuming such a mechanism, network performance at the flow level is investigated. Using Network Simulator 2 (NS2) the effects on User Datagram Protocol (UDP) and Transmission Control Protocol (TCP) flows is investigated. The network performance is investigated by evaluating performance factors such as packet loss and throughput. Chapter 7 discusses the findings of this thesis and outlines potential future work and open issues..
(32) Chapter 2 Background Worldwide Internet traffic transported by communication networks is rapidly increasing to be doubling each year since 1997 [43]. Communication networks consume a considerable amount of energy which has increased from 219 TWh per year in 2007 to 354 TWh per year in 2012 [44]. This growth is contributing to negative environment effects and climate change. Network optimisation and reduction of active network devices is one way to help reduce the impact of communication network traffic growth. This chapter discusses the motivation for the work in this thesis and provides the background in regards to the various efforts to reduce the power consumption of telecommunication networks. It briefly discusses greenhouse gas emissions and global warming, the role of the ICT sector in general; and more specifically, communication networks and energy efficiency. As this work largely focuses on traffic management and network optimisation, those topic are also discussed..
(33) 2.1 Greenhouse Gas Emissions and Global Warming. 2.1. 12. Greenhouse Gas Emissions and Global Warming. Greenhouse gases (GHG) emissions are the release of gases from either manmade or natural sources which trap heat in the atmosphere and create a greenhouse effect. They are generally recognised to be the cause of global warming [45, 46]. Emissions of GHG interfere with the balance of sunlight energy entering and leaving the atmosphere, causing it to retain heat, thus raising the temperature of the earth surface. GHGs have been identified as key contributors toward global warming [47]. Coal-fired and natural gas power plants are amongst the principal sources of GHG emissions from human activities, with deforestation and engine combustion also making significant contributions [48]. Many industries contribute to GHG emissions such as energy producers and the transport sector. Also, the ICT sector is one of these contributors. Global warming has been identified by the World Health Organization [49] as one of the most important challenges facing human life on Earth. As global warming increases, so do the incidences influencing the environment in negative ways. Increasing global temperatures, for instance, are likely causes of extreme weather situations, together with considerable and increasing changes in rainfall volumes [50] and rises in sea levels. As a result of global warming further rises in global temperature up to 1.4 ◦ C, can be expected in the twenty-first century [51]. The problems associated with the consequences of global warming are raising considerable concern among nations, individuals and researchers [52] [53]. Also, as stated by Koch et al [54], the major contributor to increases in GHG emissions is the power production and therefore has a negative impact on the environment. Industry sectors such as food processing, use electricity.
(34) 2.2 The ICT Sector and Energy Efficiency. 13. to run manufacturing plants. Electricity producers are responsible for large amounts of GHG emissions [55, 56]. The electricity sector is responsible for more than 35% of total energy related carbon dioxide emissions worldwide, the largest contributor of GHG emissions in 2004 [57]. The industrial sector was the second largest, representing 28% of total emissions for the same year, followed by transport, which represented 20%, and direct fossil fuel use in the residential sector contributing 8%. Other sectors, account for 14% of total emissions.. 2.2. The ICT Sector and Energy Efficiency. This section will discuss the role of the ICT sector in the context of greenhouse gas emissions and energy efficiency. ICT is a contributor to energy consumption. In the last two decades the ICT sector has grown rapidly and the GHG emissions in the sector are largely caused by the power conumption of equipment. Sutherland [58] states that the ICT sector accounts for 2% of global carbon dioxide emissions in 2007. Worldwide, the ICT sector was responsible for about 23 Mt of carbon dioxide emissions in 2009 [59]. This includes networking, data centres and hardware. The ICT sector is undertaking efforts to reduce its energy and carbon footprint by focusing on technical solutions as well as business processes, often referred to as Green IT. The sector is also advocated as an enabler for reducing power use in other industry sectors. The number of users around the world using the Internet has been increasing rapidly [60, 61], as has the development and proliferation of new (portable) devices. The rapid uptake of computers, the Internet and mobile phones has the capacity to double the volume of emitted carbon dioxide worldwide by the year 2020 [62]. Webb [63] highlighted in 2007 that if current treads persist, it is expected that the contribution will grow by 6% each year until 2020..
(35) 2.2 The ICT Sector and Energy Efficiency. 14. Energy use in the global ICT industry is the largest and most significant contributor to its carbon footprint, both within the information as well as the communication technology domains. In the ICT sector power is essential to enable both task operations and accomplishment [64]. Electricity is needed to run services, applications and equipment; and for related activities, such as manufacturing and distribution [65]. As presented in the European Commission in [66], the total electricity usage of the ICT sector in the European Union was estimated to be 119 TWh in 2005, which corresponds to 4.3% of overall electricity consumption, or 0.6% of total energy consumption. Also, for the U.S., it is estimated that ICT’s share of electricity consumption was approximately 8% in 2008 [67]. The amount of energy consumed by the ICT sector is also increasing rapidly. Bilal et al. [68], for example, have observed that the energy consumption estimates for IT infrastructure for the year 2011 are double than those of 2006 because of the increase in the traffic and subsequent increase in the network hardware. The contributors to the ICT energy footprint is considerable. Plepys [69] has estimated that Internet equipment consumed approximately 8% of the total power in the United States in 2002 with the prediction to 50% growth within a decade. As predicted in [70], the energy consumption growth of telecom networks in the coming years is increasing. Data centres are a major energy consumer of the sector [71] and their energy consumption is a major contributor to the rising GHG emissions. Berral et al. [72] identifies data centres as the principal parts of the problem. The power consumption of data centres is increasing rapidly [73]. In 2003, a typical data centre consumed about 40W per square foot energy, and in 2005 this figure has raised to 120W per square foot energy [74] because of the increase in traffic demand on the communication networks. Global network traffic has increased eightfold between 2006 and 2011 [75]. The third major category of contributors are hardware and devices within the ICT sector. A desktop computer requires 65-250W of electric power when in.
(36) 2.2 The ICT Sector and Energy Efficiency. 15. use, and a colour monitor, another 40-150W; laser printers can need as much as 400W or more when printing, although considerably less if in standby mode; ink-jet printers use 12-30W while printing, but less than 5W while sitting idle [76]. Gartner [77] has estimated that desktop computers and monitors consumed 39% of all power used in ICT sector in 2002. Pritchard [78] has estimated that the total power consumed by servers represented 0.6% of total US energy consumption in 2005 and that the power use of servers doubled between 2000 and 2005. Reducing the power consumption in the ICT sector could significantly reduce GHG emissions [79]. While the ICT sector has improved the power efficiency in other business sectors, there is a necessity to reduce the power consumption in the ICT sector itself. Therefore, many studies have identified the power consumption in the ICT sector from different angles such as power consumption in data centres, PCs and servers and networking and communications [80], [81]. Efforts in the ICT sector include both technical solutions as well as improved business processes. Use of state of the art technology in servers and data centres could reduce their consumption of electricity by 70 per cent [82]. For example, the use of DC power in data centres could reduce their energy consumption [83]. Cloud computing is also seen as a technology that can help to reduce the power consumption in the ICT sector [84]. Cloud computing is therefore one of the attempts that has been established by green computing that allow sharing of resources and shut down some of power-hungry data centres. Efforts to reduce the energy consumption of computer networks include routing algorithms with sleep-cycle protocols for use in the network nodes [85]. The reduction of power consumption in networks investigated in [86] introduces new methods to control the power port and switching power in network devices by using multi layers in dynamic optimized routing. Also, the.
(37) 2.2 The ICT Sector and Energy Efficiency. 16. power consumption in computer parts was discussed in [87] and [88], introducing new methods to save energy in the hard disks by controlling the hard disk caching and memory and applying new technologies such as solid state drive technology (SSD). Green computing is not a new practice in the industry [89]. The roots of energy efficiency computing can be traced back to 1992, when the US Environmental Protection Agency initiated an Energy Star program to promote energy efficient computing products [90]. Although green technology in the ICT sector covers a vast domain, it is limited to practices such as thermal management constraints [91] that help ICT companies reduce their contribution to greenhouse gas emission. Research and innovation is developing new technologies to reduce the power consumption of ICT technology; however, this technology also has to be used. Green IT or green computing are umbrella terms referring to environmentally sound information technologies and systems, applications and practices [92]. The term often implies a focus on business rather than exclusively technical solutions and includes a focus on encouraging the use of energy efficient approaches such as virtualisation, informed purchasing, power management, lifetime analysis and recycling. The ICT sector can also play an important role in helping other industries to reduce their energy footprint. ICT technologies can help to reduce GHG emissions of other economic sectors, even if the expected increase in the energy consumed by ICT equipment is counted [93, 94]. Kretschmer [95] and Plepys [69] agree that the information and communication technology revolution can be helpful for both the economy and the climate. Laitner [96] and Coroama and Hilty [97] have stated that information technologies can significantly reduce the use of energy, even though the ICT sector was responsible for about 2% of global GHG emissions in 2007 as found in [98]. The use of ICT technologies across other business sectors would lead to a reduction in.
(38) 2.3 Communication Networks and Energy Use. 17. the power consumption of those sectors. The potential of the ICT sector to help decrease environmental impacts from other sectors is discussed in [99] and Stallo et al. [100] estimate that ICT could potentially reduce global greenhouse gas emissions by 15% by 2020. ICT use in the education sector is an example of energy conservation. The use of video and audio Internet services could reduce energy consumption by changing the traditional methods of communication. For example replacing transportation services to meet people with the use of video and audio Internet services. Irwin in [101] said that many companies encouraged their employees to use video and web conferencing to reduce air pollution effects. The ICT sector has improved their services to support other sectors that use services such as broadband Internet. This service can be used by the E-commerce sector and TV sector to deliver their services. As stated in [102] the bandwidth increase offered by broadband enables TV via the Internet. Fuhr et al. declared in [103] that E-commerce is based on the Internet spread and it is not affecting the environment. In distance learning offered by the education sector, the Internet service has the potential to decrease the transportation use and the GHG emissions that go with it as people take advantage of these new found educational opportunities [104].. 2.3. Communication Networks and Energy Use. Communication networks have become more significant in the ICT sector to support and facilitate network tasks such as data transfer and sharing [105]. Therefore the power consumed by the communication network has increased rapidly [106]. Many studies have addressed the problem of the power consumption increase in communication networks including [107] and [108]. The European Union advised the ICT industry sector to improve the energy efficiency of communications networks and of ICT in general [109]. Over.
(39) 2.3 Communication Networks and Energy Use. 18. time, communication networks have become the significant consumer of power in the ICT sector. Communications networks contributed about 12% of carbon dioxide in 2002, but it is expected that this will increase by a factor of about 3 by 2020 [110]. Vereecken et al. [111] have examined the consumption of different ICT equipment in 2008 and found that network equipment was consuming about 12% of total ICT energy consumption, PCs were consuming about 5% and data centers were consuming about 12% of the total ICT power consumption globally. There are many different ways to study the power consumption in network communications. Chabarek et al. [112] have presented a number of simple methods to estimate the energy consumption of network devices. Every network component has been evaluated to calculate a power footprint for a network topology. Two scenarios were compared: one with all devices turned on, and another where only network elements that guarantee the service remained powered on. Some studies, such as [113], have analysed the power consumption of server systems and routers in the US and provid information about the power consumption of office and telecommunication equipment for the year 2000. The results from that study could be helpful to understand the power consumption behavior in ICT equipment. Therefore, the study of power consumption in communication networks as discussed in this section has focused on three aspects in network communications, these being network hardware, network protocols and resource management [114]. The network communication devices are one of the largest power consumers in the IP network infrastructure. Therefore, some studies, such as [115] and [116] have targeted changing the network devices and using a dynamic link shutdown method to help reduce the power consumption of that device. Because the memory subsystem is a significant contributor to chip power consumption, Issenin and Dutt [117] implemented the synthesis of memory method in the data centre device and other supported methods which can lead to.
(40) 2.3 Communication Networks and Energy Use. 19. save the power in network on chip. One of the earliest studies of those dedicated to measureing the energy consumed by the new technology devices was the measurment of computer energy use by [118] and this study was followed by the study of the estimated total power use of office equipment by [119], [120], [121], and evaluation of the efficiency of improvements in that network equipment by [122] and [123]. Putting network elements into sleep modes is one of the key solutions to reducing power consumption of ICT equipment. This technique is also feasible to conserve power in networks as Gupta et al. [124], [125] showed as various components on Local Area Network (LAN) switches were to put sleep during periods of low traffic activity. Considerable effort is being made by large manufacturers such as Intel and Texas Instruments to make electronic devices more efficient [126]. To be able to put network interfaces and devices to sleep, changes to network protocols are required. Gupta and Singh [127] investigated LAN switches and routers and identified a number of concerns. This includes the time it takes to put components into sleep mode, methods to make decisions about whether devices should be put into sleep mode, and which devices in the network should be turned off. Many studies have examined power savings in the wireless domain for battery operated devices which are often more costly to run. For wireless LANs using the 802.11 protocols, for example, 90% of the communications energy is spent during the radio listening and scanning operations [128]. Improving energy efficiency of base stations in cellular networks is discussed in [129]; while [130] discusses the use of routing control as a means to reduce energy consumption while remaining aware of Quality of Service (QoS) considerations. The authors propose a method using queuing theory and optimisation techniques to distribute traffic so as to reduce the cost function that comprises both energy and QoS..
(41) 2.3 Communication Networks and Energy Use. 20. Other ways to reduce the power consumption have been suggested. In studies [30] and [131] into the sleeping stage and the rate adaptation in the communication networks, the designs of two different power management schemes to reduce power consumption in the network were examined. A more recent study suggests the introduction of a new algorithm called GRiDA based on the link utilisation will reduce power consumption [132]. The algorithm switches off selected nodes and links in cases of particular link utilizations. Another scheme is adapting the rate of network operation to current workload. Other proposals to conserve energy within networks that include using a dynamic link metric method and powering off links have been addressed [133, 134]. Gupta and Singh [135] suggest that there have been very few attempts at saving energy on network interfaces by using low power modes of Ethernet transceivers during periods of inactivity or low utilisation. Bianzino et al. [136] aimed to find routers and links that must be powered on so that total power consumption is minimised which can be achieved by using knowledge of a physical network topology including routers and links, the capacity of each link, the demand traffic, and the energy expenditure of each link and node. Also, the subject of that study is to flow conservation and maximum link utilisation constraints. In order to find the routers and links that must be turned on to minimize the total energy expenditure objective, the researchers used Integer Linear Programming (ILP) to specify the problem. Gelenbe and Morfopoulou [137] have investigated optimised routing as a power saving mechanism in packet networks to identify the ability to reduce the power consumption in packet networks. Two schemes have been examined; shortest path routing and energy aware routing algorithm These are used to identify their capacity for reducing energy consumption through the proposed algorithm. Energy efficient management to reduce the power consumption in a network is also discussed in the literature, identifying methods for power manage-.
(42) 2.3 Communication Networks and Energy Use. 21. ment, as well as targeting specific applications and techniques in the communication networks. For example, Chiaraviglio et al. [138] advocate an approach for power aware network management. The proposed method is applied to access networks and involves dynamic network planning based on the volume of traffic so as to reduce the number of active network devices. Recently, Ewa et al. [139] has proposed a framework for backbone network management. Where that study is discussing the minimisation of the energy consumption by considering the backbone network management to minimise energy consumption. Energy requirements for data centre equipment have increased because of the increasing quantity of the equipment and the quality of the devices themselves. Research is investigating ways to manage and reduce power requirements. [140] and [141] discuss the power saving in servers and server clusters in data centres. These studies look at how the management of power consumption in related devices is addressed and the resulting enhancement of energy consumption by data centre devices and computers. Kist [142] proposes a mechanism allowing load distribution for large scale server clusters with a load proportional GHG emissions footprint. An energy management mechanism has been proposed by [143] within the IEEE 802.3ah control scheme to switch optical network units to sleep mode and determine a suitable wakeup time schedule at the optical line terminal. A reduction in power consumption can be achieved by managing traffic over the entire network. Once the Internet is connected to the computers, power consumption will increase. In this context, the application of power management can help to reduce power. One method allowing desktop computers to enter low power modes and retain network connectivity has been presented in [144]. The study shows that there is significant inactive time able to be used for power management..
(43) 2.4 Traffic Management and Network Optimisation. 2.4. 22. Traffic Management and Network Optimisation. Traffic management can be broadly described as an attempt to optimise performance in operational networks based on specific performance objectives. Traditionally, these objectives have related to cost, device utilisation and QoS. In technological terms this thesis focuses on the traffic management of IP networks to reduce their energy footprint. The energy consumption of networks is directly linked to the number of active devices that are running regardless of if it is forwarding traffic or not. To be able to turn devices off it is necessary to optimise the way traffic is routed in networks. Constraints in this case are QoS and energy use. Routing is a complex process that involves network topology discovery, route calculations and packet forwarding. Each step has its own challenges. Topology discovery and route computation are done in the router’s control plane with the aid of routing protocols, while packet forwarding is performed in a router’s forwarding plane. In IP networks, routers in the same logical domain have to use the same routing protocols to enable communication of devices and a network-wide view of the topology. Once routers gather the necessary information through the routing protocol, they can compute next hop information for IP prefixes. Native IP routing protocols are based on next-hop destination-based routing [145]. When forwarding a packet, a router determines the outgoing interface based on the destination address of the packet and forwards the packet to the respective next router. The next router transmits the packet in the same manner and forwards the packet along the shortest path until it reaches its destination. Routing protocols in IP networks are classified according to the scope of the routing performed. Routing protocols that operate inside an autonomous system, in which routers are under the same administration, are called intra-.
(44) 2.4 Traffic Management and Network Optimisation. 23. domain (interior) routing protocols, also referred to collectively as the Interior Gateway Protocol (IGP). Exterior gateway protocols provide routing between separate autonomous systems [146]. The Open Shortest Path First (OSPF) packet routing protocol [147] is one of the most commonly used interior gateway protocols in IP networks. OSPF uses shortest paths for routing packets, applying the equal-cost multipath (ECMP) principle to cope with multiple shortest paths. Traffic engineering is using the traffic flow of data entering and leaving the network to optimize network performance. The output of traffic engineering is an optimal set of paths which optimise link loads. The resulting set of paths can be used within the network to optimally control the flow and distribution of traffic across the network. Network congestion is one of the main issues resulting in reduced performance in IP networks. Congestion occurs when network resources are insufficient to accommodate offered load or when there is inefficient mapping of traffic streams to available network resources. However, setting up individual paths and optimally assigning traffic to them is not supported in traditional IGPs such as OSPF [148] and Intermediate SystemIntermediate System (IS-IS) [149]. These protocols use shortest path routing with destination based forwarding which makes it difficult to achieve optimal link loads [150]. A forwarding mechanism that allows for a finer granularity, such as Multi Protocol Label Switching (MPLS) [151] is required. Weight setting is another way to implement basic traffic engineering and load balancing with shortest path routing protocols.The idea was initially proposed by Fortz and Thorup [152]. In this study, a local search heuristic was proposed for optimizing OSPF weights assuming knowledge about the traffic matrix. However, the heuristics generating the weight set is computationally expensive. The cost function evaluation time can be improved as much as 85% using dynamic cost evaluation, when the previous solution and the current solution are only slightly different. It is desirable to do this because, if.
(45) 2.4 Traffic Management and Network Optimisation. 24. there is only one or just a few weight changes in the network, most of the routing patterns will not change (i.e. most of the flows are routed as before) with few exceptions; and the dynamic cost evaluation will update these flows only. In [153], Fortz and Thorup formalised the weight setting problem in OSPF/IS-IS networks and highlighted that the problem may be difficult to solve even for moderate sized networks. Other authors have built on their work, for example [154] investigated weight settings under a variety of different network objectives and [155] optimised link delays. MPLS is significant for traffic engineering as it can direct traffic flows along predefined paths. It provides most of the functionality available from the overlay model that provide the client by emulated leased lines from the service provider which typically uses the virtual circuits of a Frame Relay or ATM service, in an integrated manner, and at a lower cost than the currently competing alternatives such as Frame Relay and ATM for traffic engineering. MPLS also offers the possibility of automating aspects of traffic engineering. MPLS is a switching technology, which replaces traditional IP packet forwarding with label switching. IP packets are encapsulated in MPLS packets [156] and forwarding decisions within the MPLS domain are based on packet labels. This means packets follow predefined label-switched paths. This results on a much greater routing flexibility. In brief discussion, instead of routing the packets by forwarding packets router by router, paths are established for source-destination pairs. These paths are called label-switched paths (LSPs) and the routers that make up a label-switched network are called label-switching routers (LSRs). MPLS routers encapsulate the packets which are forwarded in a label-switching framework, with special headers called labels. The label contains information that can be used by the router to know the LSP that the packet belongs to. The router will use the ingress port and the LSP information to determine the next hop in the LSP. The network management function uses a set of configuration, performance, accounting and.
(46) 2.5 Dynamic Topologies. 25. fault management functions. This component also collects traffic statistics that can be used for statistical analysis and capacity planning purposes.. 2.5. Dynamic Topologies. The term dynamic topology has been used by the networking community in the past, in particular in the context of circuit switched networks. Dynamic network topology changes have been discussed to give an overview of the potential for power reduction in the networks. The aim in this type of study is to enable recovery from both predictable and unpredictable interruptions and achieve load balancing. Noakes et al. [157] have proposed an adaptive link assignment algorithm for distributed optimization of dynamically changing network topologies and a related routing algorithm [158]. Moose [159] investigates dynamic hierarchical networks that employ adaptive behaviour for variable demands. White et al. [160] introduces an analytical approach that addresses activation and deactivation of links in response to changed traffic conditions. In broad terms, these studies address the problem of a dynamically changing network configuration; however, these address different technology aspects and optimisation problems. These are not directly applicable to energy efficient network configuration. Router placement has been discussed as an option in the context of traffic engineering [161, e.g.], and in the context of wireless networks [162, e.g.]. While these publications do not directly relate to the dynamic topology problem, they discuss techniques that can be combined with the mechanism outlined in this project to offer greater savings. A few studies do directly relate to dynamic topologies in the context of IP networks. A number of authors have identified power consumption as a main issue in high performance router design [163]. Solutions include the use of optics in routers [164] and energy efficient switching fabric design [165]..
(47) 2.5 Dynamic Topologies. 26. Power awareness in network devices has been investigated in [166] to minimise power consumption in network equipment. The authors of this work undertook benchmarking of two routers to estimate power use. Based on these measurements they developed a general model for router energy consumption and formulated the network design problem as a power aware mixed integer program. Optimisation focuses on allocation of line cards per chassis and chassis over the target network. The optimisation problems are different from the scenarios discussed in this thesis, as routers do not inject or consume traffic. This research uses the reported measurement results to formulate the device power model in Chapter 3. Furthermore, the work in this thesis differs as it does not target a design problem and does not focus on the same level of detail in device configuration, but a generic solution that uses a set of predefined router energy states. Chiaraviglio et al. [167] introduces a network design problem with the aim to reduce the total power consumed by the network. It outlines the optimisation problem as a linear program and proposes heuristics to solve the problem. The main difference of this approach and the optimisation problems discussed in this thesis are that nodes are unable to consume or inject traffic. In the discussed scenario, only nodes and links that are redundant can be turned off. The problem formulation is similar to classic network design problems with an energy consumption objective. Chiaraviglio et al. [168] use the results of [167] and evaluate an operational topology with realistic power usage figures for devices and propose a new algorithm that accounts for power consumption of devices. Furthermore, the study focuses on a specific star network topology with three different aggregation levels, whereas this work looks at a generic network topology. In [169] the authors focus on a much larger scale and use analytical and simulation results to estimate redundant network resources worldwide that could be.
(48) 2.6 Conclusion. 27. turned off to save power. A number of studies target specific applications or techniques. Vasic and Kostic [170] present an “online energy-aware traffic management technique” that assumes equipment is able to adapt its power use to utilisation using rate adaptation and sleep states. This approach provides a solution for energy efficient traffic management; it does not address the dynamic topology problem. Wu et al. [171] discuss the routing and wavelength assignment problems with the new objective of reducing network energy consumption. The authors introduce ILP formulation and a number of heuristics to solve the problem. Node and link power down for unused connections in IP over Wavelength Division Multiplexing (WDM) networks is also discussed in [172].. 2.6. Conclusion. There is a strong link between GHG emissions and global warming. GHG emissions have been increasing rapidly and are mainly caused by energy consumption. ICT is contributing to these emissions and governments and other organisations around the world have urged the sector to address energy efficiencies and reduce emissions. The main cause of GHG emissions in the ICT sector is the consumption of energy. Activities in the research community have focused on methods to reduce the power consumption in ICT devices such as computers, printers, network devices and data centres. This thesis focuses on the energy footprint of communication networks, specifically IP networks. It proposes traffic engineering techniques and introduces dynamic network topologies in an effort to reduce the number of active network devices. This chapter has provided a broad overview of the field. Details of related research that pertain to specific work discussed in the remaining chapters are introduced in those chapters..
(49) 2.6 Conclusion. 28.
(50) Chapter 3 Dynamic Topologies as a Multi-Commodity Flow Problem One approach to increase energy efficiency in communication networks is to adapt the network topology to the network load. This chapter introduces the concept of dynamic network configuration at a topology level. The aim is to establish whether dynamic topologies can lead to energy savings for lightly loaded networks. To address different energy consumption behaviours of router hardware, a generic power model is introduced to serve as the basis for the investigations. Using novel network transformations, a multi-commodity flow problem is formulated that reduces the number of active nodes and links. Key differences to the other approaches are that in this model the nodes potentially emanate and terminate traffic. Four different low power models for routers are investigated and simulation results demonstrate that considerable energy savings are possible using this approach..
(51) 3.1 Introduction. 3.1. 30. Introduction. Chapter 2 has established the relevance of energy efficiency and global warming. The impact of computer networking on global GHG emissions has also been discussed and potential approaches to reduce energy consumption in communication networks have been introduced. In particular, efforts in regard to hardware, protocols, software, and network management have been introduced. This work focuses on the latter and this chapter introduces mathematical models that allow quantification of possible energy saving by adapting the network topology to traffic demands. The infrastructure of a communication network has to grow with the increase in user demand. This section will briefly introduce the concept of dynamic topologies and multicommodity flow problems. This research proposes that the network actively change its topology to current traffic conditions. In dynamic topologies, links and routers can be switched into low power mode in response to traffic loads. There are two aspects of interest to this approach: potential savings from dynamically changing network topologies and the dynamics of routing protocols. The former is addressed in this chapter. The modelling in this chapter focuses on network flows, rather than packets. The network flow assumptions are that classis network algorithms such as shortest path, minimum cost flow, and multi-commodity flow problems are applicable [173]. In this chapter, multi-commodity flow problems with regard to dynamic topologies will be studied. The aim of this work is to identify the potential to minimise the number of active elements in network communication, and therefore is to evaluate potential power savings from using dynamic topologies..
(52) 3.1 Introduction. 3.1.1. 31. Motivation and Related Works. In addition to the background discussions in Chapter 2, this section briefly discusses related work that is specifically relevant to this chapter. The work in this chapter was undertaken concurrently or ahead of many other studies of energy efficiency in communications networks. The motivation for the problem formulations discussed in this chapter is to identify efficiency gains that are possible by changing network topologies. Multi-commodity flow problem formulations have been proposed in the context of energy consumption [174, 175]. However, these studies have assumed that nodes are unable to consume or inject traffic. This means that only redundant links or nodes can be switch off. Marsan et al. [176] apply similar optimisation techniques to switching of devices to specific networks to achieve energy efficiency while [177] proposes to switch off links by using the QoS in the given network. Energy efficiency in wireless access networks is discussed in [178] and the power consumption of ad-hoc networks is investigated by [179]. Ledbetter and Smith [180] evaluate efficiency gains in equipment to provide more information and purchasing strategies for clients about how to select and use energy efficient equipment. The modelling in this chapter uses Mixed Integer Programming (MIP) to solve the multi-commodity flow problems. MIP is a mathematical method that is widely used to solve optimisation problems [181]. ILP derived solutions can be tailored to either maximise or minimise packet delivery costs. In relation to sustainable network routing, ILP have been used to find solutions to the problem of minimising the power consumption in IP networks [182] and to investigate the possibility of switching off interfaces connected to unused links [182]. The research discussed in this chapter focuses on traffic engineering of generic network topologies to identify nodes and links that can be turned off in order to reduce power consumption in operational networks..
(53) 3.2 Notation. 3.2. 32. Notation. This section introduces the mathematical notation that will be used throughout this thesis. A network G(N, M ) consist of N nodes and M directed arcs. The flow of commodity k on arc (i, j) is denoted as xkij and the unit cost of k . This commodity k using arc (i, j) as ckij . Arc (i, j) also has a fixed cost gi,j. cost is encountered if link (i, j) is active and it is independent of the traffic xkij . The capacity of arc (i, j) is denoted by uij . Similarly, nodes have unit and fixed costs cki , gik and capacities ui where, in practical telecommunication networks, costs are the same for all k. For this application, different commodities correspond to alternate traffic flows, between other origin destination pairs and the cost is the same for all pairs. hki denotes the nodes standby cost. The constant bk (i) denotes supplies or demands at node i, b+ (i) is the sum of all supplies at node i and b− (i) is the sum of all demands at node i. The variables δij and δi are Boolean values that indicate if arc (i, j) and node i are in use, respectively. Integer constants γi and βi indicate the maximum out-degree and in-degree of nodes, respectively. Table 3.1 shows a summary of main variables and constants that are used throughout this thesis for the various mathematical models.. 3.3. Assumptions and Node Standby Power Model. Power models are essential to estimate the amount of energy a network consumes. In communication networks, the main elements are links and routers. The architecture of routers is complex and the design varies according to size and the purpose of routers. For instance, core routers are different to those that are operating in the network edge [168]. Therefore, it is difficult to propose a universal power model that applies to all routers..
Figure

+7


Related documents
Results from the study show eight main potential research issues can be explored by researchers, including normalisation, criteria weighting, ranking abnormality, network
The ATV is equipped with an alarm system. Refer to the follows for functions of key on the remote. There is a control box underneath the seat. The control electronics may
BS PMDE Middle
Lofton Energy Services Brand of Lofton Staffing Services Lofton Security Service Brand of Lofton Staffing Services Lofton Staffing Services Magellan Group Medix
Sin embargo, el proyecto "Animación, conciencia, mediación" da la vuelta a esta perspectiva: por un lado muestra cómo la animación puede ser realizada y protagonizada por
Mechanical loading from forces generated by body weight stimulates bone formation
E, Axial enhanced fat-saturated T1-weighted image demonstrates improved enhancement of the left central skull base and the adjacent soft tissues but interval worsening of enhancement
In particular, I would like to express my gratitude to Professor Heinz Heinen of the University of Trier, who not only put me in touch with many of his colleagues, but also met
