Department for Education
Children in care
Report by the Comptroller and Auditor General
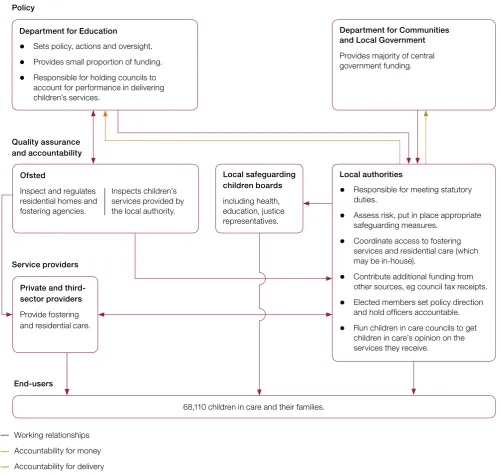
Ordered by the House of Commons to be printed on 26 November 2014
This report has been prepared under Section 6 of the National Audit Act 1983 for presentation to the House of Commons in accordance with Section 9 of the Act
Sir Amyas Morse KCB
Comptroller and Auditor General National Audit Office
25 November 2014
HC 787 | £10.00
© National Audit Office 2014
The material featured in this document is subject to National Audit Office (NAO) copyright. The material may be copied or reproduced for non-commercial purposes only, namely reproduction for research, private study or for limited internal circulation within an organisation for the purpose of review.
Copying for non-commercial purposes is subject to the material being accompanied by a sufficient acknowledgement, reproduced accurately, and not being used in a misleading context. To reproduce NAO copyright material for any other use, you must contact [email protected]. Please tell us who you are, the organisation you represent (if any) and how and why you wish to use our material. Please include your full contact details: name, address, telephone number and email.
Please note that the material featured in this document may not be reproduced for commercial gain without the NAO’s express and direct permission and that the NAO reserves its right to pursue copyright infringement proceedings against individuals or companies who reproduce material for commercial gain without our permission.
The National Audit Office study team consisted of:
Maria-Christina Eskioglou, Oren Geva, Linda Mills, Robindra Neogi,
Sarah Perryman and Thea Tanner, under the direction of Ashley McDougall. This report can be found on the National Audit Office website at www.nao.org.uk
For further information about the National Audit Office please contact: National Audit Office
Press Office
157–197 Buckingham Palace Road Victoria
London SW1W 9SP
Tel: 020 7798 7400
Enquiries: www.nao.org.uk/contact-us
Website: www.nao.org.uk Twitter: @NAOorguk
Part Two
Progress in improving care 26
Part Three
Understanding the costs of care 43
Appendix One
Our audit approach 49
Appendix Two
Our evidence base 51
Appendix Three
Updated figures 54
Appendix Four
Key facts
68,110
children in care on 31 March 2013
£2.5bn
spent supporting children in foster and residential care in 2012-13
62%
were in care because of abuse or neglect on 31 March 2013
75% of children in care are fostered
£1.5 billion cost of fostering services in 2012-13
£1 billion cost of residential care in 2012-13
£29,000– £33,000
average annual spend on a foster place for a child
£131,000– £135,000
average annual spend on a residential place for a child
14% the proportion of children in foster care placed more than 20 miles
from home in 2012-13, the same as in 2009-10, 2010-11 and 2011-12
34% the proportion of children in care with more than 1 placement in the
year 2012-13, the same as every year since 2009
43 percentage point gap between children in care and their peers,
in the attainment of 5 GCSEs grade A*-C including English and mathematics
5% of residential homes were rated as inadequate by Ofsted in 2012-13
Summary
1 Local authorities in England looked after 68,110 children on 31 March 2013.1
Most of these children, 75%, were fostered. In 2012-13, authorities spent £1.5 billion on fostering services and £1 billion on residential care. A child is ‘looked after’ by a council when a care order, granted by a court, gives the council parental responsibility for the child. Alternatively, the council may provide accommodation for the child under a voluntary arrangement with the child’s parents, or if a child is remanded or convicted by the courts.2 Nearly two-thirds (62%) of children were in care because they had
suffered abuse or neglect.
2 Children’s early experiences can have long-term impacts on their emotional and physical health, social development, education and future employment. Children in care do less well in school than their peers. They are also more likely to experience problems in later life, which can have a wider social impact and lead to higher costs to the public purse. In 2013, 34% of all care leavers were not in employment, education or training, at age 19, compared to 15.5% of 18-year-olds in the general population. By taking a child into care local authorities aim to protect children from further harm, improve outcomes for them, and address a child’s basic need for good parenting.3
3 The Department for Education (the Department) has objectives to improve the quality of care and the stability of placements for children in residential or foster care, so that all children have a good start in life. The Department works with others to meet its objectives (Figure 1 overleaf). Local authorities have a duty to look after their children in care and they use a mixture of their own, private and third sector-run fostering services and residential homes. Social workers judge when to take children into care, assess their needs and the type of placement required, and recommend when they should leave care. Ofsted regulates and inspects independent fostering agencies and individual residential homes against standards set by the Department. It also inspects local authority fostering services. These inspections make judgements on how effectively local authorities meet the needs of children in care. How well services meet the needs of children depends on all parts of this system working effectively together.
1 We have used data to the end of 2012-13 to allow comparison of data on children in care with financial and outcomes data. Some data for the end of 2013-14 have been published (see Appendix Three).
Figure 1
Responsibilities for children in care in 2013
Department for Education
• Sets policy, actions and oversight.
• Provides small proportion of funding.
• Responsible for holding councils to account for performance in delivering children’s services.
Private and third- sector providers
Provide fostering and residential care.
68,110 children in care and their families.
Department for Communities and Local Government
Provides majority of central government funding.
Local authorities
• Responsible for meeting statutory duties.
• Assess risk, put in place appropriate safeguarding measures.
• Coordinate access to fostering services and residential care (which may be in-house).
• Contribute additional funding from other sources, eg council tax receipts.
• Elected members set policy direction and hold officers accountable.
• Run children in care councils to get children in care’s opinion on the services they receive.
Source: National Audit Offi ce
Policy
Quality assurance and accountability
End-users
Working relationships
Accountability for money Accountability for delivery
Ofsted
Inspect and regulates residential homes and fostering agencies.
Scope of this report
4 This report is the first in a series on children’s services. It does not examine the value of the whole care system, but focuses on the role and responsibilities of the Department and how well it is meeting its objectives. It examines:
•
the Department’s responsibilities for children in care; the demand for care; and how effectively children’s needs are being addressed through commissioning (Part One);•
how well the Department is meeting its objectives to improve the quality of care for these children (Part Two); and•
the Department’s understanding of the costs of care and its work to improve the system’s cost-effectiveness (Part Three).5 This report does not examine the Department’s objectives relating to the adoption of children in care as that will be covered in a future report.
Key findings
Meeting the needs of children in care
6 Demand for care is increasing and varies significantly across England.
There were 68,110 children in care at the end of March 2013. This was an increase of 2% compared with March 2012 and an 18% increase compared with March 2000. The number of children in care is at its highest level for 20 years. This is partly due to a rapid rise in the number of children taken into care, following the widely reported abuse and death of ‘Baby P’ in 2007. On 31 March 2013, the proportion of children in each local authority area looked after, ranged from 0.2% in Richmond-upon-Thames to 1.7% in Blackpool, compared with 0.6% of children nationally (paragraphs 1.5 to 1.7 and Figure 2).
7 Unless their needs are correctly assessed and met effectively, there are
significant long-term costs of children not getting the right care. In 2013, 34% of all care leavers were NEET at age 19 compared to 15.5% of 18-year-olds in the general population.4 Academics at York University estimated the lifetime cost of a young person
being NEET at £56,000 a year. Effective commissioning based on good assessments of children’s needs and information on the demand for and costs of care for them could lead to better outcomes for the children and for society. Ultimately, this will lead to better value for the taxpayer (paragraph 1.35 and Figure 5).
8 Early intervention by government could support children, before they are placed away from home and incur costs. The Department has good experience of making such interventions, such as Sure Start children’s centres. The Department for Communities and Local Government’s Troubled Families Programme also shows how central and local government working together effectively on early intervention helps to keep children with their families, rather than enter care. As part of its Innovation Programme, the Department is seeking to support projects that provide services for children before they are placed away from home (paragraphs 1.36 and 1.37).
9 Local authorities told us that they are finding it harder to assess the needs
of children in care and the demand for care. It is a challenge for local authorities to record, analyse and predict the needs of children, as they will have unpredictable reactions to a new environment. Also, the need for care may often be urgent or immediate, precluding the level of needs assessment they would normally undertake. In recent years, assessing need has become more challenging because of financial pressures. Local authorities told us that more children with complex needs and disabilities are coming into care. Forecasts of demand can also be overtaken by responses to events, for example, the recent child sexual exploitation scandals. In 2007, the Department tried to model national demand, but its forecasts underestimated the actual demand following the death of ‘Baby P’ in the same year (paragraphs 1.20 to 1.22).
10 The Department sets out what local authorities must do but not how they should do it. The Department issues statutory guidance and is the only body with national oversight of the care system. Rather than take a national lead, the Department supports sector-led improvement, and relies on local authorities to develop the good practice for children in care. Some local authorities already work together to commission services to meet their shared needs. In the past the Department ran programmes to support better commissioning. In 2014 it launched its Innovation Programme, which aims in part to identify new ways of commissioning services to improve outcomes for children in care (paragraphs 1.3 and 1.10 to 1.12).
11 Although the Department does not choose to manage the market for
12 Local authorities often base decisions on children’s placements on short-term affordability rather than on plans to best meet the child’s needs. Local authorities and providers we interviewed told us that services are often procured on the basis of cost. There is only limited use of commissioning to achieve specific outcomes, such as educational attainment or healthcare. Ofsted found that the commissioning of placements for children at risk of or subject to child sexual exploitation were undertaken through spot purchasing. It also found that due to poor placement planning and the poor commissioning of an initial placement the needs of young people were not being met. Local authorities often choose to place children in their own residential or foster care because they have already committed costs and so need to fill places. They also think the cost is cheaper than private sector provision, although this may not be the case (paragraphs 1.23, 1.24 and 3.14).
The quality of care
13 The Department’s objective is to improve the quality of care but it has no indicators that accurately measure the efficacy of the care system. Although it collects lots of data on children in care, the Department told us there are difficulties around measuring and quantifying improvement. The Department reports progress on a number of outcomes including attainment and absence from school for children in care although it recognises that these are not perfect indicators. Absence from school for children in care improved between 2010/11 and 2012/13 as unauthorised absence fell from 1.5% to 1.1% of possible sessions. The gap in attainment between children in care and their peers has also narrowed slightly from 45 to 43 percentage points over the last 3 years. In 2012/13, 15% of children in care achieved 5 or more GCSEs at grades A* to C including mathematics and English, compared with 58% of children not in care (paragraphs 2.3, 2.6, 2.7, 2.12 and Figures 6 and 8).
14 There has been no improvement in getting children into the right placement first time and close to home. One of the Department’s objectives is to improve the stability of placements. It measures the number of placements a child has in a year and whether they are placed within 20 miles of home. At 31 March 2013:
•
34% of children in care had more than 1 placement during the year and 11% had 3 or more placements. These proportions have been the same since 2009. Some 330 children had 10 or more placements during the year, and 90% of these children went ‘missing’ during the year. Each time a child goes missing it is counted as an extra placement. There is evidence that, in the longer term, placement breakdowns can affect children’s progress in school and their sense of well-being and self-worth (paragraph 2.18 and Figure 9).15 In 2012-13, 79 (5%) of residential homes were rated as inadequate. Because of changes in the inspection regime, the Department does not know if standards in foster agencies and residential homes are genuinely improving or worsening. Quality varies widely by region, with 79% of residential homes rated as good or outstanding in the West Midlands compared with 57% in outer London (paragraph 2.34 and Figure 13).
16 The Department relies on Ofsted’s independent inspections for assurance over the quality of care. The Department only intervenes in response to Ofsted inspections of local authorities’ children’s services departments, rather than its own analysis of data it collects. The Department also relies on Ofsted to inspect the quality of care offered by residential homes and fostering services. And Ofsted also helps poor foster and residential care providers improve. If necessary, as part of its regulatory work, it can close down homes that do not improve to comply with regulations (paragraphs 2.32, 2.33 and 2.37).
17 The Department recognises that in recent years it has prioritised managing local authorities’ performance on adoption over foster and residential care. The Department collects information from local authorities to oversee how well they are improving the quality of care for children who are fostered or in residential homes. Some information is published, including on educational attainment, but mainly at a national level. At the same time, the Department publishes information to highlight and compare all local authorities’ success in placing children for adoption. However, there is no such equivalent for local authorities’ performance in looking after children in foster or residential care (paragraphs 2.4 to 2.6).
The costs of providing care
18 Local authorities’ spending on children’s services has been maintained, despite the overall fall in their spending and rise in numbers of children in care. Local authorities spent £6.9 billion on children’s social care in 2012-13, of which £1.5 billion was spent on fostering, and £1 billion on residential care. Spending on foster and residential care increased by 3% in real terms between 2010-11 and 2012-13 despite reductions in funding for local authorities from central government, while the number of children in care rose from 65,510 in 2010-11, to 68,110 in 2012-13, an annual increase of 4% (paragraph 3.3 and Figure 14).
19 Spending varies between provider and among local authorities. Data on the average amount spent on foster or residential placements also depends on the data source and how the calculation has been made. In 2012-13 the average annual amount spent on:
•
a council foster care placement was in the range of £23,000 to £27,000, compared with a range of £41,000 to £42,000 for a placement with other providers.The Audit Commission also reports a variation among local authorities’ spending on foster care. It calculated that annual spending ranged from:
•
£15,000 to £57,000 for councils’ own foster care provision; and•
£18,000 to £73,000 for other providers’ foster care (paragraphs 3.11 to 3.14 and Figure 20).20 The Department is aware of these cost variations but not all the reasons for them. Neither the Department nor local authorities have a strong understanding of the drivers of costs. The Department has tried to calculate whether cost varies with quality, but could not find a statistical link. Our own analysis also found for example that there is no clear correlation between house prices and the costs of residential care. Without a full understanding of the reasons for cost variations the Department and local authorities will not be able to reduce them (paragraphs 3.15, 3.16 and Figure 15).
21 There are benchmarking tools and sources of data on cost available and the Department could do more to influence local authorities to use them in decision-making. The Department is developing a benchmarking tool so local authorities can compare their costs with others. The tool is based on data that local authorities submit to the Department about their annual expenditure on children in care. However, there are also some issues with the quality of these data as there is no consensus among local authorities on how to cost services and complete the data return. Other benchmarking tools already exist, such as the Centre for Child and Family Research’s Cost Calculator for Children’s Services, but this is not widely used in the sector to make decisions. The Chartered Institute of Public Finance and Accountancy also operates a children looked-after benchmarking club and around one-half of local authorities are members (paragraphs 3.18 and 3.19).
Conclusion on value for money
23 The Department cannot demonstrate that it is meeting its objectives to improve the quality of care and the stability of placements for children through the £2.5 billion spent by local authorities; it has no indicators to measure the efficacy of the care system; and it lacks an understanding of what drives the costs of care. We recognise that the Department is not the only actor in regard to the outcomes for children in care, but it is clearly responsible for key components in setting and driving aspiration, expectation and performance and we cannot conclude that the outcome of the Department’s oversight is efficient or effective enough to constitute value for money. The Department needs to use its new Innovation Programme to understand what works, especially on early intervention, if it is to improve the quality of care and reduce short and long-term cost.
24 The Department agrees the accuracy of the data used in this report, but it does not accept that the report’s key conclusions and recommendations are supported by the evidence.
Recommendations
25 The Department should:
a build on the Innovation Programme and other evaluation and:
•
routinely identify and share authoritative guidance on what works in effective commissioning and therapies for children so that it is embedded in practice; and•
secure feedback from local authorities on the utility of its guidance on what works, for example through an annual survey.b develop, share and pilot models of commissioning for local authorities
to implement. For example, it should encourage a pilot of pooling of local commissioning expertise into larger, more effective groups. It should also identify a single body, possibly the Department, to commission specialist placements.
c review which data collected from local authorities are useful, so worth
keeping, and concentrate on improving the quality of these, particularly local authorities’ financial expenditure reports.
d support effective commissioning of foster places by developing a
standard national contract for foster carers for use by local authorities or independent providers.
e learn lessons from what has worked in improving adoption and apply them
to its oversight of foster and residential care. For example, the publication of comparative data on councils’ performance on time taken to place children for adoption with their new family.
f develop better indicators to allow it to measure the efficacy of the system
Part One
Meeting the needs of children in care
1.1 This part of the report examines:
•
the Department for Education’s (the Department) responsibilities for children in care;•
the demand for care; and•
how effectively needs are being met.Responsibilities for meeting children in care’s needs
1.2 The Department is responsible for developing and overseeing policy implementation for children’s services. Its stated objectives are to improve the quality of care and stability of placements for children in foster and residential care, so all children have a good start in life. However, it has no indicators that accurately measure the efficacy of the care system.
1.3 While the Department does not directly deliver services, it is responsible for holding local authorities to account for their performance in providing services for children in care. There are some functions that only the Department can carry out, or is best placed to do, such as:
•
setting out the statutory duties of local authorities for children’s services;•
setting out expectations for service performance for local authorities including setting targets in the case of adoption;•
collecting and analysing performance data to help local authorities to improve and increase accountability;•
taking an overview of the way services are provided and how the market for providing foster and residential care services is working; and•
intervening where an authority is failing to deliver its services to an acceptable standard.51.4 In addition, as shown in Figure 1:
•
The Department for Communities and Local Government provides themajority of funding for children in care to local authorities. Ensuring the financial accountability and propriety arrangements for children’s services is primarily the responsibility of the local authorities and the Department for Communities and Local Government but the Department for Education holds them to account for service performance.6
•
Local authorities are responsible for ensuring that funding for children’s servicesis spent with regularity and propriety, and for ensuring that value for money is achieved. They are accountable both for services delivered directly by local government officers and for those services commissioned from external providers.7
Authorities give information to the Department for Education about each child in care, and the total amount spent on their children’s social care functions, which indicates the average cost of care per child. They also employ foster carers and some run their own residential homes. Local authorities run 22% of the 1,718 residential homes in England.8 Local authorities employ the social workers
who judge when to take children into care, assess their needs and the type of placement required, and recommend when they should leave care.
•
Ofsted regulates and inspects independent fostering agencies and individualresidential homes against a framework underpinned by the regulations and standards set by Government. It also inspects local authority fostering services. These inspections make judgements on how effectively local authorities meet the needs of children in care.
•
Local Safeguarding Children Boards are a statutory responsibility for each localauthority. Organisations on the board agree on how to work together to safeguard and promote children’s welfare, to hold each other to account and to ensure safeguarding children remains high on the agenda across their region.
•
Private and third-sector organisations provide foster and residential careunder contracts from local authorities. Some are for-profit, others are voluntary sector organisations.
Demand for services
1.5 On 31 March 2013, 68,110 children were looked after by local authorities. Of these:
•
55% were male and 45% were female;•
6% were babies under a year old and 36% were aged 10 to 15 years old; and•
68% had special educational needs.1.6 The number of children in care varies across local authorities in terms of:
•
the total number of children in care – on 31 March 2013 the number ranged from zero in the Isles of Scilly to 1,890 in Birmingham, with the average being 448; and•
the proportion of children in the local authority area aged up to 18 who were in care – on 31 March 2013, the proportion in care ranged from 0.2% inRichmond-upon-Thames to 1.7% in Blackpool. Nationally, 0.6% of children were looked after on 31 March 2013. Rates correlate with the index of social deprivation.
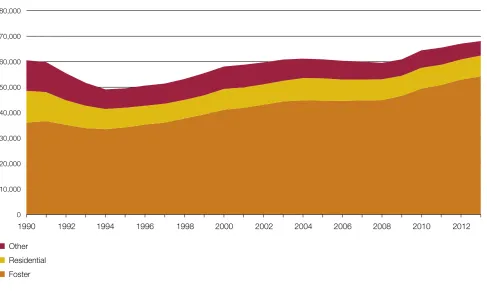
1.7 The demand for care is increasing. The number of children in care rose from 58,100 in 2000, to 68,110 in 2013 – an increase of 18% (Figure 2). In 1994 there were only 49,100 children in care. Compared with March 2012, there was a 2% rise in the number of children in care over the year. Almost all the local authorities we spoke with expect or are already experiencing a rise in referrals linked to child sexual exploitation following the abuse reported in Rotherham and other towns.9
9 A Jay, Independent Inquiry into Child Sexual Exploitation in Rotherham (1997–2013), Rotherham Metropolitan Borough Council, 2014.
0 10,000 20,000 30,000 40,000 50,000 60,000 70,000 80,000
[image:17.595.58.546.430.721.2]1990 1992 1994 1996 1998 2000 2002 2004 2006 2008 2010 2012
Figure 2
The number of children in care, 1990 to 2013
Number of children in care on 31 March
Other Residential Foster
Source: Department for Education
1.8 The demand for care changes daily as children come into and leave care. In 2012-13:
•
local authorities cared for 95,170 children in total;•
28,830 children started to be looked after, and 28,460 children stopped being looked after; and [image:18.595.202.503.391.544.2]•
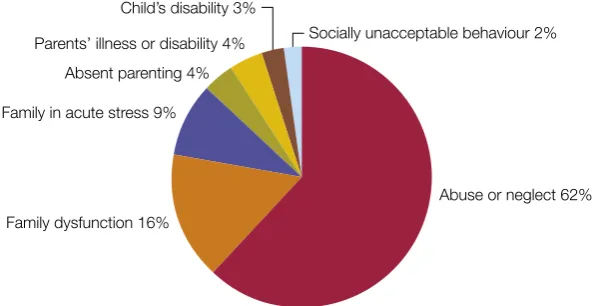
on average a child was in care for 259 days, but this varied by local authority. 1.9 Most children are taken into care because of abuse or neglect (Figure 3). At the end of March 2013, 62% of children were looked after for this reason, a proportion little changed since at least 2009. Children entering the care system are likely to have complex and challenging needs.Figure 3
Main reason for children being looked after, 31 March 2013
Abuse or neglect 62% Family dysfunction 16%
Family in acute stress 9%
Socially unacceptable behaviour 2%
Source: Department for Education’s Statistical First Release SFR 36, 2013, Table A1
Most children are in care because of abuse or neglect
Absent parenting 4% Parents’ illness or disability 4%
Meeting the needs of children in care
The Department’s role
1.10 To help meet its objectives to provide better care (paragraph 1.2), the Department
has tried different approaches to improve the commissioning of care.
•
In 2006 and 2007, it analysed the ability of the care market to respond to demand and ensure the optimum supply of care.•
From 2008 to 2013 it ran a programme that offered support, training and materials to local authorities to help them commission services more effectively to improve outcomes. The Department evaluated the programme and found that although it had made some initial progress, it does not know whether its investment in skills was sustained locally.•
Since 2013 it has been a partner in the Commissioning Academy, with the Cabinet Office, Local Government Association and others to develop commissioning skills.1.11 The Department has also carried out research, for example on the children’s
homes market, to improve the sector’s understanding of the care system and to inform policy. It has worked with the Local Government Association to benchmark local authority data. The Association also supports improvement in the children’s care sector by, for example, offering peer challenge and diagnostics to councils and providing training and development including courses for council leaders.
1.12 In 2014 the Department launched the Innovation Programme and will provide
£100 million of funding in 2014-15 and 2015-16 to support innovation and learn what works best in commissioning. The programme will provide seed funding to encourage local authorities to generate more creative approaches to care. The Department aims to learn and share what works. The programme will run until March 2016 and the Department has set aside funds to evaluate its impact.
1.13 The Department is seeking to improve social work practice. It told us, for example,
Local authorities’ role
1.14 Local authorities have a statutory responsibility to take children at risk of harm
into care and have a ‘sufficiency duty’. This means that they must take steps to secure, as far as reasonably practicable, enough accommodation for children in care within their local area.10
1.15 Local authorities also have a role in training and developing the social workers
who make judgements about children’s needs and how they should be met.
Northamptonshire County Council, for example, launched its social work academy in October 2014 offering graduates a year-long intensive training and support programme.
1.16 To meet children’s needs in a cost-effective way and achieve the best outcomes for
children in care, local authorities need to commission services in line with good practice.
Commissioning in line with good practice
1.17 Providing high-quality and cost-effective care depends on care being
commissioned in line with good practice. This requires commissioners to:
•
define desired outcomes;•
analyse and prioritise needs;•
plan a response;•
generate solutions;•
provide, buy or contract for services that deliver those solutions; and•
review whether outcomes are being met.11We examined the extent to which local authorities and, where appropriate, the Department, are following good practice.
Defining outcomes to improve care
1.18 We found that local authorities do not routinely commission services to achieve
specific outcomes such as health or educational attainment. Local authorities are more likely to describe the features of care they want for the child. Our work in other parts of government has highlighted the need to consider outcomes and quality, not just inputs. Even when outcomes such as school attendance are specified there are no penalties enforced for failing to achieve those outcomes.
10 Children’s Act 1989, Section 22G.
Analysing and prioritising needs
1.19 Assessing needs is a crucial step in the commissioning process. If the local
authority does not understand children’s needs then the services it designs and provides are unlikely to meet those needs and achieve the outcomes required. This represents poor value for money.
1.20 The Department collects comprehensive information on children in care, but it does not use it to forecast demand for services. In 2007, the Department tried to model national demand, but its forecasts underestimated the actual demand following the death of ‘Baby P’ in the same year. The Department told us the decision to take a child into care is a local one and practice varies locally. Relevant factors are hard to predict, such as a tragic incident or the migration of high-need families to an area. We found that some authorities carry forward last year’s figures as a measure of likely demand with no attempt to model or predict changes to the overall number or case mix.
1.21 Local authorities told us that they are finding it harder to assess the needs of individual children and decide the best type of placement for them because:
•
matching of children with foster carers is always a question of judgement without complete information;•
children coming into care will have unpredictable reactions to a new care environment, be it foster or residential;•
children may need care urgently or immediately, so local authorities cannot carry out the level of needs assessment they normally would undertake;•
there can be sudden changes in demand – for example, local authorities we visited said that as child sexual exploitation is becoming better identified they are taking more children into care, and these children will oftenhave complex and demanding needs; and
•
decisions depend on social workers’ experience and judgement.1.22 If local authorities do not get the assessment right, placements are more likely to be changed. This unsettles the child, and means the local authority will ultimately pay more and achieve poorer outcomes for the child.
Planning a response
1.24 Local authorities told us that a particular pressure is emerging for secure residential places for girls at risk of child sexual exploitation. There is no central clearing point for this capacity so local authorities simply have to telephone around England, or even Scotland, to find a free place, if one exists. A report by Ofsted on this issue found that the commissioning of placements for children at risk of or subject to child sexual exploitation were undertaken in all local authorities through spot purchasing arrangements. It also found that children had experienced multiple placement moves and risks remained unaddressed due to poor placement planning and poor commissioning of an initial placement that was failing to meet the needs of the young person.12
1.25 Although faced with growing demand in this area, there is currently no
co-ordination of the commissioning of secure ‘welfare’ places as opposed to ‘criminal justice’ places in secure children’s homes. However, the Department has started to examine its response to the demand for welfare places in secure accommodation. The Youth Justice Board already commissions places nationally as part of its overall secure estate for the small number of children and young people remanded or sentenced by the courts. It makes the decision about where each young person should be placed in partnership with youth offending teams. On 31 March 2013 there were 200 children in 16 secure children’s homes either for their own safety or because they had been placed there by the Youth Justice Board, having been remanded or sentenced by the courts.
Generating solutions
1.26 We found examples of local authorities who are developing new ideas for commissioning foster or residential services:
•
London Borough of Richmond provides its fostering services through a community interest company, jointly with the London Borough of Kingston-upon-Thames;•
Oxfordshire County Council is working in partnership with 6 other local authorities and a private provider to provide residential care and education for young people with complex emotional and behavioural needs. There will be 20 places in 6 homes. Oxfordshire is contracted to use 6 of these beds; and•
an alliance of local authorities across north London has negotiated a price framework with its selected providers.Providing, buying or contracting services
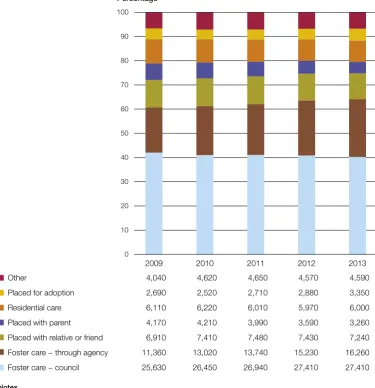
1.27 Most children in care are fostered and the proportion of children being fostered is increasing (Figure 4). On 31 March 2009, 72% of children in care were fostered compared with 75% in 2013. In 2013, 9% were in residential care. Local authorities have made more use of foster care over the past 10 years, although direct placements with parents or other family members have become less common. In 2009, 11,360 foster placements were provided by the private sector rather than local authorities. By 2013, the number was 16,260 – an increase of 43%.
2009 2010 2011 2012 2013 0
[image:23.595.172.548.220.609.2]10 20 30 40 50 60 70 80 90 100
Figure 4
Children in care by type of placement, 2009 to 2013
Percentage
Local authorities have made more use of foster care over the past 10 years, placing a larger proportion of children with private or voluntary sector providers
Other 4,040 4,620 4,650 4,570 4,590
Placed for adoption 2,690 2,520 2,710 2,880 3,350 Residential care 6,110 6,220 6,010 5,970 6,000 Placed with parent 4,170 4,210 3,990 3,590 3,260 Placed with relative or friend 6,910 7,410 7,480 7,430 7,240 Foster care − through agency 11,360 13,020 13,740 15,230 16,260 Foster care − council 25,630 26,450 26,940 27,410 27,410
Notes
1 Placements of children looked after on 31 March each year.
2 Other includes: other placements in the community, other residential settings, residential schools, missing from agreed placement for more than 24 hours, and other placement.
1.28 Local authorities often compete with one another and private sector providers to recruit suitable foster carers, mainly on the amount they pay to foster carers. One local authority told us it had calculated the fees and benefits to a foster carer to be equivalent to a salary of £50,000. In response, the Department has a programme to improve recruiting and retaining foster carers. It allocated £428,000 of funding in 2013-14 to help local authorities to tackle this issue. Some providers are developing specialist foster services. For example, Barnardo’s is training foster parents to specialise in supporting victims of child sexual exploitation and trafficking.
1.29 Local authorities are also working together to buy services from the private sector using framework agreements. These are typically negotiated every 3 to 5 years, to reduce costs and ease the placement process. There are no data on the number of joint agreements operating but providers’ representative bodies are concerned about the costs and duplication involved in bidding to supply places to many local consortia and councils. Framework agreements allow local authorities to place children with providers at the lowest price that meets the quality threshold. Both commissioners and providers told us the market for care could be improved through local authorities joining together to commission services.
Reviewing whether outcomes are being met
1.30 Some things only the Department can do at a national level, given its oversight role and through the information it collects from local authorities and from inspections. The Department holds the national database on all children in care but its understanding of a child’s journey through the care system is limited. We found that it does not make enough use of its data to understand how different types of care provision affect the outcomes for children.
1.31 A recent report by Ofsted, for example, highlighted the lack of an agreed national performance data set, relating to child sexual exploitation including information on both missing children and looked-after children moving into and out of a local authority area. As a result, Ofsted considered that the true extent of, and response to, child sexual exploitation was uncertain. It concluded that local authorities were not held to account effectively for the performance of the partnership approach to child sexual exploitation at a local, regional or national level.13
1.32 All local authorities we visited have children in care councils, an initiative supported and promoted by the Department. These give children in care an opportunity to voice their views and experiences of the care system and to influence and improve the services they receive from their local authority. However, it is not clear how feedback informs commissioning decisions.
1.33 The Children’s Commissioner for England also promotes and protects children’s rights in England. She listens to what children say about what matters to them and then makes sure adults in charge take children’s views and interests into account, particularly those children living away from home or receiving social care.
1.34 Both the Department and local authorities recognise that other parts of government will pay more in the longer term if care does not meet the needs of children and results in poor outcomes. Local authorities find it hard to evaluate the long-term benefits of preventative and remedial work with children. The immediate costs must come from their own budget. Most residential care providers offer therapies to meet children’s needs. These are either included in framework contract prices or as optional extras, although the local authorities we spoke with had no evidence base showing whether the therapies were effective.
Long-term cost to the taxpayer
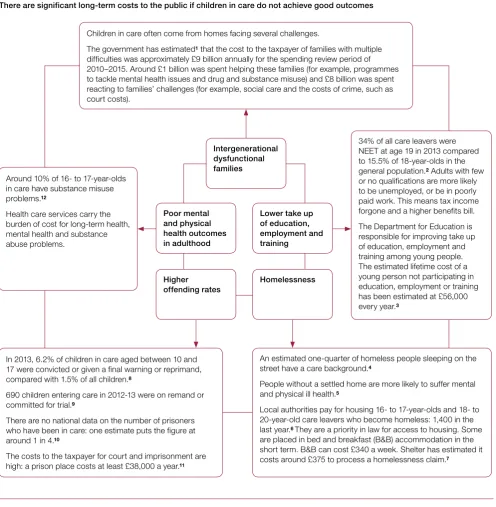
1.35 Children’s early experiences can have long-term impacts on their emotional and physical health, social development, education and future employment. One aim of local authorities for their children in care is to improve their outcomes. If children’s learning and development needs are not successfully tackled, they can experience significant and avoidable detriment. This can result in long-term risks and costs to local authorities and the taxpayer (Figure 5 on pages 24 and 25).
1.36 One way to prevent these costs is through early intervention. In the past, as we have reported, the Department has taken a positive lead in establishing early intervention services for children, such as Sure Start children’s centres.14 The Department for
Communities and Local Government’s Troubled Families Programme also shows how central and local government can work together effectively on early intervention. Although not specifically aimed at helping children on the edge of care, at a hearing of the Committee of Public Accounts in January 2014 the government described how some local authorities were using the programme for this purpose:
“… every time we properly solve what is happening in a family, which means that a child does not have to go into foster care, you are saving £40,000. There are lots of reasons and lots of things they can do with the programme that help them more generally”.15
1.37 As part of its new Innovation Programme (paragraph 1.12), the Department is also seeking to support projects relating to services that help children on the edge of care.
14 Comptroller and Auditor General, Early action: landscape review, Session 2012-13, HC 683, National Audit Office, January 2013.
Figure 5
Long-term costs to the individual and taxpayer
Children in care often come from homes facing several challenges.
The government has estimated1 that the cost to the taxpayer of families with multiple
difficulties was approximately £9 billion annually for the spending review period of 2010–2015. Around £1 billion was spent helping these families (for example, programmes to tackle mental health issues and drug and substance misuse) and £8 billion was spent reacting to families’ challenges (for example, social care and the costs of crime, such as court costs).
34% of all care leavers were NEET at age 19 in 2013 compared to 15.5% of 18-year-olds in the general population.2 Adults with few
or no qualifications are more likely to be unemployed, or be in poorly paid work. This means tax income forgone and a higher benefits bill.
The Department for Education is responsible for improving take up of education, employment and training among young people. The estimated lifetime cost of a young person not participating in education, employment or training has been estimated at £56,000 every year.3
An estimated one-quarter of homeless people sleeping on the street have a care background.4
People without a settled home are more likely to suffer mental and physical ill health.5
Local authorities pay for housing 16- to 17-year-olds and 18- to 20-year-old care leavers who become homeless: 1,400 in the last year.6 They are a priority in law for access to housing. Some
are placed in bed and breakfast (B&B) accommodation in the short term. B&B can cost £340 a week. Shelter has estimated it costs around £375 to process a homelessness claim.7
In 2013, 6.2% of children in care aged between 10 and 17 were convicted or given a final warning or reprimand, compared with 1.5% of all children.8
690 children entering care in 2012-13 were on remand or committed for trial.9
There are no national data on the number of prisoners who have been in care: one estimate puts the figure at around 1 in 4.10
The costs to the taxpayer for court and imprisonment are high: a prison place costs at least £38,000 a year.11
Around 10% of 16- to 17-year-olds in care have substance misuse problems.12
Health care services carry the burden of cost for long-term health, mental health and substance abuse problems.
There are significant long-term costs to the public if children in care do not achieve good outcomes
Intergenerational dysfunctional families Poor mental and physical health outcomes in adulthood
Figure 5
continued
Long-term costs to the individual and taxpayer
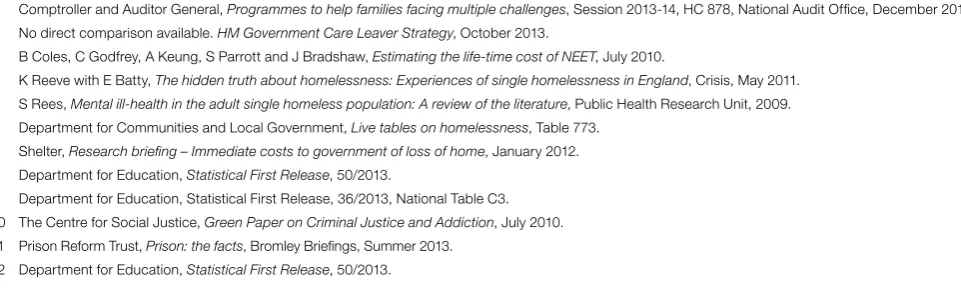
Notes
1 Comptroller and Auditor General, Programmes to help families facing multiple challenges, Session 2013-14, HC 878, National Audit Offi ce, December 2013. 2 No direct comparison available. HM Government Care Leaver Strategy, October 2013.
3 B Coles, C Godfrey, A Keung, S Parrott and J Bradshaw, Estimating the life-time cost of NEET, July 2010.
4 K Reeve with E Batty, The hidden truth about homelessness: Experiences of single homelessness in England, Crisis, May 2011. 5 S Rees, Mental ill-health in the adult single homeless population: A review of the literature, Public Health Research Unit, 2009. 6 Department for Communities and Local Government, Live tables on homelessness, Table 773.
7 Shelter, Research briefi ng – Immediate costs to government of loss of home, January 2012. 8 Department for Education, Statistical First Release, 50/2013.
9 Department for Education, Statistical First Release, 36/2013, National Table C3. 10 The Centre for Social Justice, Green Paper on Criminal Justice and Addiction, July 2010. 11 Prison Reform Trust, Prison: the facts, Bromley Briefi ngs, Summer 2013.
Part Two
Progress in improving care
2.1 This part of the report examines:
•
the Department for Education’s (the Department) objectives for improving quality of care; and•
progress against these objectives.Objectives for improving the quality of care
2.2 Although local authorities have a duty to look after their children in care, it is the Department’s responsibility to ensure, through effective oversight, that these children receive high-quality care. The Children’s Act (1989) requires local authorities to ensure that a child is given the type of placement that best meets their needs, regardless of cost.16
2.3 The Department has set out its objectives as being to improve:
•
the quality of foster and residential care; and•
the stability of foster and residential care placements.2.4 The Department relies on local authorities to organise and often provide the care placements. It draws on Ofsted’s inspection judgements on the quality of local authority and private sector fostering services and residential homes. However, it has no indicators of its own that accurately measure the efficacy of the care system or help it to hold local authorities to account for their performance. Although it collects lots of data on children in care the Department told us there are difficulties around measuring and quantifying improvement. As there are no official Departmental measures of performance we have used a range of data published by the Department to indicate progress against its objectives.
2.5 Staff in local authorities and providers told us that roles and responsibilities for delivering good-quality services were clear as they are often defined in law. However, although they noted that the Department takes an active role in overseeing and intervening in adoption, they were less clear about its objectives for fostering and residential care. The government has made adoption a policy priority and has invested £200 million to reform and improve local authority adoption services.17
16 Hansard HC,Children’s Act 1989, Section 3.22c.
2.6 The Department has also recognised this priority in the way that it manages local authorities’ performance on adoption compared to fostering and residential care services. While it has set local authorities a target to place children for adoption with their new family within 14 months, it has not set targets for improving the quality of foster or residential care. In some cases it does not consider it appropriate to do so.18
In its business plan, however, the Department includes indicators on children in care’s attainment and absence from school to help the public assess the effects of its policies. It publishes statistics each year to show progress against its business plan, although considers there are flaws in these indicators. For example, educational attainment does not reflect the amount of progress a child has made because of good care. Other indicators record decisions taken about children’s care, not whether the reasons behind the decisions were sound.
Progress against the Department’s objectives
Educational attainment and absence from school
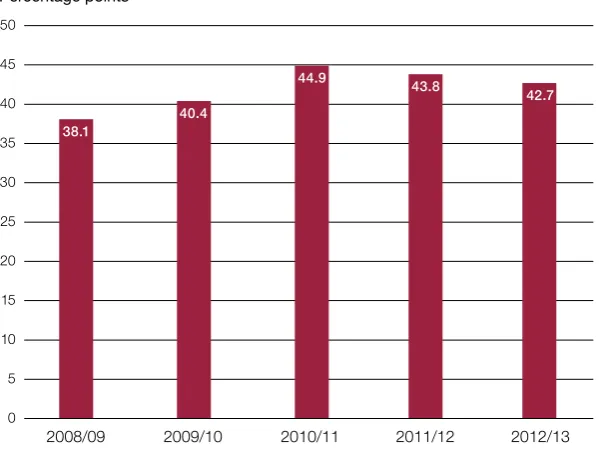
2.7 The Department wants to reduce the gap in attainment between children in care and their peers. This a key indicator against which it reports progress. The gap in GCSE performance has narrowed from 45 to 43 percentage points over the last 3 years (Figure 6 overleaf). In 2012/13, 15% of children in care achieved 5 or more GCSEs at grades A*-C including mathematics and English, compared with 58% of children not in care.
2.8 Some 68% of children in care have special educational needs, compared with 19% of the general school-age population. This means that they must overcome extra challenges to achieve their potential. Around 40% of children in care without a special educational need achieved 5 or more GCSEs including mathematics and English. Only 11.7% with a special educational need did so.
2.9 The Department also measures the educational achievements of children in care compared to children who are not in care, typically at the ages of 7 and 11-years-old.19
In 2013, compared to 2012:
•
At age 7, the attainment gap between children in care and children who are not in care narrowed for writing (from a difference of 26% to 24%). For reading and mathematics the attainment gaps have remained the same at 20% for both measures.•
At age 11, the attainment gap between children in care and children who are not in care narrowed for mathematics and writing (from a difference of 28% to 26% and from 30% to 28% respectively. For reading the attainment gap remained at 23%, but has fallen from 27% since 2009 (Figure 7 on page 29).2.10 To improve the educational attainment of children in care, the Department requires all local authorities to have a virtual school head. This is a person who champions the educational ambitions on behalf of the authority’s children in care. The Department also:
•
applies pupil premium to all children in care, and introduced pupil premium plus which more than doubled the amount for each child from £900 since 2011 to £1,900;•
gives children in care a £1,200 bursary if they are on a further education course; and [image:30.595.156.456.241.475.2]•
funds local authorities to provide a £2,000 bursary for care leavers at university. 2.11 Local authorities we spoke to expected positive results from these changes. However, the Department has not put in place a system for measuring whether virtual school heads achieve positive change. Local authorities do not yet have data showing evidence of any change.Figure 6
Gap in attainment of 5 or more GCSEs at grades A*−C including
mathematics and English, between children in care and their peers,
2008/09 to 2012/13
Percentage points
The large attainment gap between children in care and their peers has begun to narrow slightly
Note
1 Only children who have been looked after continuously for at least 12 months are included.
Source: Department for Education’s Statistical First Release SFR50, 2013, Table 3 50
45
40
35
30
25
20
15
10
5
0
2008/09 2009/10 2010/11 2011/12 2012/13
38.1
40.4
44.9
43.8
Figure 7
Gap in attainment in learning skills at age 11 between children in care
and their peers, 2008/09 to 2012/13
At age 11, children in care are behind their peers in learning skills such as mathematics and reading
Mathematics (test)
Reading (test)
Writing (teacher assessment)
Grammar, punctuation and spelling (test)
0 5 10 15 20 25 35
Percentage points
Note
1 Only children who have been looked after continuously for at least 12 months are included.
Source: Department for Education’s Statistical First Release SFR50, 2013, Table 2 2008/09
2009/10 2010/11 2011/12 2012/13
32
30
33 29 28 26
27 29 25 23 23
30 28
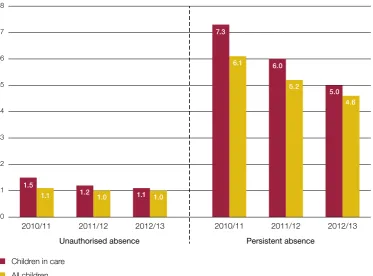
2.12 The Department’s other key performance indicator for children in care is absence from school. Absence improved between 2010/11 and 2012/13 (Figure 8). Unauthorised absence fell from 1.5% to 1.1% of possible sessions. The share of looked-after pupils who were persistent absentees also fell from 7.3% to 5.0%. This was faster than the general downward trend in absence, which fell from 6.1% to 4.6%.
[image:32.595.156.530.385.661.2]2.13 The Department also collects data on children in care excluded from school. In 2011/12, 0.15% of children in care were permanently excluded from school. This is over 2 times higher than the rate for all children at 0.07%. However, permanent and fixed term exclusions for children in care have fallen in recent years, faster than the trend for all children.
Figure 8
Absence from school, 2010/11 to 2012/13
Percentage of sessions missed
Unauthorised and persistent absence for children in care is improving and the gap between them and their peers is narrowing
Notes
1 Only children who have been looked after continuously for at least 12 months.
2 Unauthorised absence is expressed as a percentage of the total number of possible sessions.
3 Persistent absentees are defined as having 46 or more sessions of absence (authorised and unauthorised) during the year, around 15% overall absence rate. The percentage is calculated by dividing the number of persistent absentees by the total number of enrolments.
Source: Department for Education’s Statistical First Release SFR50, 2013, Table 12 Children in care
All children 0 1 2 3 4 5 6 7 8
Unauthorised absence Persistent absence
2.14 The Department also publishes annual data on several key indicators. These measure placement stability, distance of placements from home, health and wellbeing, and the destinations of children leaving care.
Placement stability
2.15 Evidence shows that having multiple care placements reduces children’s opportunities to develop secure attachments. It may also worsen any existing behavioural and emotional difficulties. This can make it more difficult for children to establish relationships with carers and lead to further placement breakdown and rejection.20 Bath Spa University has found that secure attachment relationships
correlate strongly with higher academic attainment, better self-regulation and social competence.21
2.16 However, where children have a single placement this could be a sign of inaction on the part of a local authority when children should be moved. High placement stability does not necessarily correlate with good Ofsted judgements. For this reason the Department does not set targets for placement stability. It considers that this could risk driving decisions that are not necessarily in the best interests of the individual child.
2.17 The number of placements in a year can be interpreted as a measure of the effectiveness of assessment of need. Some providers told us that to save money local authorities choose to place all children in foster care at first even though it is clear that some need residential care from the start.
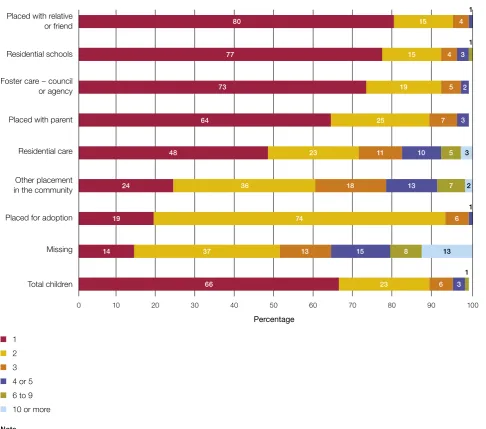
2.18 Of children being looked after on 31 March 2013, 34% had more than 1 placement
during the year and 11% had more than 3 placements (Figure 9 overleaf). Both these proportions have remained the same since 2009. Children whose latest placement was in foster care had more stable placements than those in residential care on 31 March 2013: 26% of children in foster care had more than one placement during the year compared with 52% of children in residential care. Children in residential homes often have more complex and difficult needs than children in foster care. Some 330 young people moved placement 10 or more times during the year. Of these children, 90% went ‘missing’ during the year. Each time a child goes missing it is counted as an extra placement. The Department has recognised that this indicator mixes two different issues – going missing and placement numbers. From 2014-15 the Department will collect data on the numbers missing and number of placements separately.
20 E Munro and A Hardy, Placement stability: a review of the literature, Loughborough University, 2006.
100
Figure 9
Number of placements by type of final placement in the year ending 31 March 2013
Children placed in foster care have more stability during the year compared with residential care
Note
1 Data values have been rounded to the closest percentile. Missing means ‘Children who are missing from their placements’.
Source: Department for Education’s Statistical First Release 36, 2013 Placed with relative
or friend
Placed with parent Residential schools
Foster care − council or agency
Residential care
Other placement in the community
Placed for adoption
Missing
Total children
Percentage
10 20 30 40 50 60 70 80 90
0.00 19 73 5 7 25 64 4 3 2 3 3 2 7 18 36 24
19 74 6
13 8 15 13 37 14
66 23 6 3
13 5 10 11 23 48 15 77 15 4 1 1 1 1 80 1 2 3 4 or 5 6 to 9 10 or more
2.19 Large numbers of children in care who are returned home re-enter care. A report by the NSPCC and Loughborough University on supporting children and families returning home from care, indicated that there are a range of factors to explain the high rates of reunification breakdown and that deficits in social care case management and a lack of support for children and families to address their issues are significant drivers.22
The Department has calculated that around 30% of the 10,270 children returned home in 2006-07 re-entered care within 5 years.23 The Centre for Child and Family Research
has calculated that the estimated cost of failed returns is £300 million a year.
Distance of placements from home
2.20 An out-of-authority placement is a care setting for a looked-after child outside the boundaries of the authority that is legally responsible for that child. In some cases, there may be good reasons for placing a child at a distance, for example to break links with undesirable peer groups, but evidence suggests that vulnerable children placed outside their authority – especially those placed a long way from it – may be at risk. This is because they may be deprived of sufficient oversight and support from their responsible authority. They may need to change school and may not be able to maintain relationships with their family and friends.
2.21 In 2013, the Department introduced reforms to reduce the number of children placed at a distance from their home. It defines this as children not placed in their local authority area or a neighbouring authority area. A local authority’s Director of Children’s Services must now approve any decision to place a child at a distance. Local authorities must consult and notify each other of decisions relating to placing or receiving children to care for in their areas. It is too early yet to tell whether its reforms are having an impact in reducing the number of children placed a distance from home. However, the Department has collected data from local authorities on the number of children placed out of their local authority and whether they are placed within or beyond 20 miles from home, for a number of years.
2.22 As described in paragraph 1.14, local authorities must ensure that as far as possible they have enough accommodation to care for children in their area. However, there has been little improvement in the proportion of children who are placed 20 miles or closer to home in recent years (Figure 10 overleaf). The Department acknowledges that there is sometimes good reason to place a child at a distance from home. On 31 March 2013, 14% of foster children and 34% of those in residential care were placed more than 20 miles from home. These figures have not improved in the last 4 years.
22 L Holmes, Supporting children and families returning home from care, NSPCC and Loughborough University, September 2014.
2009-1 0 2010-1 1 2011-12 2012-13 2009-1 0 2010-1 1 2011-1 2 2012-13 0 10 20 30 40 50 60 70 80 90 10 0
Figu
re
10
Childr
en in ca
re
by
ca
re
ty
pe and distance fr
om home
, 31
Mar
ch
20
10
-1
1
to
20
12
-1
3
Per centage The proportion of childr
en being placed 20 miles or mor
e fr
om home is not falling
Not known 5 4 3 3 9 7 5 4
Over 20 miles
14 14 14 14 33 32 33 34
20 miles or less
[image:36.595.64.497.224.780.2]2.23 The Education Select Committee’s report published in March 2014,24 said evidence
suggested that the sufficiency duty was being disregarded:
•
Of 4,890 children living in children’s homes in England on 31 March 2012, 46% were living in homes out of their local authority area and 30% were living more than 20 miles from home.In addition, the Department’s own research into residential care found that in 2012:25
•
16 local authorities placed all of their children outside their area.•
55 local authorities had fewer places in their area than the number of children they placed, compared with 40 authorities in 2011.2.24 As well as children being placed out of authority, often siblings are placed apart, although this is improving slightly. In 2011, 73% of the children in care who had one or more siblings also in care were separated from brothers or sisters by being given different placements.26 In 2009 the figure was 76%, and in 2010 it was 74%.
2.25 There is a mismatch between the supply of and demand for residential care. Some 43% of all children’s homes are in the North West or West Midlands (Figure 11 on pages 36 and 37). This may explain why many children are placed out of their local authority area or 20 miles or more from home. The Department is aware of the mismatch, but does not play a role in managing the market.
Health checks for children in care
2.26 The Department monitors whether children in care have annual dental and health checks, and that their immunisations are up to date. All children in care should have these checks. More than 1 in 10 children in care did not receive regular health and dental checks in 2013. This proportion has not improved significantly over the past 3 years (Figure 12 on page 38). In 2013 only:
•
13 local authorities ensured 100% of children in care’s immunisations were up to date;•
5 local authorities ensured 100% of children had the required dental checks; and•
10 local authorities ensured 100% of children had their annual health assessments.24 Education Committee, Residential Children’s Homes, Sixth Report of Session 2013-14, HC 716, 5 March 2014. 25 Department for Education, Children Homes Data Pack, June 2014.
Figure 11
Demand and supply for care
Map 1 shows the supply of care (the number of residential homes)
Figure 11
continued
Demand and supply for care
Map 2 shows the demand for care (the number of looked-after children). The distribution of residential homes does not match the needs of children
Note
1 Each range contains a fi fth of all Englands children in care.
Source: Map 1 – Ofsted data on providers; Map 2 – Department for Education, Statistical First Release 36, Table LAA1
Note
1 Each range contains a fi fth of all Englands children’s homes.
46 to 96 27 to 46
17 to 27 11 to 17
0 to 11
960 to 1,890
630 to 960 480 to 630
330 to 480 0 to 330
Number of residential homes1
Figure 11
Demand and supply for care
Map 1 shows the supply of care (the number of residential homes)
Figure 11
continued
Demand and supply for care
Map 2 shows the demand for care (the number of looked-after children). The distribution of residential homes does not match the needs of children
Note
1 Each range contains a fi fth of all Englands children in care.
Source: Map 1 – Ofsted data on providers; Map 2 – Department for Education, Statistical First Release 36, Table LAA1
Note
1 Each range contains a fi fth of all Englands children’s homes.
46 to 96 27 to 46
17 to 27 11 to 17
0 to 11
960 to 1,890
630 to 960 480 to 630
330 to 480 0 to 330
Number of residential homes1
2.27 Although other children may not be taken for health checks by their parents, in the case of children in care such checks are important. Foster carers and residential care workers are paid to ensure each child in their care attends all relevant health appointments, including their health assessment. Children often enter care with a worse level of physical health and mental health than their peers in part due to the impact of poverty, abuse and neglect.27
2.28 For the year ending 31 March 2013, data shows some improvements in the health and wellbeing of children in care.
•
Of those children in care aged between 10 and 17 years, 6.2% had been convicted or subject to a final warning or reprimand during the year compared with 7.2% in 2011.•
The rate of substance misuse among children in care has fallen from 4.2% in 2011 to 3.5%.•
However, there has been very little change in the emotional and behavioural health of children in care over the last 3 years when based on SDQ scores.2827 Department for Children, Schools and Families and the Department of Health, Statutory Guidance on Promoting the Health and Well-being of Looked-after Children, 2009.
[image:40.595.154.530.206.467.2]28 The Strengths and Difficulties Questionnaire (SDQ) is a child mental health questionnaire for children aged 2 to 17 years old.
Figure 12
Health checks on children in care, 2011 to 2013
Rates of immunisation and annual health assessments are improving, but there has been no progress on dental care
Note
1 Only children who have been looked after continuously for at least 12 months.
Source: Department for Education’s Statistical First Release SFR50, 2013, Table 6 Not had an annual
health assessment
Teeth not checked by dentist
Immunisations not up to date
0 5 10 15 20 25
Percentage
2011 2012
13
2013
14 16
18 18 18
17 17
The destinations of children leaving care
2.29 One-third (35%) of children leaving care in 2012-13 returned to their family. Following a sustained effort from the Department and local authorities, the number of children in care placed for adoption increased last year to 14% (3,980). A similar number began to live independently. Of these, 1,180 children in care moved into unsupported independent living, and this has not improved.
2.30 The number of young people who leave care aged 16 and 17 is falling, with more staying until they are 18. In 2013, 68% of young people leaving care waited until their 18th birthday (61% in 2009). However, 16% still leave at age 16 and 15% at age 17.
2.31 To prevent young people leaving foster care at age 18 from losing their settled home, in May 2013 the Department issued guidance to local authorities called
Staying Put. The guidance says young people should be allowed to stay in a settled
foster placement, at the local authority’s expense, until they are 21. The Department has provided £40 million in extra funding over the next 3 years. Local authorities we interviewed welcomed the increased stability of foster care this offers. But they were concerned that the extra funding may not be enough and they would need to increase foster care capacity to make up for those children choosing to remain in care until 21.
Staying Put does not appl