JOURNAL OFVIROLOGY, May 2011, p. 4399–4408 Vol. 85, No. 9 0022-538X/11/$12.00 doi:10.1128/JVI.01703-10
Copyright © 2011, American Society for Microbiology. All Rights Reserved.
Epstein-Barr Virus LMP1 Activates EGFR, STAT3, and ERK
through Effects on PKC
␦
䌤
Che-Pei Kung,
1†# David G. Meckes, Jr.,
2† and Nancy Raab-Traub
1,2*
Department of Microbiology and Immunology, University of North Carolina at Chapel Hill, Chapel Hill, North Carolina 27599,1
and Lineberger Comprehensive Cancer Center, University of North Carolina at Chapel Hill, Chapel Hill, North Carolina 275992
Received 11 August 2010/Accepted 2 February 2011
Epstein-Barr virus (EBV) is a ubiquitous herpesvirus that infects more than 90% of the world’s adult population and is linked to multiple malignancies, including Burkitt lymphoma, Hodgkin disease, and naso-pharyngeal carcinoma (NPC). The EBV oncoprotein LMP1 induces transcription of the epidermal growth factor receptor (EGFR), which is expressed at high levels in NPC. EGFR transcription is induced by LMP1 through a p50 NFB1-Bcl-3 complex, and Bcl-3 is induced by LMP1-mediated activation of STAT3. This study reveals that LMP1, through its carboxyl-terminal activation domain 1 (LMP1-CTAR1), activates both STAT3 and EGFR in a serum-independent manner with constitutive serine phosphorylation of STAT3. Upon treat-ment with EGF, the LMP1-CTAR1-induced EGFR was additionally phosphorylated and STAT3 became phosphorylated on tyrosine, concomitant with upregulation of a subset of STAT3 target genes. The kinase responsible for LMP1-CTAR1-mediated serine phosphorylation of STAT3 was identified to be PKC␦using specific RNAi, a dominant negative PKC␦, and the PKC␦inhibitor rottlerin. Interestingly, inhibition of PKC␦ also inhibited constitutive phosphorylation of EGFR and LMP1-CTAR1-induced phosphorylation of ERK. Inhibition of PKC␦blocked LMP1-CTAR1-mediated transformation of Rat-1 cells, likely through the inhibi-tion of ERK activainhibi-tion. These findings indicate that LMP1 activates multiple distinct signaling pathways and suggest that PKC␦functions as a master regulator of EGFR, STAT3, and ERK activation by LMP1-CTAR1.
Infecting more than 90% of the world’s population, the Epstein-Barr virus (EBV) is a ubiquitous human gammaher-pesvirus. EBV is transmitted through saliva and infects oro-pharyngeal epithelial cells and B-lymphocytes, resulting in a life-long infection (38). Persistent, latent EBV infection is present in several lymphoid and epithelial malignancies, in-cluding Burkitt lymphoma, Hodgkin disease, and nasopharyn-geal carcinoma (NPC). The tumors are latently infected with expression of a subset of viral genes in the malignant cells which contain EBV episomes (38).
EBV latent membrane protein 1 (LMP1) is considered the major oncogene as it is essential for B-lymphocyte transforma-tion and can also transform rodent fibroblast cells (19, 47). LMP1 functions as a constitutively active tumor necrosis factor receptor (TNFR) due to aggregation through its six transmem-brane domains and interactions with tumor necrosis factor-associated factors (TRAFs) (31, 34). Multiple signaling path-ways are activated by LMP1, including mitogen-activated protein kinase (MAPK), c-Jun N-terminal kinase (JNK), phos-phatidylinositol 3-kinase (PI3K)/Akt, and NF-B (7, 28, 36, 39). LMP1 induces transcription of many genes to affect apop-tosis, cell cycle progression, cell proliferation, and migration (9, 10, 41). Two major signaling domains in the C-terminal tail of LMP1, carboxyl-terminal activation regions 1 and 2 (CTAR1
and CTAR2), mediate LMP1-associated signaling pathways by recruiting different TRAFs (44). LMP1-CTAR1 recruits TRAF1/2/3/5 through a TRAF-binding motif residing from amino acids (aa) 204 to 208 (PQQAT), whereas CTAR2 re-cruits TRAF2 and TRAF6 through adapters TRADD and BS69 (44).
In addition to distinctive TRAF binding, CTAR1 and CTAR2 also have different effects on signaling activation and cellular transformation. LMP1-CTAR1 specifically induces MAPK and PI3K/Akt signaling, while CTAR2 activates the JNK pathway (6, 28, 29). LMP1-CTAR2 activates strong canon-ical NF-B signaling, whereas LMP1-CTAR1 induces more complex NF-B signaling, including canonical, noncanonical, and atypical pathways (22, 24, 31). LMP1-CTAR1 also uniquely induces expression of TRAF1, ID1, and the epidermal growth factor receptor (EGFR) (9, 31). Importantly, LMP1-CTAR1 has been shown to be required for LMP1-mediated transfor-mation of B-lymphocytes and rodent fibroblasts, while CTAR2 is dispensable (16, 19, 28). These findings suggest that LMP1-CTAR1 may have more significant effects in the development of malignancy.
EGFR is a member of the ErbB receptor tyrosine kinase fam-ily. Multiple signaling pathways are activated by the EGFR, in-cluding Ras/MAPK, Src kinases, JAKs/STATs, and PI3K-Akt (17). EGFR signaling is targeted by proteins of several onco-genic viruses to mediate transformation, including v-ErbB, E5, HBVx, and LMP1 (32). Elevated amounts of EGFR are de-tected in NPC, and its expression and secretion from the cell in exosomes correlates with the levels of LMP1 (30, 48). Treat-ment with EGFR tyrosine kinase inhibitors induces cell cycle arrest and inhibits cell proliferation of NPC cell lines (49). These findings suggest that the effect of LMP1 on EGFR is an
* Corresponding author. Mailing address: Lineberger Compre-hensive Cancer Center, University of North Carolina at Chapel Hill, Chapel Hill, NC 27599. Phone: (919) 966-1701. Fax: (919) 966-9673. E-mail: [email protected].
† C-P.K. and D.G.M. contributed equally to this study.
# Present address: Fox Chase Cancer Center, 333 Cottman Avenue W209, Philadelphia, PA 19111.
䌤Published ahead of print on 9 February 2011.
4399
on November 7, 2019 by guest
http://jvi.asm.org/
important factor in EBV-mediated carcinogenesis and is a prime target for development of therapeutic strategies.
Signal transducers and activators of transcription (STATs) consist of a family of cytoplasmic proteins that, upon stimula-tion by cytokines or growth factors, translocate into the nucleus and transactivate cellular target genes that are involved with cell proliferation, cell cycle regulation, apoptosis, angiogenesis, and differentiation (20). The transcriptional activity of STAT3 is regulated by phosphorylation. Phosphorylation of tyrosine 705 and serine 727 affect translocation and the transcrip-tional activity of STAT3, respectively (1). Serine-phosphory-lated STAT3 induced by LMP1 has been shown to specifically bind to the promoter and enhancers that regulate expression of Bcl-3 leading to the formation of p50/Bcl-3 complexes, the unique form of NF-B that regulates EGFR expression (21). STAT3 is activated in NPC and B-cell lymphomas that develop in LMP1-transgenic mice (2, 40). Inhibition of STAT3 ad-versely affects the growth of lymphomasin vitro(40). A positive autoregulatory loop, in which LMP1-activated STAT3 regu-lates LMP1 expression through effects on the novel LMP1 terminal repeat promoter, has been described (4). LMP1-me-diated tyrosine phosphorylation of STAT3 has been linked to JAK1 or JAK3, although whether LMP1 interacts directly with JAKs is controversial (12, 13). In this study, the effects of LMP1 on EGFR and STAT3 activation were further analyzed. The data indicate that LMP1 through effects on PKC␦induces serine phorphorylation of STAT3, ERK activation, and con-stitutive phosphorylation of EGFR.
MATERIALS AND METHODS
Cell culture, plasmids, and reagents.Cervical carcinoma cell line C33A cells, Rat-1 cells, and 293T cells were cultured in Dulbecco’s modified Eagle’s medium (DMEM) (Gibco) supplemented with 10% fetal bovine serum (FBS) (Sigma) and antibiotic/antimycotic (Gibco) at 37°C with 5% CO2. Constructs expressing
HA-tagged pBabe LMP1, pBabe-HA-LMP1-CTAR1 (which contains aa 1 to 231 of LMP1) and pBabe-HA-LMP1-CTAR1 (1-220) (which contains aa 1 to 220 of LMP1 and has signaling and transforming abilities that are similar to those of pBabe LMP-1-CTAR1), were generated as described previously (9, 29). To generate double stables, Rat-1 cells stably expressing full-length LMP1 or vector control were transfected with a PKC␦dominant negative (DN) construct (43) by FuGENE6 transfection according to the manufacturer’s instructions (Roche). Double stables were selected in DMEM containing 8g/ml puromycin and 10
g/ml G418. Small chemical inhibitors, including rottlerin, Go¨6976, U0126, LY294002, and AG1478, were purchased from Calbiochem. To test the effects of inhibitors on LMP1-CTAR1-mediated pathways, the growth medium was re-placed with serum-free DMEM supplemented with an antibiotic or antimycotic for 24 h. Inhibitors were added for 5 h before lysates were prepared. Dimethyl sulfoxide (DMSO; Sigma) was added at 1:1,000 as the vehicle control. To test the activity of EGFR, serum-starved cells were treated with 500 ng/ml EGF (Austral Biologicals) and 100M AG1478 for 10 or 30 min before cell lysates were harvested.
Retrovirus production and transduction.Recombinant retrovirus production and retroviral transduction were performed as previously described (29). Sub-confluent 293T cells in 100-mm plates were transfected by FuGENE 6 transfec-tion reagent (Roche) with 5g pBabe (vector), pBabe-HA-LMP1-CTAR1 or pBabe-HA-LMP1-CTAR1 (1–220), and 5g pVSV-G and 5g pGag/Pol ex-pressing plasmids. After incubation at 37°C for 24 h, the medium was replaced with fresh medium (DMEM supplemented with 10% FBS and antibiotic/antimycotic) and cells were incubated at 33°C for 24 h. The cell supernatant was clarified, and the virus-containing supernatant was collected. Stable cell lines were produced by trans-duction with clarified virus supernatant with 4g/ml Polybrene for 24 h at 37°C, followed by selection with 1g/ml of puromycin (Sigma).
Cell lysates harvesting and Western blot analysis.Cells were harvested at 90% confluence, washed with cold phosphate-buffered saline (PBS) (Gibco), scrape harvested in cold PBS, centrifuged at 1,000⫻g for 5 min, and lysed with radioimmunoprecipitation assay (RIPA) buffer (20 mM Tris-HCl [pH 7.5], 150
mM NaCl, 1 mM EDTA, 1% NP-40, 0.1% sodium dodecyl sulfate [SDS], 0.1% deoxycholic acid) supplemented with 0.5 mM phenylmethylsulfonyl fluoride (PMSF), 1 mM sodium orthovanadate (Na3VO4), protease, and phosphatase
inhibitor cocktail (Sigma). Cell lysates were clarified, and the protein concen-tration was determined using the Bio-Rad DC protein assay system. Equal amounts of protein were used for SDS-polyacrylamide gel electrophoresis (PAGE), and the samples were transferred to Optitran (Schleicher and Schuell) for Western blot analysis. Membranes were blocked for 1 h at room temperature in Tris-buffered saline containing 0.1% Tween 20 and 5% nonfat dry milk. Primary antibodies include anti-GAPDH, anti-STAT3, anti-ERK, anti-phospho-ERK (Tyr 204) (Santa Cruz), anti-phospho-Akt (Ser 473), anti-phospho-STAT3 (Ser 727 and Tyr 705), anti-phospho-EGFR (Tyr 992/1045/1068; Cell Signaling), anti-activated EGFR (BD Biosciences), anti-Bcl-3 (Millipore and Santa Cruz), and anti-HA tag (Covance). A rabbit antiserum generated against the carboxyl-terminal 100 amino acids of the EGFR fused to glutathioneS-transferase was kindly provided by H. Shelton Earp (University of North Carolina at Chapel Hill) and used to detect expression of total EGFR. Secondary antibodies used to detect Abs-bound proteins include horseradish peroxidase (HRP)-conjugated mouse, rabbit (Amersham Pharmacia), and goat (Dako) anti-bodies. After incubation with secondary antibodies, blots were developed using Pierce Supersignal West Pico or Femto chemiluminescence system according to the manufacturer’s instructions, followed by exposure to X-ray film (ISCBioexpress).
Transient transfection of C33A cells.Plates of C33A cells were transfected at 80% confluence in Optimem (Gibco) media by Lipofectamine 2000 transfection according to the manufacturer’s instructions (Invitrogen) with PKC␦DN or pSUPER.PKCdelta.RNAi (43, 45). Following a 4-h incubation with the DNA-Lipofectamine complexes, the medium was replaced with serum-free DMEM. At 24 h posttransfection the cells were washed with PBS and harvested as described above for immunoblot analysis.
Quantitative real-time PCR (QRT-PCR).Total RNA of cells was isolated using RNeasy kit (Qiagen). Quantitative real-time PCR (QRT-PCR) was per-formed using the Quantifast SYBR green RT-PCR kit (Qiagen). PCR products were detected using the ABI 7900HT sequence detection system (Applied Bio-systems) and analyzed using SDS 2.0 software (Applied BioBio-systems). The cycle threshold (CT) was determined as the number of PCR cycles required for reac-tions to reach an arbitrary fluorescence value within the linear amplification range. The change inCT(⌬CT) was determined between the same target gene primer sets and different samples, and the change in⌬CT(⌬⌬CT) was deter-mined by adjusting for the difference in the number of cycles required for GAPDH to reach theCT. The fold change was determined as 2⌬⌬
CT
, since each PCR cycle results in a 2-fold amplification of PCR products. Primers used in this study are listed in Table 1.
Gene annotation.Gene identifiers (GeneID) were as follows: EGFR, 1956; SOCS3, 9021; Bcl-xL, 598; Fos, 2353; CEBPD, 1052; GAPDH, 2597; Cyclin D1, 595; Bcl-3, 602; EGF, 1950; amphiregulin, 374; TGF␣, 7039; HB-EGF, 1839; epiregulin, 2069.
Focus formation and contact inhibition transformation assays.Focus forma-tion assays were performed as described previously (28). Subconfluent Rat-1 fibroblast cells plated in 6-well plates were transduced with recombinant retro-virus for 24 h. Fresh medium (DMEM supplemented with 10% fetal bovine serum and antibiotic/antimycotic) were then changed every other day for 10 days. The effect on focus formation by inhibition of PKC␦using rottlerin was deter-mined using 1M rottlerin or vehicle control DMSO added daily with freshly changed medium. After foci could be clearly identified, cells were stained with 1% crystal violet (dissolved in 50% methanol) and images were taken under a stereomicroscope.
To test the effect of the PKC␦DN on rodent fibroblast transformation, cell lines stably expressing pBABE vector control, LMP1, pBABE with PKC␦DN, and LMP1 with PKC␦DN were established and grown for 10 to 14 days to reach confluence and assessed for loss of contact inhibition. Cells were stained with crystal violet and observed for overgrowth and loss of contact inhibition at⫻10 magnification with phase contrast.
Data analysis.Data from three or more independent experiments were used to compute mean averages and standard errors. Statistical significance was eval-uated using a computerized, paired two-tailed Studentttest. Differences were considered significant atP⬍0.05.
RESULTS
LMP1-CTAR1 activates EGFR and STAT3.We have previ-ously shown that LMP1, through LMP1-CTAR1, induces
on November 7, 2019 by guest
http://jvi.asm.org/
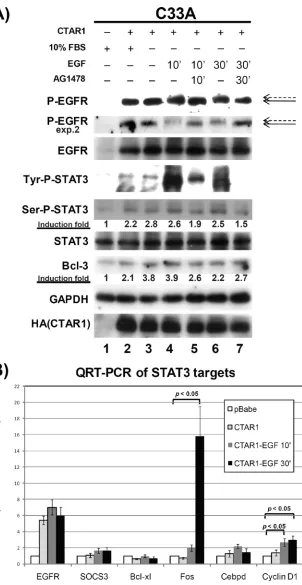
EGFR expression through activation of NF-B p50 and tran-scriptional upregulation of Bcl-3 by activated STAT3 (21, 46). To investigate the effects of LMP1 on activation of EGFR and STAT3, C33A cells stably transduced with LMP1-CTAR1 were cultured in 10% serum or serum starved for 24 h and whole-cell lysates were analyzed by immunoblotting (Fig. 1A). In serum-supplemented medium, LMP1-CTAR1 induced ex-pression and activation of EGFR, determined using antibody specific for activated EGFR (lane 2). LMP1-CTAR1 also in-duced both tyrosine and serine phosphorylation of the tran-scriptional activator STAT3 but did not affect the total level of STAT3. The levels of Bcl-3 were increased approximately 2-fold. Interestingly, EGFR and STAT3 were still phosphory-lated in the absence of serum and expression of Bcl-3 was induced to levels similar to those for cells grown in 10% FBS (lane 3). These data indicate that the activation of EGFR and STAT3 by LMP1 are independent of the addition of growth factors in the medium.
It is known that EGFR interacts with STAT3 and functions as a tyrosine kinase to activate STAT3 (37). To determine the effects of EGF treatment on LMP1-CTAR1-induced EGFR and STAT3 phosphorylation, serum-starved LMP1-CTAR1-expressing C33A cells were treated with 500 ng/ml of EGF with and without AG1478, a selective inhibitor of the EGFR tyrosine kinase, and analyzed by Western blotting (Fig. 1A). Treatment with EGF for 10 min greatly increased the tyrosine phosphorylation of STAT3 but did not affect the serine phos-phorylation of STAT3 or expression of Bcl-3 (lane 4). The EGF-induced tyrosine phosphorylation of STAT3 was inhib-ited by AG1478, indicating that EGF-induced STAT3 tyrosine phosphorylation is dependent on EGFR kinase activity (lane 5). Treatment with EGF for 30 min resulted in slightly lower tyrosine phosphorylation of STAT3 than was found with 10 min of EGF treatment (lane 6). Importantly, expression of Bcl-3 was not reduced by inhibition of EGFR kinase, indicat-ing that the induction of Bcl-3 by LMP1 was not mediated through EGFR activation of STAT3.
The major band signal detected with antibody specific for activated EGFR was not changed by EGF treatment; however, a subtly shifted band was detected in both 10-min and 30-min EGF-treated samples (Fig. 1A, lanes 4 and 6, indicated by the dashed arrow) that was not detected with simultaneous AG1478 treatment (lanes 5 and 7). The shifted band was more apparent in a second experiment with less protein (exp. 2). These data suggest that in addition to effects of LMP1-CTAR1
in the absence of serum, EGF treatment stimulated additional phosphorylation of EGFR and the tyrosine phosphorylation of STAT3.
To determine if the STAT3 phosphorylation induced by EGF treatment affected the expression of STAT3 target genes, the RNA of EGF-treated LMP1-CTAR1 cells was isolated and analyzed for expression of several previously identified STAT3 targets, including SOCS3, Bcl-xL, Fos, CEBPD, and Cyclin D1, using real-time quantitative RT-PCR (Fig. 1B) (42). The RNA levels of SOCS3 and Bcl-xL were not significantly changed after 10 or 30 min of treatment with EGF. Expression of CEBPD went up by 2.2-fold with 10 min of EGF treatment but decreased down to 1.4-fold after 30 min of treatment with EGF. The expression of Cyclin D1 increased by 2.7-fold after 10 min of EGF treatment and stayed at 3-fold after 30 min of treatment with EGF. The mRNA of Fos changed most dra-matically with a 2-fold induction after 10 min of EGF treat-ment and an increase of approximately 15.8-fold following 30 min of treatment with EGF. Statistical analysis revealed that the changes of Cyclin D1 and Fos were significant (P⬍0.05). These data suggest that in C33 cells in response to EGF treat-ment a subset of previously identified targets of STAT3 are induced.
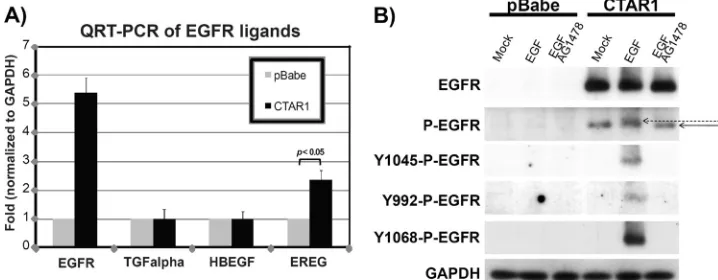
Effects of LMP1-CTAR1 on expression of EGFR ligands.To determine if LMP1-CTAR1-mediated serum-independent ac-tivation of EGFR reflects effects on EGFR ligands, real-time quantitative RT-PCR was performed (Fig. 2A). Expression of the EGFR ligands, EGF and amphiregulin, was not detected using QRT-PCR (data not shown). Transcription of TGF␣, heparin-bound EGF (HBEGF), and epiregulin (EREG) was also assessed in serum-starved vector control and LMP1-CTAR1-expressing C33A cells. EGFR expression was ana-lyzed as a positive control, and expression levels were normal-ized to GAPDH. The mRNA levels for TGF␣ and HBEGF were not affected in LMP1-CTAR1-expressing cells compared to those in vector control cells, while the mRNA expression of epiregulin was induced by 2.4-fold in LMP1-CTAR1-express-ing cells in the absence of serum compared to that in vector control cells. This result indicates that in C33 cells, LMP1-CTAR1 increases epiregulin transcription that could contrib-ute to LMP1-CTAR1-mediated EGFR activation.
[image:3.585.41.547.82.208.2]To determine if LMP1-CTAR1 activates EGFR by mimick-ing ligand-triggered autophosphorylation of EGFR, EGFR phosphorylation was evaluated by Western blot analysis using antibodies specific for phosphorylated tyrosine residues, Tyr
TABLE 1. Quantitative RT-PCR primers
Target gene Primer sequence (from 5⬘to 3⬘)
Forward Reverse
GAPDH TGCACCACCAACTGCTTAGC GAGGGGCCATCCACAGTCTT
EGFR CTGCGTCTCTTGCCGGAATG TTGGCTCACCCTCCAGAAGG
SOCS3 CCTCAAGACCTTCAGCTCCA TCACTGCGCTCCAGTAGAAG
Bcl-xL CTTGGATGGCCACTTACCTG TGCTGCATTGTTCCCATAGA
Fos AAGGAGAATCCGAAGGGAAA AGTTGGTCTGTCTCCGCTTG
CEBPD ATCGACTTCAGCGCCTACAT GCCTTGTGATTGCTGTTGAA
Cyclin D1 GATCAAGTGTGACCCGGACT TCCTCCTCTTCCTCCTCCTC
TGF␣ GCCAGCATGTGTCTGCCATT CACCACCAAGGCGGTGA
HB-EGF TGGAGAATGCAAATATGTGAAGGA AGGATGGTTGTGTGGTCATAGGTAT
Epiregulin TTCCATCATGTATCCCAGGAG ATTGACACTTGAGCCACACG
VOL. 85, 2011 EBV LMP1 ACTIVATES PKC␦ PATHWAYS 4401
on November 7, 2019 by guest
http://jvi.asm.org/
FIG. 1. LMP1-CTAR1-mediated activation of EGFR and STAT3. (A) C33A cells stably transduced with pBabe or LMP1-CTAR1 were maintained in DMEM with 10% FBS. LMP1-CTAR1 cells were then serum starved for 24 h and treated with DMSO (lane 3), EGF (500 ng/ml) for 10 min (lane 4), EGF/AG1478 (inhibitor of EGFR tyrosine kinase, 100M) for 10 min (lane 5), EGF for 30 min (lane 6), or EGF/AG1478 for 30 min (lane 7). Whole-cell protein lysates were prepared for Western blot analysis. Activation of EGFR was detected by using antibody against tyrosine-phosphorylated EGFR. The solid arrow points at LMP1-CTAR1-activated EGFR, and the dashed arrow points at the shifted EGFR after EGF treatment. GAPDH was detected as a loading control, and HA-specific antibody was used to detect expression of LMP1-CTAR1. Data are representative of results of three independent experiments. (B) Total RNA was extracted from serum-starved LMP1-CTAR1 cells treated with DMSO, EGF for 10 min, or EGF for 30 min, and quantitative real-time RT-PCR was performed with primers against STAT3 target genes. Results from QRT-PCR were normalized to GAPDH, and expressions of STAT3 targets in pBabe control cells were set to 1. Results were graphed as mean averages with standard errors of the mean and were computed from triplicate results of three or more separate experiments. Statistical significance was evaluated using a computerized, paired two-tailed Studentttest. Differences were considered significant atP⬍0.05.
4402
on November 7, 2019 by guest
992, Tyr 1045, and Tyr 1068, that are sites of autophosphory-lation (Fig. 2B) (33). Compared to LMP1-CTAR1-expressing C33A cells, vector control cells express a very low level of EGFR and the phosphorylation of EGFR was not detectable after EGF treatment. In contrast, phosphorylation of Tyr 1045, Tyr 1068, and Tyr 992 (to a lesser extent) were all increased after EGF treatment in serum-starved LMP1-CTAR1-express-ing cells concomitant with the size shift detected by activated EGFR antibody (indicated by the dashed arrow). These spe-cific EGF-induced sites of phosphorylation were blocked by the EGFR kinase inhibitor AG1478, confirming that they are dependent on EGFR autophosphorylation. However, these three sites of phosphorylation were not detected in LMP1-CTAR1-expressing cells without EGF treatment, suggesting that the constitutive phosphorylation of EGFR was not due to autophosphorylation of these sites. This finding also suggests that the basal levels of EGFR activation are likely not due to epiregulin binding.
LMP1-CTAR1-induced serine phosphorylation of STAT3 requires PKC␦.Multiple kinases have been shown to mediate serine phosphorylation of STAT3, including several pathways that are activated by LMP1 (5). To assess the effects of specific kinases on induced STAT3 phosphorylation, LMP1-CTAR1-expressing C33A cells were treated with either DMSO or inhibitors of previously identified serine kinases of STAT3, including rottlerin (PKC␦inhibitor), Go¨6976 (PKC␣/ inhib-itor), U0126 (MEK/ERK inhibinhib-itor), and LY294002 (PI3K in-hibitor) (Fig. 3A) (5). As previously shown, LMP1-CTAR1 (lane 2) induced EGFR expression, Bcl-3 expression, and phosphorylation of STAT3 compared to parental C33A cells (lane 1). The PKC␦ inhibitor rottlerin inhibited LMP1-CTAR1-induced serine phosphorylation but not tyrosine phos-phorylation of STAT3 at 5M and more significantly at 40M (lane 3 and 4). At 40 M, rottlerin also reduced LMP1-CTAR1-induced Bcl-3 protein expression, confirming previous findings that Bcl-3 transcription was regulated by
serine-phos-phorylated STAT3. The effects of the inhibitors on the levels of STAT3 serine phosphorylation and Bcl-3 expression from three independent experiments were quantitated and graphi-cally represented (Fig. 3). The levels of tyrosine-phosphory-lated STAT3 could not be quantitated due to the high back-ground with the anti-Tyr antibody. Treatment with 5 M rottlerin decreased serine-phosphorylated STAT3 by approxi-mately 50%, while treatment with 40M rottlerin decreased STAT3 serine phosphorylation by more than 80%. Similarly, Bcl-3 was decreased 40 to 60% with increasing rottlerin treat-ment. Treatment with the PKC␣/inhibitor, Go¨6976, did not decrease serine phosphorylation of STAT3, suggesting that LMP1-CTAR1-induced serine phosphorylation of STAT3 was PKC␦specific and independent of PKC␣/ (Fig. 3A, lane 5, Fig. 3B). MAPK has been shown to phosphorylate STAT3, and inhibition of MEK/ERK with U0126 effectively decreased LMP1-CTAR1-induced ERK phosphorylation but did not block LMP1-CTAR1-induced serine phosphorylation of STAT3 (lane 6). Similarly, inhibition of PI3K with LY294002 blocked CTAR1 activation of Akt but did not affect LMP1-induced serine STAT3 phosphorylation or ERK activation (lane 7). These results suggest that PKC␦, but not PI3K, MAPK, or PKC␣/, is responsible for LMP1-CTAR1-induced serine phosphorylation of STAT3.
[image:5.585.109.468.72.212.2]LMP1-CTAR1 has been previously shown to significantly activate Akt and ERK in rodent fibroblasts (29). However, in the highly transformed, malignant parental C33A cell line, ERK and Akt were highly activated and only slightly elevated levels of Akt and ERK phosphorylation were detected in LMP1-CTAR1-expressing C33A cells. Importantly, inhibi-tion of PKC␦ also blocked phosphorylation of ERK (Fig. 3A, lane 3 and 4), suggesting that LMP1 through PKC␦ activates MAPK, leading to phosphorylation of ERK. The ability to specifically inhibit activation of PI3K or ERK indi-cates that these pathways are independently activated by LMP1.
FIG. 2. LMP1 effects on EGFR ligands and phosphorylation. (A) Total RNA was extracted from serum-starved pBabe control or LMP1-CTAR1-expressing C33A cells, and QRT-PCR was performed with primers against potential EGFR ligands. Results from QRT-PCR were normalized to GAPDH, and levels of EGFR ligands in pBabe control cells were set to 1. Results were graphed as mean averages with standard errors of the mean and were computed from triplicate results of four separate experiments. Statistical significance was evaluated using a computerized, paired two-tailed Studentt test. Differences were considered significant atP ⬍ 0.05. (B) Serum-starved pBabe control and LMP1-CTAR1-expressing C33A cells were treated with either DMSO (Mock), EGF 500 ng/ml, or EGF plus 100M AG1478 for 10 min before the whole-cell lysates were subject to Western blot analysis using antibodies against total EGFR, activated (tyrosine-phosphorylated) EGFR, or specific phosphorylation of EGFR (Tyr 992, 1045, or 1068). Expression of GAPDH was measured as the loading control. The solid arrow indicates LMP1-CTAR1-activated EGFR, and the dashed arrow indicates the EGF-induced band-shift of EGFR. Images shown here are representative of results of three independent experiments.
VOL. 85, 2011 EBV LMP1 ACTIVATES PKC␦ PATHWAYS 4403
on November 7, 2019 by guest
http://jvi.asm.org/
To evaluate the effects of rottlerin on the activation of the endogenous kinases in the absence of LMP1-CTAR1, the pBabe vector control cells were treated with rottlerin and com-pared to the effects in the LMP1-CTAR1 cells (Fig. 3B). Ele-vated levels of serine-phosphorylated STAT3 were readily de-tected in the LMP1-CTAR1-expressing cells, and treatment with rottlerin effectively inhibited serine phosphorylation in a dose-dependent manner in the LMP1-CTAR1 expressing cells and also eliminated the low levels of serine phosphorylated STAT3 in the vector control cells. Bcl-3 was not detected in the vector control cells; however, rottlerin clearly dose-depend-ently decreased Bcl-3 in the LMP1-CTAR1 cells. An increase in activated ERK was not detected in the LMP1-CTAR1 C33 cells in comparison to the level in the pBabe vector control; however, 5M rottlerin treatment blocked the activation of ERK in the LMP1-CTAR1 cells and at 40 M decreased activated endogenous ERK (Fig. 3B). These data suggest that in addition to serine phosphorylation of STAT3, PKC␦is also responsible for the LMP1-CTAR1-induced and endogenous ERK phosphorylation in C33A cells. Interestingly, treatment with rottlerin also inhibited the constitutive phosphorylation of EGFR. PKC␦has been previously shown to be an upstream mediator of EGFR activation, and in some systems, this acti-vation has been suggested to be mediated by c-src(15).
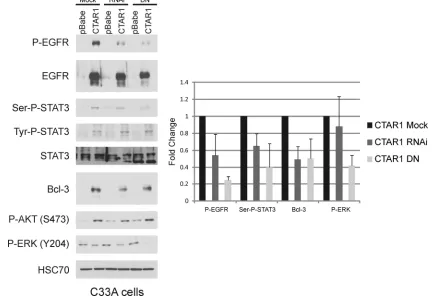
It has been shown that at higher doses rottlerin can inhibit other kinases; therefore, to demonstrate the specificity of PKC␦ for these effects, vector control and LMP1-CTAR1 cells were transfected with either a PKC␦RNA interference (RNAi) or a dominant negative (DN) PKC␦(Fig. 4) (43, 45). The RNAi had slight effects on serine phosphorylation of
STAT3, ERK activation, or EGFR phosphorylation. However, the PKC␦DN reduced STAT3 serine phosphorylation, ERK phosphorylation, and levels of activated EGFR. Bcl-3 and total EGFR were slightly decreased, while total levels of STAT3 and activation of Akt were not affected. These data support the findings with rottlerin and suggest that PKC␦is responsible for LMP1-CTAR1 mediated effects on serine-phosphory-lated STAT3, constitutive activation of EGFR, and activa-tion of ERK.
[image:6.585.59.521.66.296.2]Activation of PKC␦is required for rodent fibroblast trans-formation. Previous studies have shown that inhibition of LMP1-CTAR1-mediated activation of ERK blocked rodent fibroblast transformation (29, 39). To test the requirement for PKC␦in LMP1-mediated transformation and confirm PKC␦ -mediated activation of ERK, the effect of its inhibition was assessed using a focus formation assay in Rat-1 fibroblast cells (Fig. 5A). Subconfluent Rat-1 cells were transduced with LMP1-CTAR1 (1–220)-containing retrovirus at three different dilutions (10⫺1, 10⫺2, and 10⫺3). Many foci were induced at the 10⫺1 dilution of LMP1-CTAR1, and focus formation de-creased proportionally with the 10⫺2and 10⫺3retrovirus dilu-tions, indicating that focus formation was LMP1-CTAR1 spe-cific. Treatment with 1M rottlerin blocked focus formation at all three dilutions. Western blot analysis confirmed that ERK activation correlated with the levels of LMP1 retrovirus and ERK phosphorylation was blocked by rottlerin treatment (Fig. 5B). Immunoblotting with total-ERK antibody indicated that the total level of ERK was not affected and GAPDH expres-sion was assessed as an internal loading control. Comparison of the pBabe control Rat-1 cells with LMP1 cells confirmed the
FIG. 3. LMP1-CTAR1-induced serine phosphorylation of STAT3 is inhibited with PKC␦inhibitor rottlerin. (A) C33A cells stably transduced with pBabe or LMP1-CTAR1 were maintained in DMEM with 10% FBS. The media were replaced with serum-free medium for 24 h, and both groups of cells were treated with DMSO for 5 h (lanes 1 and 2). LMP1-CTAR1 cells were also treated with the PKC␦inhibitor (50 or 40M rottlerin, lanes 3 and 4), PKC␣/inhibitor (5 nM Go¨6976, lane 5), MEK/ERK inhibitor (10M U0126, lane 6), and PI3K inhibitor (25M LY294002, lane 7) for 5 h. Band intensities were determined using ImageJ software, normalized to GAPDH levels, and represented relative to the pBabe control level. Results were graphed as mean averages with standard errors of the mean and were computed from triplicate results of three or more separate experiments. (B) pBabe and LMP1-CTAR1 cells were treated with rottlerin for 5 h. Whole-cell protein lysates were prepared for Western blot analysis. HSC70 was detected as a loading control.
on November 7, 2019 by guest
http://jvi.asm.org/
robust activation of ERK in Rat-1 cells in contrast to the slight effects in C33 cells, and this activation was decreased by treat-ment with 5M rottlerin and totally blocked by 40M rot-tlerin (Fig. 5C). These findings suggest that PKC␦is required for LMP1-mediated transformation of Rat-1 cells and that PKC␦mediates the activation of ERK by LMP1.
To test the effects on transformation of specific inhibition of PKC␦, the PKC␦ DN was stably expressed in the pBABE control and CTAR1 Rat-1 cells and the loss of contact inhibi-tion was evaluated (Fig. 6). As previously described, the vector control Rat-1 cells formed monolayers that were contact in-hibited whereas the LMP1 cells continued to grow and form mounds of cells. The PKC␦DN effectively blocked this pro-cess, and both the vector control and the LMP1 cells stopped growing after formation of a confluent monolayer (Fig. 6A). Evaluation of ERK activation indicated that the PKC␦ DN inhibited LMP1-mediated ERK activation but did not affect basal levels of activated ERK (Fig. 6B).
DISCUSSION
This study shows that LMP1-CTAR1 induces EGFR expres-sion and activation of EGFR, STAT3, and ERK through its effects on PKC␦(Fig. 7). In the presence of LMP1 and in the absence of serum, EGFR was constitutively phosphorylated
[image:7.585.73.505.74.370.2]but not at the canonical autophosphorylation sites at tyrosine 992, 1045, or 1068. These tyrosines are also known to be critical for recruitment of STAT3 to EGFR (18, 33). In LMP1-ex-pressing cells, STAT3 was constitutively phosphorylated on serine and tyrosine and treatment with EGF induced abundant tyrosine phosphorylation of STAT3 and expression of a subset of known STAT3 target genes (42). LMP1-CTAR1 also in-duced serum-independent serine phosphorylation of STAT3, which was not changed by treatment with EGF or its inhibitor, AG1478. These data indicate that the LMP1-CTAR1-induced serine phosphorylation of STAT3 is not dependent on EGFR signaling. Specific inhibition of multiple serine kinases revealed that only the PKC␦-inhibitor rottlerin reduced serine phosphor-ylation of STAT3, suggesting that PKC␦, but not PKC␣/, ERK, or PI3K, is responsible for LMP1-CTAR1-induced serine phosphorylation of STAT3. These findings were confirmed using a PKC␦DN. LMP1 has not been previously shown to activate PKC␦-dependent signaling pathways, although it does regulate Annexin 2 and Ezrin through PKC␣/ (8, 27). In addition to blocking serine phosphorylation of STAT3, rot-tlerin and PKC␦also decreased expression of Bcl-3. We have previously shown that LMP1 induced binding of serine-phos-phorylated STAT3 to the Bcl-3 promoter and enhancer to regulate Bcl-3 (21). These findings suggest that distinct cellular genes are regulated by serine- or tyrosine-phosphorylated
FIG. 4. LMP1-CTAR1-induced serine phosphorylation of STAT3 is dependent on PKC␦. C33A cells stably transduced with pBabe or LMP1-CTAR1 were transfected with pSUPER.PKCdelta.RNAi (RNAi) or PKC␦-dominant negative (DN) for 24 h in serum free media. Whole-cell lysates were prepared and separated by SDS-PAGE for immunoblot analysis. HSC70 was used as a loading control. Band intensities were determined using ImageJ software, normalized to HSC70 (or EGFR for p-EGFR) levels, and represented relative to the control level. Band intensities were determined using ImageJ software, normalized to HSC70 levels, and represented relative to the pBabe control level. Results were graphed as mean averages with standard errors of the mean and were computed from triplicate results of three separate experiments.
VOL. 85, 2011 EBV LMP1 ACTIVATES PKC␦ PATHWAYS 4405
on November 7, 2019 by guest
http://jvi.asm.org/
STAT3. PKC␦-mediated serine phosphorylation of STAT3 has been shown to be important for keratinocyte proliferation, and LMP1 activation of STAT3 is required for the enhanced growth properties of LMP1 transgenic lymphocytes (11, 40).
Interestingly, inhibition of PKC␦, which is known to activate the MAPK pathway through several mechanisms, also blocked both LMP1-CTAR1-induced and endogenous ERK phosphor-ylation (17). The activation of ERK by LMP1 was blocked by inhibition of MAPK, which did not affect serine phosphoryla-tion of STAT3. Addiphosphoryla-tionally, the activaphosphoryla-tion of PI3K and Akt was not affected by either inhibition of MAPK or PKC␦, indi-cating that these pathways are independently activated. These findings suggest that PKC␦functions as a master regulator to activate STAT3 and ERK as distinct pathways (Fig. 7). The inhibition of focus formation and ERK phosphorylation in Rat-1 cells through inhibition of PKC␦suggests that PKC␦is required for LMP1-mediated transformation through activa-tion of ERK.
The serum-independent tyrosine phosphorylation of EGFR may reflect the expression of potential ligands, as low levels of transcription of TGF␣and HBEGF and slightly increased epi-regulin were detected (Fig. 7). It is possible that different EGFR ligands may be affected by LMP1 expression in distinct cell lines. Interestingly, mice with LMP1 transgenes develop epidermal hyperplasia, and this is consistent with increased expression of activated EGFR and its ligands, TGF␣, HBEGF,
[image:8.585.299.541.68.233.2]and epiregulin (3). Upon ligand binding, oligomerization and autophosphorylation of EGFR activate multiple signal-ing pathways (18). The LMP1-CTAR1 effects on potential EGFR ligands may be responsible for the low levels of tyrosine
[image:8.585.42.282.69.290.2]FIG. 6. PKC␦is required for LMP1-induced loss of contact inhibi-tion. (A) Rat-1 cells stably expressing pBabe, LMP1, pBabe.PKC␦ -DN, or LMP1.PKC␦-DN were grown for 10 to 14 days. The medium was replaced every 2 days with fresh DMEM. Cells were stained with crystal violet and observed for focus formation at⫻10 magnification with phase contrast. (B) Confluent dishes of pBabe, LMP1, pBabe.PKC␦-DN, and LMP1.PKC␦-DN Rat-1 cells were harvested, and cell lysates were analyzed by immunoblot analysis for p-ERK levels, with HSC70 detected as a loading control.
FIG. 5. Rottlerin inhibits LMP1-CTAR1-induced focus formation. (A) Rat-1 cells were transduced with pBabe and LMP1-CTAR1 (1– 220) at three different dilutions, maintained for 10 days, stained with crystal violet, and observed for focus formation. The effect of PKC␦ inhibition was determined using 1 M rottlerin. (B) Whole-cell protein lysates were prepared from a duplicate of the focus forma-tion experiment described for panel A. (C) p-Babe or LMP1-CTAR1 Rat-1 cells were treated for 5 h with DMSO (lane 1) or rottlerin (5 or 40M). Western blot analysis on cell lysates sepa-rated by SDS-PAGE was performed using antibodies against total ERK and phosphorylated ERK. GAPDH or HSC70 were detected as loading controls. Data shown are representative of results of three independent experiments.
FIG. 7. Model of LMP1 activation of EGFR, STAT3, and ERK. LMP1-CTAR1 induces intrinsic activation/phosphorylation of EGFR, which can be further activated by EGF to induce STAT3 tyrosine phosphorylation and the expression of STAT3 target genes (black arrows). LMP1-CTAR1 induces PKC␦-dependent serine phosphory-lation of STAT3 and Bcl-3 upreguphosphory-lation (gray arrows). The PKC␦ inhibitor, rottlerin, and PKC␦DN inhibit serine phosphorylation of STAT3, activation of EGFR, and activation of MEK/ERK (white arrows). The MEK/ERK inhibitor U0126 blocks LMP1-CTAR1-me-diated phosphorylation of ERK as well as transformation of Rat-1 cells, indicating that PKC␦contributes to LMP1’s transforming ability by functioning upstream of MEK.
on November 7, 2019 by guest
http://jvi.asm.org/
[image:8.585.302.538.414.614.2]phosphorylation of STAT3 observed in serum-starved LMP1-CTAR1 cells. However, phosphorylation of the specific tyrosines known to be phosphorylated after ligand binding that enable STAT3 activation was not detected.
Intriguingly, inhibition of PKC␦using rottlerin or the PKC␦ DN blocked the intrinsic phosphorylation of EGFR induced by LMP1-CTAR1. Other tyrosine kinases, such as Src, have been shown to phosphorylate EGFR and regulate its activity, and this phosphorylation has been linked to EGFR inhibitor-resistant cancers (35). Activation of c-src by PKC␦leading to the phosphorylation of EGFR has been described (15). The phosphorylation and properties of EGFR are complex, and its phosphorylation profile can differ remarkably in differ-ent cell lines. At least nine tyrosines can potdiffer-entially be phos-phorylated by c-src(33). It will be important to characterize the effects of LMP1 on specific sites of EGFR phosphorylation and determine the potential effects of LMP1 on the activity of c-src. EGFR expression and STAT3 activation are elevated in NPC, and STAT3 activation is important for the invasiveness of EBV-associated NPC, which can be blocked by STAT3 inhibitor treatment (25, 26). The effects of LMP1 on EGFR, STAT3 activation, and regulation of STAT3 target genes may be important factors in the development of NPC. In breast carcinoma, the EGFR signaling pathway induces epithelial-mes-enchymal transition (EMT) of cancer cells through STAT3-me-diated TWIST gene expression and subsequently E-cadherin downregulation (23). LMP1 has also been shown to induce TWIST expression and EMT in NPC cells (14). These findings suggest that LMP1 mediates the EGFR-STAT3 signaling path-way to regulate cellular transcriptional and biologic properties. In summary, this study reveals that LMP1-CTAR1 induces the intrinsic activation of EGFR and STAT3 signaling path-ways. The combined effects of LMP1 on EGFR and STAT3 likely regulate the transcription of many cellular genes. Impor-tantly, this study has identified PKC␦as the likely serine kinase of STAT3, as well as the upstream effector of ERK and EGFR activation mediated by LMP1-CTAR1 (Fig. 7). The ability of PKC␦ inhibitor rottlerin and PKC␦ DN to inhibit LMP1-CTAR1-induced transformation points to the importance of this kinase in LMP1-mediated oncogenesis. The further study of the effects of LMP1 on EGFR, PKC␦, and STAT3 will likely increase our understanding of the mechanisms through which EBV contributes to oncogenesis.
ACKNOWLEDGMENTS
We thank H. Shelton Earp for providing EGFR rabbit anti-serum.
This work was supported by NIH grants CA32979 and CA19014 to N.R.-T., and D.G.M. was supported by training grant T32CA009156.
REFERENCES
1.Bowman, T., R. Garcia, J. Turkson, and R. Jove.2000. STATs in oncogen-esis. Oncogene19:2474–2488.
2.Buettner, M., N. Heussinger, and G. Niedobitek. 2006. Expression of Epstein-Barr virus (EBV)-encoded latent membrane proteins and STAT3 activation in nasopharyngeal carcinoma. Virchows Arch.449:513–519. 3.Charalambous, C. T., A. Hannigan, P. Tsimbouri, G. M. McPhee, and J. B.
Wilson.2007. Latent membrane protein 1-induced EGFR signaling is neg-atively regulated by TGF alpha prior to neoplasia. Carcinogenesis28:1839– 1848.
4.Chen, H., L. Hutt-Fletcher, L. Cao, and S. D. Hayward.2003. A positive autoregulatory loop of LMP1 expression and STAT activation in epithelial cells latently infected with Epstein-Barr virus. J. Virol.77:4139–4148. 5.Decker, T., and P. Kovarik.2000. Serine phosphorylation of STATs.
Onco-gene19:2628–2637.
6.Eliopoulos, A. G., S. M. Blake, J. E. Floettmann, M. Rowe, and L. S. Young. 1999. Epstein-Barr virus-encoded latent membrane protein 1 activates the JNK pathway through its extreme C terminus via a mechanism involving TRADD and TRAF2. J. Virol.73:1023–1035.
7.Eliopoulos, A. G., and L. S. Young.1998. Activation of the cJun N-terminal kinase (JNK) pathway by the Epstein-Barr virus-encoded latent membrane protein 1 (LMP1). Oncogene16:1731–1742.
8.Endo, K., et al.2009. Phosphorylated ezrin is associated with EBV latent membrane protein 1 in nasopharyngeal carcinoma and induces cell migra-tion. Oncogene28:1725–1735.
9.Everly, D. N., Jr., B. A. Mainou, and N. Raab-Traub.2004. Induction of Id1 and Id3 by latent membrane protein 1 of Epstein-Barr virus and regulation of p27/Kip and cyclin-dependent kinase 2 in rodent fibroblast transforma-tion. J. Virol.78:13470–13478.
10.Fries, K. L., W. E. Miller, and N. Raab-Traub.1996. Epstein-Barr virus latent membrane protein 1 blocks p53-mediated apoptosis through the in-duction of the A20 gene. J. Virol.70:8653–8659.
11.Gartsbein, M., et al.2006. The role of protein kinase C delta activation and STAT3 Ser727 phosphorylation in insulin-induced keratinocyte prolifera-tion. J. Cell Sci.119:470–481.
12.Gires, O., et al.1999. Latent membrane protein 1 of Epstein-Barr virus interacts with JAK3 and activates STAT proteins. EMBO J.18:3064–3073. 13.Higuchi, M., E. Kieff, and K. M. Izumi.2002. The Epstein-Barr virus latent membrane protein 1 putative Janus kinase 3 (JAK3) binding domain does not mediate JAK3 association or activation in B-lymphoma or lymphoblas-toid cell lines. J. Virol.76:455–459.
14.Horikawa, T., et al.2007. Twist and epithelial-mesenchymal transition are induced by the EBV oncoprotein latent membrane protein 1 and are asso-ciated with metastatic nasopharyngeal carcinoma. Cancer Res.67:1970– 1978.
15.Hsieh, H. L., C. C. Sun, T. S. Wang, and C. M. Yang.2008. PKC-␦ /c-Src-mediated EGF receptor transactivation regulates thrombin-induced COX-2 expression and PGE2 production in rat vascular smooth muscle cells. Biochim. Biophys. Acta1783:1563–1575.
16.Izumi, K. M., K. M. Kaye, and E. D. Kieff.1997. The Epstein-Barr virus LMP1 amino acid sequence that engages tumor necrosis factor receptor associated factors is critical for primary B lymphocyte growth transforma-tion. Proc. Natl. Acad. Sci. U. S. A.94:1447–1452.
17.Jackson, D. N., and D. A. Foster.2004. The enigmatic protein kinase Cdelta: complex roles in cell proliferation and survival. FASEB J.18:627–636. 18.Jorissen, R. N., et al.2003. Epidermal growth factor receptor: mechanisms of
activation and signalling. Exp. Cell Res.284:31–53.
19.Kaye, K. M., et al.1999. An Epstein-Barr virus that expresses only the first 231 LMP1 amino acids efficiently initiates primary B-lymphocyte growth transformation. J. Virol.73:10525–10530.
20.Kim, D. J., K. S. Chan, S. Sano, and J. Digiovanni.2007. Signal transducer and activator of transcription 3 (Stat3) in epithelial carcinogenesis. Mol. Carcinog.46:725–731.
21.Kung, C. P., and N. Raab-Traub.2008. Epstein-Barr virus latent membrane protein 1 induces expression of the epidermal growth factor receptor through effects on Bcl-3 and STAT3. J. Virol.82:5486–5493.
22.Kung, C. P., and N. Raab-Traub.2010. Epstein-Barr virus latent membrane protein 1 modulates distinctive NF-B pathways through C-terminus-acti-vating region 1 to regulate epidermal growth factor receptor expression. J. Virol.84:6605–6614.
23.Lo, H. W., et al.2007. Epidermal growth factor receptor cooperates with signal transducer and activator of transcription 3 to induce epithelial-mes-enchymal transition in cancer cells via up-regulation of TWIST gene expres-sion. Cancer Res.67:9066–9076.
24.Luftig, M., et al.2004. Epstein-Barr virus latent infection membrane protein 1 TRAF-binding site induces NIK/IKK alpha-dependent noncanonical NF-kappaB activation. Proc. Natl. Acad. Sci. U. S. A.101:141–146.
25.Lui, V. W., et al.2009. STAT3 activation contributes directly to Epstein-Barr virus-mediated invasiveness of nasopharyngeal cancer cells in vitro. Int. J. Cancer125:1884–1893.
26.Lui, V. W., et al.2009. Cucurbitacin I elicits anoikis sensitization, inhibits cellular invasion and in vivo tumor formation ability of nasopharyngeal carcinoma cells. Carcinogenesis30:2085–2094.
27.Luo, W., et al.2008. Epstein-Barr virus latent membrane protein 1 mediates serine 25 phosphorylation and nuclear entry of annexin A2 via PI-PLC-PKCalpha/PKCbeta pathway. Mol. Carcinog.47:934–946.
28.Mainou, B. A., D. N. Everly, Jr., and N. Raab-Traub.2005. Epstein-Barr virus latent membrane protein 1 CTAR1 mediates rodent and human fibro-blast transformation through activation of PI3K. Oncogene24:6917–6924. 29.Mainou, B. A., D. N. Everly, Jr., and N. Raab-Traub.2007. Unique signaling
properties of CTAR1 in LMP1-mediated transformation. J. Virol.81:9680– 9692.
30.Meckes, D. G., Jr., et al.2010. Human tumor virus utilizes exosomes for intercellular communication. Proc. Natl. Acad. Sci. U. S. A. 107:20370– 20375.
31.Miller, W. E., J. L. Cheshire, and N. Raab-Traub.1998. Interaction of tumor necrosis factor receptor-associated factor signaling proteins with the latent
VOL. 85, 2011 EBV LMP1 ACTIVATES PKC␦ PATHWAYS 4407
on November 7, 2019 by guest
http://jvi.asm.org/
membrane protein 1 PXQXT motif is essential for induction of epidermal growth factor receptor expression. Mol. Cell. Biol.18:2835–2844. 32.Miller, W. E., and N. Raab-Traub.1999. The EGFR as a target for viral
oncoproteins. Trends Microbiol.7:453–458.
33.Morandell, S., T. Stasyk, S. Skvortsov, S. Ascher, and L. A. Huber.2008. Quantitative proteomics and phosphoproteomics reveal novel insights into complexity and dynamics of the EGFR signaling network. Proteomics 8:4383–4401.
34.Mosialos, G., et al.1995. The Epstein-Barr virus transforming protein LMP1 engages signaling proteins for the tumor necrosis factor receptor family. Cell 80:389–399.
35.Mueller, K. L., L. A. Hunter, S. P. Ethier, and J. L. Boerner.2008. Met and c-Src cooperate to compensate for loss of epidermal growth factor receptor kinase activity in breast cancer cells. Cancer Res.68:3314–3322.
36.Paine, E., R. I. Scheinman, A. S. Baldwin, Jr., and N. Raab-Traub.1995. Expression of LMP1 in epithelial cells leads to the activation of a select subset of NF-kappa B/Rel family proteins. J. Virol.69:4572–4576. 37.Park, O. K., T. S. Schaefer, and D. Nathans.1996. In vitro activation of Stat3
by epidermal growth factor receptor kinase. Proc. Natl. Acad. Sci. U. S. A. 93:13704–13708.
38.Raab-Traub, N.2009. Epstein-Barr virus transforming proteins: biologic properties and contribution to oncogenesis. p. 259-284InB. Damania and J. M. Pipas (ed.), DNA tumor viruses. Springer, New York, NY. 39.Roberts, M. L., and N. R. Cooper.1998. Activation of a
ras-MAPK-depen-dent pathway by Epstein-Barr virus latent membrane protein 1 is essential for cellular transformation. Virology240:93–99.
40.Shair, K. H., et al.2007. EBV latent membrane protein 1 activates Akt, NFkappaB, and Stat3 in B cell lymphomas. PLoS Pathog.3:e166.
41.Shair, K. H., C. I. Schnegg, and N. Raab-Traub.2008. EBV latent membrane protein 1 effects on plakoglobin, cell growth, and migration. Cancer Res. 68:6997–7005.
42.Snyder, M., X. Y. Huang, and J. J. Zhang.2008. Identification of novel direct Stat3 target genes for control of growth and differentiation. J. Biol. Chem. 283:3791–3798.
43.Soh, J. W., and I. B. Weinstein.2003. Roles of specific isoforms of protein kinase C in the transcriptional control of cyclin D1 and related genes. J. Biol. Chem.278:34709–34716.
44.Soni, V., E. Cahir-McFarland, and E. Kieff.2007. LMP1 TRAFficking acti-vates growth and survival pathways. Adv. Exp. Med. Biol.597:173–187. 45.Storz, P., H. Do¨ppler, and A. Toker.2004. Protein kinase Cdelta selectively
regulates protein kinase D-dependent activation of NF-kappaB in oxidative stress signaling. Mol. Cell. Biol.24:2614–2626.
46.Thornburg, N. J., and N. Raab-Traub.2007. Induction of epidermal growth factor receptor expression by Epstein-Barr virus latent membrane protein 1 C-terminal-activating region 1 is mediated by NF-kappaB p50 homodimer/ Bcl-3 complexes. J. Virol.81:12954–12961.
47.Wang, D., D. Liebowitz, and E. Kieff.1985. An EBV membrane protein expressed in immortalized lymphocytes transforms established rodent cells. Cell43:831–840.
48.Zheng, X., L. Hu, F. Chen, and B. Christensson.1994. Expression of Ki67 antigen, epidermal growth factor receptor and Epstein-Barr virus-encoded latent membrane protein (LMP1) in nasopharyngeal carcinoma. Eur. J. Cancer B Oral Oncol.30B:290–295.
49.Zhu, X. F., et al.2001. EGFR tyrosine kinase inhibitor AG1478 inhibits cell proliferation and arrests cell cycle in nasopharyngeal carcinoma cells. Cancer Lett.169:27–32.