
The distribution of wind loads and vulnerability of metal clad roofing structures in contemporary Australian houses
203
0
0
Full text
(2) The Distribution of Wind Loads and Vulnerability of Metal Clad Roofing Structures in Contemporary Australian Houses. Thesis submitted by Nandana Chana JAYASINGHE BSc (Hons) in January 2012. For the degree of Doctor of Philosophy in School of Engineering and Physical Sciences James Cook University Townsville.
(3) Statement of access. I, the undersigned, the author of this thesis, understand that James Cook University will make it available for use within the University Library and via the Australian Digital thesis network for use elsewhere. I understand that as an unpublished work a thesis has significant protection under the Copyright act and I do not wish to place restriction on access to this work.. ......................................... ........................................... Nandana Chana Jayasinghe. Date. Page 2 of 202.
(4) Statement of sources. I declare that this thesis is my work and has not been submitted for another degree or diploma at any university or other institution of tertiary education. Information derived from published or unpublished work of others has been acknowledged in the text and a list of references is given.. ......................................... ........................................... Nandana Chana Jayasinghe. Date. Page 3 of 202.
(5) Statement on the contribution of others. Grants: This research was mainly supported by Cyclone Testing Station (CTS) at James Cook University, Townsville and additional funding was received from the School of Engineering and Physical Sciences, James Cook University (JCU), Townsville.. Supervision: A/Prof. J.D Ginger (JCU) principal supervisor for this research. Other supervision was provided by Dr. D.J Henderson (JCU) and Prof. G.R Walker (JCU).. Editorial Assistance: The editorial assistance for this thesis was provided by A/Prof. J.D Ginger, Dr. D.J Henderson and Prof. G.R Walker from James Cook University, Townsville.. Software: Mr. Martin Wehner from Geosciences Australia provided the software, VAWS and did additional coding whenever necessary to incorporate output results from this study.. Page 4 of 202.
(6) Acknowledgements First and foremost, I would like to express my sincere gratitude to my Principal supervisor A/Prof. John Ginger for his excellent guidance, technical expertise and continuous support throughout this research. I also thank my Co-Supervisors Dr. David Henderson and Prof. George Walker for their guidance and valuable inputs to this work. I am grateful to these supervisors for the education, direction, encouragement and examples they have provided. The research was supported by Cyclone Testing Station (JCU) and School of Engineering and Physical Sciences (JCU). This support is gratefully acknowledged. I also would like to thank staff and the technicians of Cyclone Testing Station for their support, assistance and advice. Specially, I would like to thank Mr. Stu Peterson for his support for setting up and assisting with conducting the structural tests. I gratefully acknowledge the engineering workshop technician, Mr. Curt Arrowsmith for his support on constructing the wind tunnel model and Mr. Peter Kim for assisting me on doing the wind tunnel experiments. Finally, I would like to thank my friends and family for their steady support and encouragement. I‘m especially grateful to my wife, Susanthi, for helping me and keeping my life in proper perspective and balance.. Page 5 of 202.
(7) Abstract Windstorms cause most of the damage to houses, worldwide. The roof is subjected to the largest wind loads and is usually the most vulnerable part of the house. However, data on the transfer of wind loads within the roof structure is scarce. Such data is required for the application of structural reliability analysis and for development of building codes. The fluctuating nature and variable distribution of wind loads, combined with the change from linear to non-linear structural behaviour as the loads increase, can pose challenges for calculating structural response. This is also required for developing the performance based design of structures and for understanding wind load transfer within the roof structure and the effect of progressive failure on the sharing and redistribution of loads. Most vulnerability models do not accurately incorporate the structural behaviour of the houses during windstorms, which may produce unreliable estimates of damage. These vulnerability models have mainly focused on the wind loads acting on the connection tributary area and the strength of the connections. This research study analysed the transmission of wind loads within a commonly used roof structural system of contemporary houses obtained from a survey in the cyclonic region of Australia. The distribution of wind pressure on the roof of such a typical house was determined using a wind tunnel model. The wind loads on selected roof fixings were further analysed to obtain the wind load data in terms of probabilistic parameters. The strength capacities of the roofing connection were also determined in terms of probabilistic parameters using available test data. The structural response of a roof was studied by testing sub-assemblies of the roof applying point and line loads and measuring the reactions at batten-to-truss connections and the deflections at selected locations in a range of conditions and damage states to simulated loads. The results were also compared with analytical solutions. The variation of reactions with increasing load was discussed in terms of a reaction coefficient. The coefficients were assessed for loads in the linear and non-linear states of roofing components/connections. The study integrated the wind loading and structural information on transfer of wind load effects through the structure to determine the loads and vulnerability of batten-to-truss connections. These Page 6 of 202.
(8) outputs were compared with the results obtained from conventional methods for calculating load on connections and vulnerability assessments. The study found that loads on the batten-to-truss connection of these contemporary houses are influenced by the flexibility of the battens and cladding, and the directional stiffness characteristics of the cladding, as is the redistribution of batten-to-truss connection loads following failure of the cladding fastener and batten-to-truss connections. As a result estimates based on application of pressures to connection tributary area, which is the normal design practice, can lead to underestimation of the connection loads. The study shows that a larger tributary area should be considered to obtain the batten-to-truss connection loads on these structural systems. Furthermore, the study shows that estimates of the vulnerability of a battento-truss connection based on the incorporation of load distribution effects in the reliability analysis are greater than those obtained from the methods used in current practice. Hence, the study suggests that load sharing effects must be incorporated when determining the vulnerability of connections. The vulnerability estimates on cladding fixings and truss-to-wall connections were also determined and the results show that the cladding fixings are the most vulnerable and then batten-to-truss connections and truss-to-wall connections respectively. A main outcome of the thesis is the establishment of an improved procedure for analysing the variation of the connection loads with time taking account of the spatial and temporal variation in wind pressures and the structural response characteristics of the roof system, which is a necessary first step in the assessment of their vulnerability. These outcomes make a significant contribution to understanding the wind loading distribution and developing vulnerability functions for houses to windstorms. The results can also be used to assess the system reliability for a well defined limit state and hence can contribute significantly to performance based evaluation of masonry block houses in cyclonic regions. The results could also be used as a basis to study adaptation measures and for the development of software models for assessing building vulnerability to windstorms.. Page 7 of 202.
(9) TABLE OF CONTENTS. 1 INTRODUCTION ............................................................................................................ 14 1.1. Background ............................................................................................................. 14. 1.2. Objectives................................................................................................................ 19. 1.3. Thesis outline .......................................................................................................... 19. 2 LITERATURE REVIEW ................................................................................................. 21 2.1. International studies on residential construction subjected to windstorms ............. 21. 2.2. Damage to Australian houses from windstorms ..................................................... 21. 2.2.1. Structural Reliability ....................................................................................... 23. 2.3. Wind loads on houses.............................................................................................. 24. 2.4. Strength capacity of connections ............................................................................ 28. 2.5. Wind related full scale housing and sub assembly testing ...................................... 30. 2.6. Vulnerability studies based on engineering approach outside Australia ................. 34. 2.6.1. Damage prediction models .............................................................................. 36. 2.7. Vulnerability studies in Australia ............................................................................ 39. 2.8. Summary and Discussion ........................................................................................ 43. 3 ROOF STRUCTURE OF A CONTEMPORARY HOUSE AND ANALYSIS METHODS ....................................................................................................................... 46 3.1. Masonry Block House ............................................................................................. 46. 3.2. Roofing connections................................................................................................ 48. 3.2.1 3.3. Design of houses ..................................................................................................... 51. 3.3.1 3.4. Connection Strengths ...................................................................................... 49 Design approach for wind loads ...................................................................... 51. Reliability theory ..................................................................................................... 53. 3.4.1. Dead load ........................................................................................................ 54. 3.5. Wind load probabilistic model ................................................................................ 54. 3.6. Summary and Discussion ........................................................................................ 55. 4 WIND LOADING ............................................................................................................ 57 4.1. Experimental setup .................................................................................................. 57. 4.2. Experimental results ................................................................................................ 61. 4.2.1. Pressure distribution-cladding ......................................................................... 61. 4.2.2. Pressure distribution-Battens........................................................................... 64. 4.3. Probability distributions .......................................................................................... 66. 4.4. Structural Load effects on Trusses .......................................................................... 68. 4.5. Summary and Discussion ........................................................................................ 71. 5 STRUCTURAL TESTING AND RESPONSE ................................................................ 73 5.1. Load sharing and progressive failure ...................................................................... 73. 5.2. Experimental set up # 1 ........................................................................................... 74 Page 8 of 202.
(10) 5.2.1. Test procedure ................................................................................................. 76. 5.2.2. Elastic range tests ............................................................................................ 77. 5.2.3. Loading until failure ........................................................................................ 79. 5.2.4. Analytical model ............................................................................................. 80. 5.2.5. Results and Discussion .................................................................................... 80. 5.3. Experimental test set up # 2 .................................................................................... 94. 5.3.1 5.4. Results and Discussions for Test Set up #2 ..................................................... 96. Summary and Discussion ...................................................................................... 114. 6 VULNERABILITY OF THE ROOF SYSTEM ............................................................. 116 6.1. Load distribution on Roof system ......................................................................... 116. 6.2. The effect of cladding fastener failure .................................................................. 126. 6.3. The effect of batten-to-truss connection failure .................................................... 127. 6.4. Reliability Analysis ............................................................................................... 128. 6.5. Summary and Discussion ...................................................................................... 138. 7 CONCLUSIONS AND RECOMMENDATIONS ......................................................... 140 7.1. Conclusions ........................................................................................................... 140. 7.2. Recommendations ................................................................................................. 144. 8 REFERENCES ............................................................................................................... 147 APPENDIX A ...................................................................................................................... 154 APPENDIX B- Test Matrix ................................................................................................. 158 APPENDIX C ...................................................................................................................... 187 APPENDIX D- Vulnerability and Adaptation to Wind Simulation (VAWS) ..................... 195. Page 9 of 202.
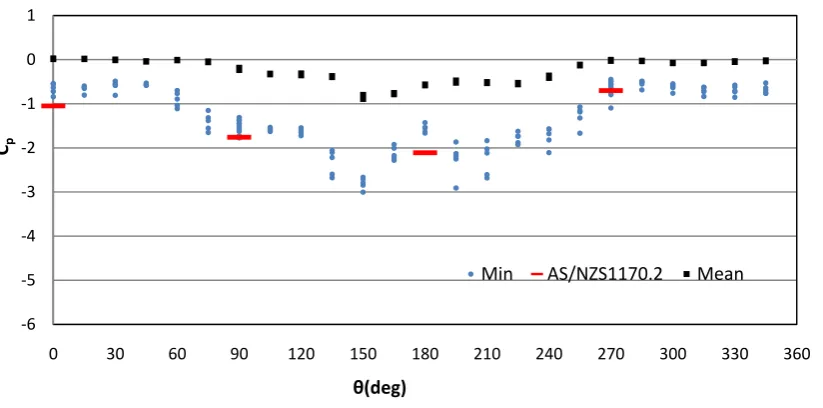
(11) LIST OF FIGURES Figure 1.1: Damaged house from Brisbane thunderstorm (Leitch et al. (2010)) ........................ 14 Figure 1.2: Building damage in Cyclone Larry (Henderson et al. (2006)) ................................. 14 Figure 1.3: Completed Masonry Block house ............................................................................. 16 Figure 1.4: Schematic diagram of a Masonry Block House ....................................................... 17 Figure 2.1: Change in Lateral response with addition of elements ............................................. 31 Figure 2.2: Test house at UWO (Morrison and Kopp (2009)) .................................................... 33 Figure 2.3: 1/3 scale model building (Mensah et al. (2011)) ...................................................... 34 Figure 2.4: Roof panel fragility of two typical houses (Exposure B(ASCE 7-05)) .................... 36 Figure 2.5: Vulnerability curves for masonry buildings in central Florida (Pinelli et al. (2008)) ..................................................................................................................................... 38 Figure 2.6: Components of the vulnerability for a masonry medium strength structure (Pinelli et al. (2008)) .................................................................................................................... 38 Figure 2.7: Reference curves for heuristic ranking process by expert group engaged through workshop activity, N and C classification according to AS 4055(2006) (Geoscience Australia (2007)).......................................................................................................... 41 Figure 2.8: Estimated probability of failure of components in the modelled houses (Henderson and Ginger (2007)) ...................................................................................................... 42 Figure 3.1: Masonry Block house under construction (Hip roof shape) ..................................... 47 Figure 3.2: Battens and trusses in Masonry block house ............................................................ 48 Figure 3.3: Truss-to-wall connection .......................................................................................... 49 Figure 3.4: Batten-to-truss connection ........................................................................................ 49 Figure 3.5: Roof cladding-to-batten connections ........................................................................ 49 Figure 4.1: Mean velocity profile................................................................................................ 57 Figure 4.2: Turbulence intensity profile...................................................................................... 58 Figure 4.3: Pressure tap layout .................................................................................................... 59 Figure 4.4: 10m x 19.8m x 2.7m gable end low rise house with 22.5°roof pitch ....................... 60 Figure 4.5: 1/50 scale model of the 10m x 19.8m x 2.7m house in the wind tunnel................... 60 Figure 4.6: Pressure coefficients vs wind direction – P (cladding) ............................................. 63 Figure 4.7: Pressure coefficients vs wind direction - Q (cladding) ............................................. 63 Figure 4.8: Pressure coefficients vs wind direction - T (cladding) ............................................. 64 Figure 4.9: Pressure coefficients (. ) vs wind direction – Batten-to-truss connection B2 ........ 65. Figure 4.10: Pressure coefficients (. ) vs wind direction – Batten-to-truss connection B7 ...... 65. Figure 4.11: Pressure coefficients (. ) vs wind direction – Batten-to-truss connection F5 ....... 66. Figure 4.12: Schematic diagram of roof truss showing batten to truss connection patches and truss to wall reaction forces ......................................................................................... 68 Page 10 of 202.
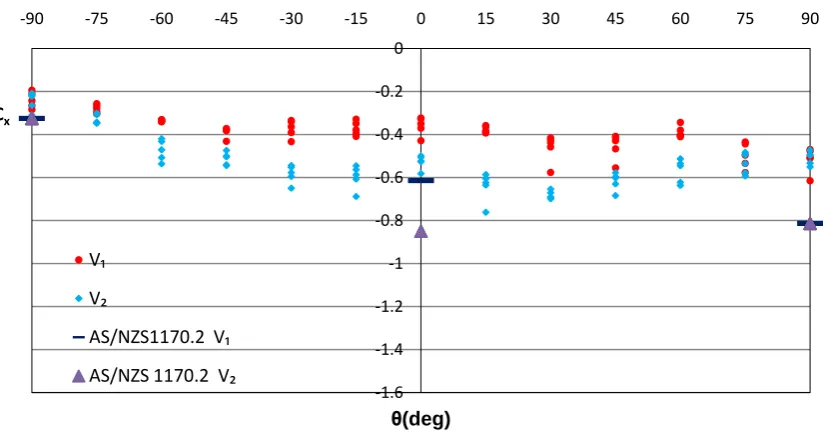
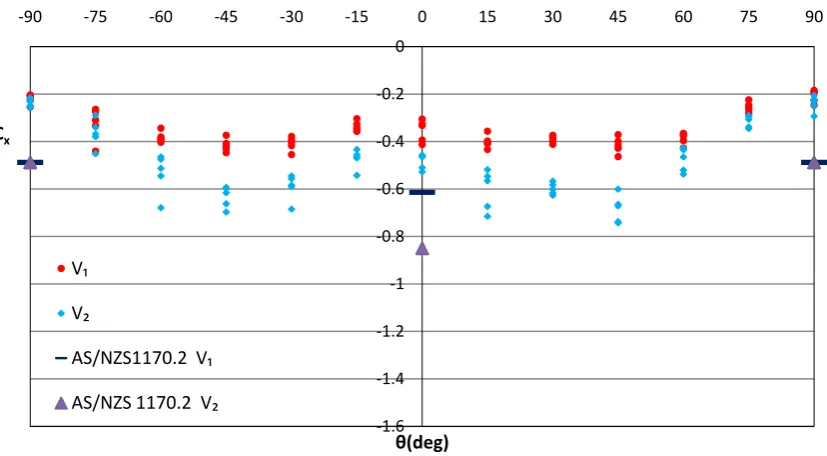
(12) Figure 4.13:. V1. and. V2 vs. wind approach angles -Truss B ..................................................... 70. Figure 4.14:. V1. and. V2 vs. wind approach angles -Truss F ...................................................... 70. Figure 4.15:. V1. and. V2 vs. wind approach angles -Truss L ..................................................... 71. Figure 5.1: Schematic diagram of the test set up #1 (all dimensions are in mm) ....................... 75 Figure 5.2: Test set up #1 before fixing the cladding.................................................................. 75 Figure 5.3: Batten-to-truss connection with load cell ................................................................. 76 Figure 5.4: Dummy load cell ...................................................................................................... 76 Figure 5.5: Test set up with cladding fixed ................................................................................. 76 Figure 5.6: Load application to the bottom surface of cladding with a foam mould and jack .... 77 Figure 5.7: Load application to batten and deflection measurement .......................................... 78 Figure 5.8: Line loads applied along a line over spacing between trusses .................................. 79 Figure 5.9: SPACEGASS 3D model of the test setup #1............................................................ 80 Figure 5.10: Reaction coefficient at b2, R1(C b2, R1) for point load on batten b2 ........................ 82 Figure 5.11: Deflection of batten b2 for load at (b2, 2) .............................................................. 82 Figure 5.12: Reaction coefficient, C b2, R1, for point load on batten b2 ....................................... 83 Figure 5.13: The effect of cladding on reaction coefficient, C b2, R1............................................ 84 Figure 5.14: Reaction coefficient, Cb2, R2 with point loads along W, X and Y ............................ 86 Figure 5.15: C b2, R2 for point load on X on Panels P6 and P10................................................... 87 Figure 5.16: Reaction coefficients for loading at centre of Panel 6 until failure of fasteners ..... 89 Figure 5.17: Application of point load showing a cladding fastener failure (pulling out of batten) .......................................................................................................................... 90 Figure 5.18: Plastic deformation of cladding around fasteners ................................................... 91 Figure 5.19: Deflections at selected positions with the applied load along line X of P10 .......... 91 Figure 5.20: Reaction coefficient for a line load on P13 along line X ........................................ 92 Figure 5.21: Line load on P13, X until failure of cladding fasteners .......................................... 93 Figure 5.22: Deflection with the applied load on P13 along line X ............................................ 94 Figure 5.23: Schematic diagram of the Test Set up #2 ............................................................... 95 Figure 5.24: Schematic diagram of the connections studied ..................................................... 100 Figure 5.25: Reaction coefficients of adjacent connections when b2, R2 Failed ..................... 102 Figure 5.26: Reaction coefficients on connections for equal loads applied on P1, P2, P4 and P5 ................................................................................................................................... 102 Figure 5.27: Reaction coefficients on connections when b2, R2 failed for equal loads applied on P1, P2, P4 and P5....................................................................................................... 103 Figure 5.28: Batten-to-Truss connection with one screw connection removed ........................ 104 Figure 5.29: Reaction coefficients for a partial failure of the connection b2, R2 for equal loads applied on P1, P2, P4 and P5 ..................................................................................... 105 Figure 5.30: A connection with loose screws ........................................................................... 106 Page 11 of 202.
(13) Figure 5.31: Applied load on batten-to-truss connection .......................................................... 108 Figure 5.32: Reaction coefficients for total applied load on (b2, R2) ....................................... 109 Figure 5.33: Deflection measurement ....................................................................................... 110 Figure 5.34: The applied load vs deflection at (b2, R2) ............................................................ 110 Figure 5.35: Plastic deformation of a batten-to-truss connection ............................................. 111 Figure 5.36: Applied load vs Deflection on connection (b2, R2) ............................................. 111 Figure 5.37: Failure of the connection (b2, R2) ........................................................................ 112 Figure 5.38: Variation of reaction coefficients with the applied load ....................................... 113 Figure 5.39: Variation of deflections with the applied load ...................................................... 113 Figure 6.1: Schematic Diagram of connections considered ...................................................... 117 Figure 6.2: Conventional method #1-Tributary area for connection B7 ................................... 118 Figure 6.3: Conventional method #2-Tributary area for connection B7 ................................... 119 Figure 6.4: Proposed method - Tributary area for connection B7............................................. 119 Figure 6.5: Variation of Figure 6.6:. at B7 with the wind approach direction ..................................... 122. for undamaged system for θ =150° ................................................................ 123. Figure 6.7: Pressure distribution around B7-Proposed method ................................................ 124 Figure 6.8: Pressure distribution around B7-Conventional Method #1 .................................... 124 Figure 6.9: Pressure distribution around B7-Conventional Method #2 .................................... 124 Figure 6.10:. for undamaged system for θ =90° ................................................................ 125. Figure 6.11: Failure of a cladding fastener ............................................................................... 126 Figure 6.12: Load distribution-Undamaged system .................................................................. 128 Figure 6.13: Load distribution-B7 failed .................................................................................. 128 Figure 6.14: Vulnerability of batten connections for θ=150° in TC 2.5 ................................... 130 Figure 6.15: Vulnerability of batten truss connections for θ=150° in TC 2.5 ........................... 130 Figure 6.16: Vulnerability of batten connections for θ=150° in TC 2.5 ................................... 132 Figure 6.17: Vulnerability of batten truss connections for θ=150° in TC 2.5 ........................... 132 Figure 6.18: Probability of batten-to-truss connection failure vs wind speed following the failure of B7 in TC 2.5- internal pressure coefficient- 0 ........................................... 133 Figure 6.19: The effect of factors in Eqn 3.14 on batten-to-truss connection vulnerability for θ=150° in TC 2.5- internal pressure coefficient- +0.7 ............................................... 135 Figure 6.20: Typical contemporary house (i.e. Figure 4.4) ....................................................... 136 Figure 6.21: Probability of failure vs Basic Wind speed- Cladding connections for house in TC 2.5- internal pressure coefficient- +0.7 ...................................................................... 137 Figure 6.22: Probability of failure vs Basic Wind speed-Truss-to-wall connections for house in TC 2.5- internal pressure coefficient- +0.7 ................................................................ 137. Page 12 of 202.
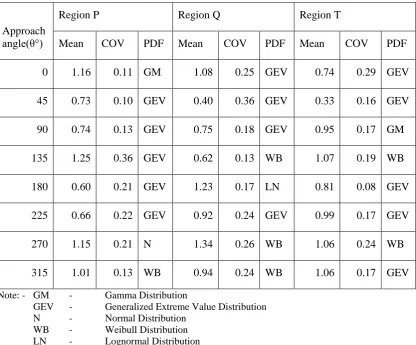
(14) LIST OF TABLES Table 3.1: Characteristics of Masonry block Houses .................................................................. 47 Table 3.2: Connection Capacity Statistics .................................................................................. 50 Table 4.1: The probabilistic distribution of peak pressure (. on cladding fixings at P, Q. and T regions .......................................................................................................... 67 Table 5.1: Comparison of reaction coefficients from line loads with point loads ...................... 88 Table 5.2: Reaction coefficients of selected connections for load applied at P1 to P9 ............... 96 Table 5.3: Deflection at selected panels for line load application on panels .............................. 97 Table 5.4: Comparison of reaction coefficients for line loads applied in test set up #1 and #2 .. 98 Table 5.5: Comparison of deflections in Test set up #1 and #2 .................................................. 99 Table 5.6: Reaction coefficients for removing both screws in selected connections ................ 100 Table 5.7: Reaction coefficients for removing screw ‗I‘ of selected connections .................... 105 Table 5.8: Reaction coefficients for loosening both screws on selected connections ............... 107 Table 6.1:. for θ =150°- Undamaged roof using load distribution effects ......................... 121. Table 6.2:. for θ =150°- Undamaged roof using conventional method #1 ......................... 122. Table 6.3:. for θ =150°- Undamaged roof using conventional method #2 ......................... 122. Table 6.4:. for θ =150°- Cladding fastener failure (between B7 and C7) .......................... 127. Table 6.5:. for θ =150°- Batten-to-truss connection B7 failed ........................................... 128. Table 6.6: Statistical parameters for normalized values ........................................................... 134. Page 13 of 202.
(15) 1. INTRODUCTION. 1.1 Background Residential housing is the largest single asset for many people, and overall forms a very large proportion of the social investment in the community. These houses need to be protected against hazards with the potential to cause large scale disasters. Windstorms are generally recognized as the natural hazard that causes most of the damage to buildings in Australia. Windstorms can broadly be classified according to their meteorological parameters as, tropical cyclones, thunderstorms, tornados and gales. Thunderstorms and tornados are short-lived local events with their influence affecting distances of tens of kilometres. Cyclones generally impact coastal regions in the tropics, and can extend hundreds of kilometres, therefore having the potential to cause widespread damage. Windstorms such as Cyclone Tracy (Walker (1975)), Cyclone Winifred (Reardon et al. (1986)), Cyclone Larry (Henderson et al. (2006)), Cyclone Yasi (Boughton et al. (2011)) and Brisbane Thunderstorm (Leitch et al. (2010)) have caused significant damage to the structures in Australia. Figures 1.1 and 1.2 show damaged houses from such events. There has been a significant reduction in the level of damage to houses in recent times due to the improvements in design and construction of domestic/residential houses (Boughton et al. (2011)).. Figure 1.1: Damaged house from Brisbane thunderstorm (Leitch et al. (2010)). Figure 1.2: Building damage in Cyclone Larry (Henderson et al. (2006)). Page 14 of 202.
(16) However, increasing concentration of population and the potential effects of climate change on the frequency and magnitude of windstorms may result in an increased risk to housing. If the nature of the disaster risks is to be fully understood and cost effective measures taken to mitigate them, it is important to have a better understanding of the structural response of houses to wind loading. Full scale and wind tunnel model studies on houses reveal that the roof is subjected to large wind loads and post-damage surveys show that the roofing components are the most vulnerable part of a house to windstorms. Damage surveys (Walker (1975)) and full scale test data from the Cyclone Testing Station (Boughton and Reardon (1982, 1983, 1984)) have shown that the typical modes of roofing failure of houses to wind loading are associated with the strength capacity of the joints between components being exceeded. There are a range of house types in Australia with differences in size, shape, potential openings in envelope, cladding, roof shape and pitch, method of construction, structural system and age. The resistance of a house structure to wind loading depends on the effect of these features on the wind loads experienced and the strength of its components and connections. The roof of these houses consists of roof cladding, battens and roof trusses/rafters. The roof cladding is usually metal sheeting or roof tiles that are fixed to timber or metal ―top hat‖ battens. The trusses or rafters are usually timber in residential construction. The assessment of the vulnerability of these houses to windstorms requires knowledge of the loads and component strength and uncertainties associated with load actions and building response. The vulnerability in this research is defined as the susceptibility of structural failure to wind loads, and failure is defined as the state where the structure is unable to resist the applied load. These uncertainties are due to the variability of factors that are inherent to wind loads and component resistance, and inadequate knowledge resulting in incorrect assumptions and analysis methods. These uncertainties can be accounted for, when analysing a structural system by specifying the load action and building response in probabilistic terms. An important. Page 15 of 202.
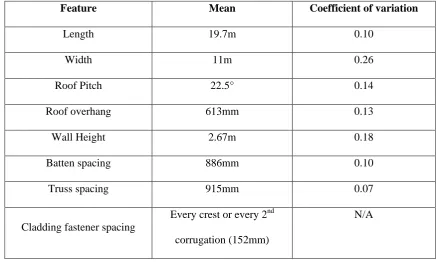
(17) component of this process is to obtain an accurate representation of the wind load transmitted through the structure of a house. Contemporary houses in cyclonic regions of Australia are typically built on a concrete slab on ground with masonry block walls, timber roof trusses, metal top hat battens and corrugated metal roof claddings. These houses have predominantly either gable or hip roofs or a combination of these. Figure 1.3 shows a masonry block house with a metal clad gable end roof and Figure 1.4 shows a schematic diagram of a typical masonry block house. The approach wind flow generates spatially and temporally varying pressure on the roof. These loads depend on the approach wind direction and also the terrain and topographic features. There have been many studies of wind pressures on roofs covering a large range of roof types, of which the studies by Holmes (1981), Reardon and Holmes (1981) and Meecham et al. (1991) are typical examples. The design wind loads on the roof given in Standards (AS/NZS 1170.2 (2011), ASCE 7-10 (2010)) are generally based on a conservative interpretation of results from such studies and are dependent on the geometry of the building. The spatial and temporal variation of wind load and the transfer of these loads to the roof structure must be determined in order to assess their vulnerability.. Figure 1.3: Completed Masonry Block house Page 16 of 202.
(18) Figure 1.4: Schematic diagram of a Masonry Block House. Wind loads acting on the roof cladding are transferred via the supporting structure and the walls to the foundation. The roof cladding-to-batten connection, batten-to-truss connection, and trussto-wall connection, are the critical parts of the load transfer path in these houses. The vulnerability assessment of these houses depends on the strength of these connections. Houses are complex structures with many load sharing components, making it difficult to quantify the resistance of each component especially as the availability of full scale data is limited. The loads applied to a house are shared by the structural and non-structural elements in a complex manner. Increasing wind speeds will result in progressive failures and possible changes to the load sharing and reactions in connections. Full scale testing provides a means of assessing the loading response and also determining the coefficients or factors for the load effects of interest. Full scale tests on complete houses, such as those by Boughton and Reardon (1982, 1983, 1984) provide quantitative data on the load sharing and interdependency between components and connections with increasing load. However, such studies have focused on the cumulative Page 17 of 202.
(19) performance of the structure and did not measure the reactions/loads of individual connections which are needed to determine the load redistribution and progressive failure. Therefore, more detailed descriptions of structural components and connections including their behaviour with increasing wind loads and quantitative analysis of load distributions are required in order to predict the overall response of roofing components during wind events. This is also required for developing performance based design of structures.. The vulnerability of houses to wind loads can be studied using the reliability method that is incorporated in design standards for structural design (Walker (2011)). Henderson and Ginger (2007) studied the vulnerability of high-set 1960‘s house with low pitch gable roof built in Northern Australia to wind speeds experienced in tropical cyclones by using reliability concepts. Studies by Rosowsky and Ellingwood (2002), Ellingwood et al. (2004), Pinelli et al. (2004), Lee and Rosowsky (2005), and Li and Ellingwood (2006) have assessed the vulnerability of residential construction in the US to wind loading using reliability methods and probability techniques. Engineering vulnerability models estimate the damage caused by wind loads of varying intensity by applying structural engineering techniques and statistical methods. The reliability theories incorporating probability theories and Monte Carlo simulation techniques are incorporated in these engineering models to assess the vulnerability.. However, most of the vulnerability models do not accurately incorporate the structural response of the house during windstorms, and hence may produce unreliable estimates of the damage. Typically these studies have focused on the wind load acting on the local tributary area and the strength of the connections. The determination of the vulnerability of roofs to wind loads requires a combination of the distribution of wind loads on a common roof structure, the connection strengths and the response of the actual roof structure to loads including load sharing and redistribution that results from progressive failure under wind loads. Such data inputs to the engineering models form an important part in determining the building vulnerability.. Page 18 of 202.
(20) 1.2 Objectives The main objective of this thesis is to determine the transmission of wind loads through roofing components, including the effect of local failures, and the impact on the overall structural performance of the roof system. Specifically, the distribution of applied loads and associated structural response of a batten-to-truss connection from contemporary houses built in cyclonic region of Australia is investigated. These objectives are met by; I.. Determining a common roof system and the structural components used in contemporary houses built in cyclonic region of Australia and their strengths.. II.. Deriving the spatial and temporal variation of wind loads acting on the roof of a common contemporary house as a function of wind direction.. III.. Studying the effect of load sharing and interdependency between components and progressive failure by conducting a series of tests on selected subassemblies of the roof system, and using structural analysis.. IV.. Determining the load distribution on selected connections using measured wind loading distributions and structural response, and then comparing the results with conventional methods of analysis.. V.. Using reliability methods to estimate failure of roofing components under wind loads and assessing the vulnerability of components on various regions of the roof.. 1.3 Thesis outline Chapter 2 reviews work carried out around the world in this research area and identifies the methods for gaining required information. The damage to houses from windstorms, wind load Page 19 of 202.
(21) on low rise houses and studies on vulnerability of houses to windstorms are discussed. The damage prediction models currently being used and developed and full scale house /sub assembly tests associated with low rise construction are also described. Chapter 3 describes the structural system including roofing components and connections of a common masonry block house based on a survey, and presents the capacities of the roof connections in terms of probabilistic parameters. The current design practices associated with the design of residential construction to wind loads and the theories used in this study to assess the vulnerability of roofing connections to windstorms are also discussed. Chapter 4 presents the wind loads over the roof of the common masonry block house obtained from a wind tunnel model study. The distribution of the wind loads and variability of these loads in probabilistic terms over selected part of the roof with the wind approach direction, are also presented. Chapter 5 presents a series of tests on full scale roof subassembly systems subjected to a range of loads and comparisons with analytical results. The progressive failure, load sharing and interdependency between components with increasing load are also studied. Chapter 6 combines the wind load measured on the wind tunnel model and the full scale roof structure response to determine the distribution of load in the roof system of contemporary houses. Vulnerability curves are derived for roofing connections on selected parts using the reliability method and probability theories. The load-response results are also incorporated in the analysis. Chapter 7 summarizes the main findings and conclusions. It also contains the discussion on results, their significance, limitations, possible ways of generating the results for more widespread application, and suggestions for future research.. Page 20 of 202.
(22) 2. LITERATURE REVIEW. Windstorms are responsible for most of the damage to houses from natural hazards, in many parts of the world. However, studies on the transmission of wind load within the roof required for quantifying the damage have been limited. Such studies provide a means of quantifying the performance of a type of house, linking it to reliability methods applied in building codes and standards. This Chapter reviews the research carried out around the world in this area and identifies methods for gaining required information.. 2.1 International studies on residential construction subjected to windstorms Windstorms such as Hurricane Hugo, Andrew, Iniki and Opal caused damages to the residential houses constructed in the US resulting in significant insurance payouts. Pielke and Pielke (1997) described that the vulnerability of society to windstorm is assessed as a combination of incidence (intensity and frequency of events) and societal exposure (people, preparedness and properties). Improving building resilience to these events reduces society‘s vulnerability. Empirical and engineering based vulnerability models have been developed in the US to assess the damage to the buildings and to improve the construction of residential houses. As described by Walker (2011), engineering based models require a large amount of detailed statistical information on the structural behaviour of buildings at component, sub-system, and whole of building level. There have been major advances in this area during last decade. The studies by Unanwa et al. (2000), Pinelli et al. (2004), Vickery et al. (2006b), Ellingwood et al. (2004), and Li and Ellingwood (2006) are some of these studies and the details are discussed later in this Chapter. The outcomes and methodologies used in these studies are important for developing vulnerability models for Australian housing. 2.2 Damage to Australian houses from windstorms The report by Geoscience Australia (2007) provides an overview of the damage sustained by residential structures from natural hazards in Australia. The report indicates that windstorms. Page 21 of 202.
(23) cause most of the damage. These events can result in major disruptions to communities, significant insurance payouts and loss of lives. Tropical cyclones Althea and Tracy impacted the Northern Australian towns of Townsville in 1971 and Darwin in 1974, respectively. Tropical Cyclone Tracy caused significant damage to domestic housing as detailed by Walker (1975) and Leicester and Reardon (1976). A major factor in the wide-spread damage was the loss of roofing materials which led to a significant loss of strength in many houses, leading to collapse and the production of a large amount of wind borne debris, causing further damage to the buildings. The roof cladding fixings in these houses proved to be inadequate with fatigue under fluctuating wind loads causing a reduction in strength. A major consequence of these events was the implementation of a nationwide requirement for housing to be structurally designed to the same codes and standards as larger buildings. The zoning of cyclone regions, fatigue failure of cladding fastener systems and increased internal pressure for housing design were the most radical impacts from cyclone Tracy on building regulations, as described by Walker (2010). This was a revolutionary change as the previous improvements in design had been based on correcting the observed weaknesses of components/connections. Evidence of the resulting improvements to housing design standards and codes in Australia is found from the comparatively better performance of newer construction in recent windstorms, such as Cyclone Larry (Henderson et al. (2006)), Cyclone Ului (Henderson et al. (2010)), Cyclone Yasi (Boughton et al. (2011)) and Brisbane Thunderstorm (Leitch et al. (2010)). These reports show that most of the damage occurred to houses built before the new standards were introduced (pre-1980‘s houses). Contemporary housing performed considerably better than older housing, reflecting marked improvement of construction detailing and better structural condition, and satisfactory performance of relevant standards (AS/NZS 1170.2 (2011) and AS 4055 (2006)). In some cases, houses that did not have appropriate fixings to account for higher wind speed caused by topography on or near hill-tops had significant damage. Overall, contemporary houses performed well by resisting the wind loads (for wind speeds that were less than the regions‘ design wind speed). Generally, these new buildings had damages mainly to. Page 22 of 202.
(24) roller doors and attachments such as guttering and fascias which have not been designed to meet requirements given in the codes. Where structural failures were observed on contemporary houses, they were associated with poor construction practice or application of incorrect site classification (i.e. low design wind speed). Breaches in the building envelope (from failed doors or windows, or debris impact) exacerbated the potential for failure from the resulting high internal pressure. Corrosion or rot of connections and framing elements initiated failures.. 2.2.1. Structural Reliability. Structural reliability forms the basis of many current design codes and standards (AS/NZS 1170.0 (2002), AS/NZS 1170.1 (2002), AS/NZS 1170.2 (2011) and ASCE 7-10 (2010)). As described by many researchers such as Thoft-Christensen and Baker (1982), Melchers (1987) and others, structural reliability theory is concerned with the rational treatment of uncertainties in structural engineering and methods for assessing the safety and serviceability of structures. Uncertainties that exist in most areas of civil and structural engineering should be taken into account so that rational decisions can be made. These methods are applied to determine the reliability against extreme events such as collapse or fracture and also the breaching of any structural engineering requirement which the structure is expected to satisfy. The basic reliability theory used is discussed in Chapter 3, where the loads and the capacities of structural components in contemporary houses are given in probabilistic terms. Current structural design codes and standards are based on concepts of limit state design, with safety checks based on structural reliability theory. These reliability concepts were applied by Galambos et al. (1982), Ellingwood et al. (1982), Leicester et al. (1985), Holmes (1985), and Pham (1985) for developing structural design standards to a limit state format (AS/NZS 1170.0 (2002), AS/NZS 1170.1 (2002), AS/NZS 1170.2 (2011) and ASCE 7-10 (2010)). The concept of a reliability index (or safety index) was used in the assessment of structural design codes. These studies defined the reliability index as a measure of evaluating uncertainty, performance and reliability of a building system subjected to loads. The studies also showed that the basic. Page 23 of 202.
(25) framework for probability based design is provided by reliability theory and the probability of failure and the reliability index can be evaluated when the probability distribution of the loads and resistances are known. Melchers (1985) and Tang and Melchers (1985) discussed the applicability of reliability theory and Monte Carlo simulation techniques for obtaining the reliability of large structural systems. Pham et al. (1983) and Holmes (1985) described a probabilistic model for wind loads to enable reliability indices to be computed for structural design. These approaches and the concepts have been used by others to assess the vulnerability of residential constructions to wind events.. 2.3 Wind loads on houses Low rise structures fall within the layer of aerodynamic roughness on the earth‘s surface. Here, turbulence intensities are high and the highest loading on the surface of a low rise building are generally the suctions on the roof, where many structural failures initiate. In the early 1970‘s, the Building Research Establishment of the United Kingdom carried out full scale measurements of wind pressures and forces on two storey houses at Aylesbury. Eaton and Mayne (1975) described an extensive full scale experiment on several two storied houses. The principal contribution to wind engineering came from this project where extensive pressure measurements were made from an isolated experimental building with a variable pitch roof. Subsequently, comparative wind tunnel experiments were conducted in many laboratories (i.e. Holmes and Best (1977), Holmes (1983), Sill et al. (1989) and Sill et al. (1992)) on 1:50 and 1:100 scale models of the Aylesbury house. Holmes (1983) found some good agreements in the full scale and model scale results, but also identified deficiencies in the full scale experiments. These comparisons also found variations in pressure coefficients measured across the laboratories. Following the Aylesbury study, full scale experiments have been conducted at Silsoe in the UK (Richardson et al. (1990)) and the Texas Tech in the US (Levitan et al. (1991)). Richardson and Surry (1991, 1992, 1994), Richardson and Blackmore (1995) and Richards and Hoxey Page 24 of 202.
(26) (2008) compared the results of full scale measurements of the Silsoe Building with wind tunnel model results and presented conclusions similar to those from the Aylesbury tests. They also found that areas of high negative pressure tended to be underestimated in wind tunnel measurements, as in the previous studies. A significant amount of data on the Texas Tech building has also been obtained and a range of analysis has been carried out by Levitan et al. (1991), Mehta et al. (1992), and Letchford et al. (1993). Wind tunnel simulations on this building have also been carried at many laboratories worldwide by Surry (1991), Cochran and Cermak (1992), Tieleman et al. (1996), Xu and Reardon (1996) and Ho et al. (2005). These studies also found that most pressure coefficients measured on the models were in close agreement with full scale pressure coefficients, but the largest negative peak coefficients at the roof edge and roof corners were under-estimated by the wind tunnel tests, as in the Aylesbury study. These studies have contributed to improvements in the wind tunnel simulation techniques, and data specified in revised codes and standards.. Wind pressures acting on the roofs of houses are dependent on their geometry and the approach wind direction. The wind pressure acting on the range of roofs given in the standards are based on many of wind tunnel model studies carried out on low rise building with hip and gable roofs having a range of slopes (Holmes (1981), Reardon and Holmes (1981), Meecham et al. (1991), Xu and Reardon (1998) and Ginger and Holmes (2005)). Meecham et al. (1991) showed that the hip roof house experiences smaller peak cladding loads compared to a gable roof of similar dimensions. Damage investigations also confirmed that hip roofs perform better than gable roofs. However, the wind resistance of roofs should be analysed based on the relationship between the pressure distribution and the underlying structural framing, implying that roof shape alone is not responsible for the performance (Meecham et al. (1991)). In addition, the spatial distribution of the pressures relative to the structural framing should be taken in to account. There is a large spatial and temporal variability of pressures, especially near windward roof corners, where the most severe wind loading and damage normally occurs. These large suction pressures are generated by the formation of conical vortices (Holmes (2007)). Several Page 25 of 202.
(27) studies have been carried out to assess the variation of wind loads on roof corners (Mehta et al. (1992) and Lin and Surry (1998)) and the influence of roof eaves (over hang) on the characteristics of pressures (Robertson (1991)).. Ho et al. (1990, 1991, 1992) investigated the effect of surrounding buildings on the wind loads on a low rise building and found that the results are considerably different from those predicted from isolated building tests and the coefficient of variation of the larger loads were 0.6 to 0.7. Furthermore, they suggested that the wind load specifications should be determined based on a reliability approach considering such a variation in wind loads. Case and Isyumov (1998) showed that a suburban exposure generates lower wind loads than those experienced in the open country exposure as suggested by others (Holmes and Best (1979) and Ho et al. (1992)).This reduction was most apparent on wall loads and roof suctions, with the reductions in local suctions may be up to 30%. Vickery et al. (2011) also conducted a range of wind tunnel experiments for hip and gable end roof buildings covering a wide range of roof slopes in open and suburban terrain conditions and compared the results with the pressure coefficient values given wind loading standard in the US, ASCE 7-10 (2010). They showed the changes in pressure coefficients in different areas of the roofs from open terrain to suburban terrain, and found that ASCE-7-10 generally underestimates the magnitude of the negative roof pressures acting on components and cladding.. Codes and standards such as AS/NZS 1170.2 (2011) give the design wind loads on parts of a building as a nominal peak design pressure based on a quasi-static pressure coefficient. The variability of the peak pressure should be taken into account, when assessing the vulnerability of components. Previous studies by Pham et al. (1983) and Holmes (1985) have investigated the probability distribution of wind pressure on buildings. They obtained the probabilistic descriptions of the normalized wind loading parameters through assumptions and wind tunnel studies. The wind loading parameters were treated as random variables with probability distributions and the product of these parameters was assumed to have a lognormal distribution.. Page 26 of 202.
(28) Li et al. (1999) also found that a Lognormal distribution compared favourably against Gumbel and Weibull. Sadek and Simiu (2002) showed that the distribution of peaks can be represented by the Extreme Value Type I (Gumbel) distribution. Holmes and Cochran (2003) used several thousand extreme pressure coefficients from repeated time history samples from a wall tap and a roof tap on a model of the Texas Tech University Test Building to determine the appropriate probability distributions for the data. They found that the Generalized Extreme Value (GEV) distribution with a small positive shape factor fits the data well. The GEV distribution is described as Type I, Type II or Type III distribution depending on the value of the shape factor (i.e. shape factor = 0, Type I, shape factor > 0, Type II and shape factor < 0, Type III). Cope et al. (2005) also fitted several probability distribution functions for different regions on the roof under different wind directions and found that the negatively skewed Type I distribution is the best fit for most of the cases considered. Li et al. (2009) studied a similar type of full scale building and found that the Type III Extreme Value Distribution matched the data measured on a roof corner. Kasperski and Hoxey (2008) also found that Type III distribution can be fitted to the full scale test data on walls of 6m × 6m × 6m cube Silsoe building. Ben Ayed et al. (2011) carried out a probabilistic approach to analyse pressure and wind load distribution on the roof of full scale house. It was shown that the pressure coefficient time series follows a three parameter Gamma distribution while the peak pressure follows a two parameter Gumbel distribution.. Structural wind load effects can be determined by incorporating influence coefficients with the wind loads on the tributary area of interest, as shown by Henderson (2010) and Jayasinghe and Ginger (2011). Holmes and Best (1981) described a method for estimating overall structural loads which takes into account the correlation of pressures on a building using a covariance matrix method. The covariance data was used to calculate structural loads such as total uplift, drag and overturning moment. Ginger et al. (2000) also used the covariance integration method to calculate structural load effects on roofing components of a gable end house. The design (or peak) load effects of interest (i.e. roof hold down force) can also be statistically analysed for a reliability assessment. Furthermore, wind loads are applied on a tributary area with the Page 27 of 202.
(29) corresponding influence effect to determine the design load effects (uplift on cladding fastener, batten-truss connection, and truss to wall connection). Kasperski and Niemann (1992) also described a methodology called LRC (Load-Response-Correlation) to estimate the wind load distribution in linear and non-linear structural behaviour.. Damage investigations such as those by Walker (1975), Henderson et al. (2006), Boughton et al. (2011) and Leitch et al. (2010) have shown that large internal pressures arising from dominant openings contributes to large load effects and damage to houses. Several studies have been carried out on this subject to determine the internal pressure characteristics on the buildings with differences in volumes, sizes of the dominant openings etc (Liu and Saathoff (1981), Vickery (1986), Holmes (1979), Ginger et al. (1997), Ginger et al. (2008) and Ginger et al. (2010)). Design internal pressure data given in standards such as AS/NZS 1170.2 (2011) are based on results from similar studies.. 2.4 Strength capacity of connections In addition to the wind loads on the roof, dead loads (i.e. self weight) and the strength (i.e. capacity) of connections need to be determined for a full reliability analysis. The dead loads are usually based on material weights. Typically, the mean to nominal dead load ratio of 1.05 with a COV of 0.10 based on the assumed weight of the roof system and other roofing materials has been specified by Ellingwood et al. (1982), Galambos et al. (1982), Holmes (1985), Pham (1985) and Rosowsky and Cheng (1999a,b). The assumed probability distribution function in US studies (Ellingwood et al. (1982), Galambos et al. (1982) and Rosowsky and Cheng (1999a,b)) was Normal while Lognormal distributions were assumed in the Australian studies (Holmes (1985), Pham (1985) and Leicester et al. (1985)). As described by Rosowsky and Cheng (1999a, b) the capacities of connections in light-frame wood construction in the US were found from engineering approaches such as individual nail capacity tests as well as non-engineering approaches (damage investigations and experience).. Page 28 of 202.
(30) These statistics on connection capacities have been used by Rosowsky and Cheng (1999a,b), Ellingwood et al. (2004), Lee and Rosowsky (2005), and Li and Ellingwood (2006) for fragility assessment of light-frame wood construction. They used the Normal probability distribution for roofing component strength characteristics. Vickery et al. (2006b) used the Lognormal distribution for sheathing panel behaviour and the Normal distribution for strap and toe nail uplift resistance in truss-to-wall connections in their study. Shanmugam et al. (2009) derived probabilistic descriptions of the capacity of connections for light-frame wood construction in the US. They derived uplift capacities for roof-to-wall connection and sheathing units from field and laboratory tests and found that the Lognormal distribution is the best fit from statistical analysis to model uplift capacities of the nail connection types considered. Lognormal distributions were used by Holmes (2007) and Henderson and Ginger (2007) in Australian studies to describe the probabilistic characteristics of the connection strengths in older houses.. The capacities of a range of components and connections of contemporary houses in Australia have been tested by Cyclone Testing Station (CTS). The CTS data-base contains the capacity of connections for new and old types of constructions subjected to static and cyclic tests based on several test regimes. The major component damage during Cyclone Tracy was caused by low cycle fatigue cracking of the cladding under the fixings which resulted in extensive loss of light gauge roof cladding (Walker (1975)). Consequently, research by Mahendran (1989, 1995), Jancauskas et al. (1994), Xu (1995a,b) and Henderson (2010) have demonstrated through extensive test programs that the interaction of the cladding and fixing is a crucial part of the cladding‘s fatigue response to the applied loading. These studies have shown that the fatigue strength of cladding connections is less than the static capacities. Similarly, the fatigue strength of the top hat battens is also less than the static capacities as shown by Fowler (2003). The strength capacity of truss-to-wall connections on contemporary houses has also been studied by Cummins (2002).. Page 29 of 202.
(31) 2.5 Wind related full scale housing and sub assembly testing The assessment of vulnerability (i.e. structural failure of connections/components) of a house type to wind loads requires on understanding of the load sharing and structural interdependency between components. The Cyclone Testing Station at James Cook University, Townsville has carried out studies on a range of full scale house types and tests on sub-assemblies of houses. Boughton and Reardon (1982) tested a forty year old house by applying simulated wind load in both uplift and horizontal directions in a total of 8 tests and measuring approximately 200 deflection readings. They were able to draw conclusions from this work on both the feasibility of testing full scale houses, and the mechanisms they used to resist wind loads. Those tests were valuable for evaluating analysis methods and were also used as a reference point for checking test results. However, the small amount of data collected limited the conclusions that could be drawn from those tests.. In order to rectify that problem, an instrumentation system was built to enable direct recording of response data on a digital computer. Boughton and Reardon (1983, 1984) showed the importance of testing a complete house to simulated winds by testing a new high set house designed for 42m/s, built according to the standard. Their analysis identified the load transfer and load sharing between elements, and pinpointed the areas of weakness or excessive strength. They applied uplift loads on the roof and determined the capacities and failure modes of the connections subjected to progressively increasing static and cyclic loading. These studies and many other studies such as those by Reardon (1986, 1990) and Reardon and Mahendran (1988) have pointed out the importance of the interactions between subassemblies of houses, the effect of boundary conditions, contribution of the non-structural components, and load-sharing mechanisms. Reardon and Henderson (1996) and Reardon (1996) have also demonstrated the strengths and weaknesses in conventional house construction in respect of wind forces and found that non-structural lining materials provide significant racking strength and stiffness as shown in Figure 2.1. The strength of the house was determined from combined racking and uplift loading and it was shown that the strength and stiffness of the house was increased with Page 30 of 202.
(32) the addition of various structural and non-structural components as shown in Figure 2.1. The behaviour of the individual components in the whole structure was highlighted in these studies. These studies have also shown that the behaviour and the failure modes of the components in the whole structure are different from isolated testing of the components. Thus, the studies indicated that the isolated component test results and their interpretations should be validated with full scale tests.. Figure 2.1: Change in Lateral response with addition of elements (Reardon and Henderson (1996)). Henderson (2010) carried out roofing subassembly tests to determine Australian metal clad roofing response to wind loading. The study found that the peak pressure measurement on a single pressure tap satisfactorily represents the load on a roof cladding fixing. It was also confirmed that the cladding fixing load is equal to the pressure on the tap multiplied by the tributary area of the fixing. Further, the study conducted tests for several cyclic and static tests and found that the cladding fastener response follows the applied load spectrum with minor. Page 31 of 202.
(33) change to stiffness until failure, and then the load is transferred to adjoining fixings. These tests showed that static tests satisfactorily represent loading on fasteners from the wind load fluctuations. Furthermore, the spatial variations of wind loads can be captured by conducting a series of point load tests (i.e. application of point load on the pressure tap locations).. Realistic structural testing of building and building components can be conducted using Pressure Load Actuators (PLAs) developed at the University of Western Ontario. The roof of a full scale two story house built (as shown in Figure 2.2) to the Ontario building code was tested using 58 PLAs to examine the performance of the toe nailed roof-to-wall connection (Morrison and Kopp (2009)). Toe nail connection is the most common type of primary roof-to-wall connection of residential houses in the US and Canada. The loadings for the test were obtained from a wind tunnel study conducted on a 1:50 scale model of the test house. Furthermore, the toe nail connections were found to fail on the leeward side of the roof first. Hill et al. (2009) described the structural behaviour of wood roof sheathing panels subjected to realistic wind loading in order to determine whether dynamically tested panels respond in a similar manner to statically tested panels. It was found that dynamic loading of wood roof sheathing panels causes a reduction in capacity. Henderson (2010) studied the performance of roof cladding fastener connections used in Australian housing using similar real time pressure loading system and found similar results. Morrison and Kopp (2011) also obtained the uplift capacity of toe-nailed connection under realistic wind induced pressures. Morrison et al. (2011), Henderson et al. (2011) and Kopp et al. (2011) described the response of truss-to-wall toe nail connections in hip and gable roofs subjected to realistic wind loading. They determined the influence functions of toe nail connections from the application of patch loads (i.e area loads). These studies also have shown that the load is transferred to the adjacent connections with the progressively increasing failure of truss-to-wall connections.. Page 32 of 202.
(34) Figure 2.2: Test house at UWO (Morrison and Kopp (2009)). Datin and Prevatt (2007) experimentally determined the load transfer functions for a scaled wood frame gable roof residential structure with wind tunnel derived pressure coefficients to determine uplift reactions at roof to wall connections. A roof section was constructed at one third scale trusses with load cells at roof-to-wall connection. The roof sheathing was modelled with oak strips scaled to the appropriate flexural stiffness to provide scaled load transfer between trusses. Eighteen loading points per truss were used to develop the influence surface. Time histories of the wind pressure coefficients obtained from a wind tunnel were converted to wind pressures and combined with the influence functions developed to generate wind load time histories for the truss-to-wall connections. Mensah et al. (2011) and Datin et al. (2011) derived influence functions normal to the roof on a 1/3 scale light frame wood structure shown in Figure 2.3, which was then subjected to a wind flow, while the surface pressures and structural reactions at roof-to-wall and wall-to-foundation connections were simultaneously recorded. They investigated the applicability of the database assisted design methodology which utilizes influence functions and wind load time histories to predict structural reactions of light framed wood structures subjected to fluctuating wind pressures. However, the scaled model used for these studies cannot be used to predict the non-linear behaviour and the progressive failure modes of the structural components.. Page 33 of 202.
(35) Figure 2.3: 1/3 scale model building (Mensah et al. (2011)). 2.6 Vulnerability studies based on engineering approach outside Australia The engineering based vulnerability assessment to windstorms requires a good understanding of approach wind speed, the actual forces imposed on buildings by the wind and the structural behaviour of buildings under the wind loads up to failure. This requires the response of individual members in the elastic region, the post-elastic yielding, failure of individual elements, and the redistribution of loads through the structure as a result of local failures including time dependent effects such as fatigue. In practice there is usually insufficient information to develop a comprehensive engineering based vulnerability model and the most advanced models are from a combination of engineering science and expert opinion (Walker (2011)).. The majority of residential construction in the US is light-frame wood construction. The roofs of these houses consist of roof sheathing panels and rafters/trusses. The roof panels are connected to the rafters/trusses with nails. The rafters/trusses are connected to the wall/top plate with nails or Hurricane clips. The vulnerability defined in this study is also described as fragility in the US studies. The fragility of light-frame construction in the US to wind loads has been assessed using reliability and probability theories such as those described by Galambos et al. (1982), Ellingwood et al. (1982) and Ang and Tang (2007). Rosowsky and Cheng (1999a,b). Page 34 of 202.
(36) studied the reliability of roof system components of these houses subjected to high wind uplift loads. They selected three base-line structures and wind load statistics were determined using the historical wind speed records of three coastal regions. The statistics for other parameters in the wind load equation were obtained from a Delphi investigation by Ellingwood and Tekie (1999). A Lognormal distribution was assumed for wind loads in their reliability analysis. The statistical descriptions of strength were obtained from a combination of experimental and analytical investigations conducted previously. The results of the study identified a relatively small number of connections that dominate the modes of failure of these house types. It was determined that the critical sheathing panels were located at the edges of the roof, and critical roof-to-wall connections were located near the gable end.. Rosowsky and Ellingwood (2002) described an overview of the concepts of performance based design applied to residential construction and efforts taken to develop usable fragility (i.e. vulnerability) models and system reliability tools for assessing probable response in light-frame housing. A major driving force for this has been a move towards the development of performance based design of structures. Lee and Rosowsky (2005) presented a fragility assessment for roof sheathing in light-frame constructions built in high wind regions. The fragility curves show the probability of failure of a particular component or system with increasing wind speed. They developed a fragility model for individual and complete roof sheathing uplift using available fastener strength data, wind load statistics, and a code based approach for evaluating pressures. In this approach, they investigated five simple base-line structures with different wind directionality profiles, geographic locations, nail types and enclosure conditions using reliability concepts and probability theories. Ellingwood et al. (2004) also developed fragility curves for sheathing and truss-to-wall connections in light-frame wood construction subjected to wind hazards using similar theories. Li and Ellingwood (2006) proposed a probabilistic framework to evaluate reliability of low rise houses to wind hazards. Similar to previous studies, the fragility models were developed for the housing components. Figure 2.4 shows the fragility curves obtained for roof sheathing panels for different nails in Page 35 of 202.
(37) single story residential construction, and it shows the variability in curves with the nail type and roof overhang. It was assumed that damage results from breach of envelope, and roof panel and truss damage were due to wind uplift or higher wind pressure due to dominant openings. The study assessed the applicability of Lognormal cumulative distribution function in risk assessment of light-frame wood construction. The impact of uncertainties on structural reliability due to the use of different wind speed models expressed in probabilistic parameters (Weibull distribution with different parameters by others were used) was also studied and showed that the choice of different wind speed model for risk assessment purposes has a significant impact on structural reliability and on engineering decision analysis.. Many of these studies have focused on the behaviour of individual components. However, increasingly these studies also integrated this information to model the fragility of sub systems such as roof system and the whole house (Li and Ellingwood (2009) and Lindt and Dao (2009)).. Figure 2.4: Roof panel fragility of two typical houses (Exposure B (ASCE 7-05)) (Li and Ellingwood (2006)) 2.6.1. Damage prediction models. Unanwa et al. (2000) recognized the inherently probabilistic nature in the development of engineering vulnerability models. They presented a more detailed account of the process including modelling consequence of the failure of one component on the probabilities of failure Page 36 of 202.
Figure

+7
Related documents