Children and Young People in Custody
2012–13
Children and Young People in Custody
2012–13
4
ACKNOWLEDGEMENTS
Acknowledgements
HM Inspectorate of Prisons owes thanks to all the children and young people who took the time to complete our survey and offer their experiences for analysis.
The research, development and thematics team at HM Inspectorate of Prisons also appreciates the help given by staff at each secure training centre.
The members of the research, development and thematics team who contributed to the collection and analysis of data over the year were:
Samantha Booth Jessica Broughton Annie Crowley Hayley Cripps Caroline Elwood Chloe Flint Ewan Kennedy Olayinka Macauley Rachel Murray Laura Nettleingham Danielle Pearson Amy Radford Helen Ranns Alissa Redmond Alice Reid Nalini Sharma Catherine Shaw Joe Simmonds
© Crown copyright 2013
You may re-use this information (excluding logos) free of charge in any format or medium, under the terms of the Open Government Licence. To view this licence, visit http://www.nationalarchives.gov.uk/doc/open-government-licence/ or e-mail: [email protected].
Where we have identified any third party copyright information you will need to obtain permission from the copyright holders concerned.
Any enquiries regarding this publication should be sent to us at [email protected] or HMI Prisons, Victory House, 6th floor, 30–34 Kingsway, London WC2B 6EX
This publication is also available at: http://www.justice.gov.uk/inspectorates/hmi-prisons/
ISBN:9780108560095
Printed in the UK by The Stationery Office Limited
on behalf of the Controller of Her Majesty’s Stationery Office
ID 2604451 12/13
5
CONTENTS
Foreword
5Main findings
71
Introduction
101.1 Background to children and young people in secure training centres 10
1.2 Background to the report 10
1.3 Scope of the report 11
1.4 Methodology 11
1.5 Secure training centres 12
2
Young people in custody
132.1 Introduction 13
2.2 Profile of young people surveyed 13
3
Main analysis
163.1 Arrival and first 24 hours 16
3.2 Daily life 16
3.3 Behaviour 19
3.4 Health services 20
3.5 Complaints 21
3.6 Education, training and activities 21
3.7 Safety 23
4
Diversity
264.1 Introduction 26
4.2 The experiences of young women 26
4.3 The experiences of black and minority ethnic young people 26
4.4 The experiences of Muslim young people 27
4.5 The experiences of young people who considered themselves to be Gypsy, Romany or Traveller
27
4.6 The experiences of young people who considered themselves to have a disability 28
Appendices
29A Secure training centre analysis, 2012–13 29
B Experiences of young women compared with young men, 2012–13 33
C Experiences of black and minority ethnic young people, compared with white young
people, 2012–13 36
D Experiences of Muslim young people, compared with non-Muslim young people, 2012–13 39 E Comparison between young people who were from a Gypsy, Romany or Traveller
background and those who were not, 2012–13 42
F Comparison between young people who considered themselves to have a disability and
those who did not, 2012–13 45
6
CONTENTS
REFERENCES
List of tables
1 Samples from the secure training centres 13
2 Breakdown of ethnic groups of young people sampled 14
3 Types of victimisation by other young people 24
4 Types of victimisation by staff 25
List of figures
1 Age of young people sampled 13
2 Ethnicity of young people sampled 14
3 Religious beliefs of young people sampled 15
4 Who young people would turn to if they had a problem 17
5 Contact with key worker 17
6 Young people’s experiences of religion and culture 18
7 Young people who said they could easily keep in touch with family and friends 19 8 Young people who felt they had been treated fairly by the rewards and sanctions scheme 19
9 Have you ever been disciplined in the centre? 20
10 Young people’s experiences of health services 21
11 Young people with a training, sentence or remand plan 22
12 Young people encouraged to take part in activities outside education hours 22
13 Young people learning work-related skills 23
14 Young people who felt that the education/training they had taken part in in the centre
would help them on release 23
7
FOREWORD
REFERENCES
List of tables
1 Samples from the secure training centres 13
2 Breakdown of ethnic groups of young people sampled 14
3 Types of victimisation by other young people 24
4 Types of victimisation by staff 25
List of figures
1 Age of young people sampled 13
2 Ethnicity of young people sampled 14
3 Religious beliefs of young people sampled 15
4 Who young people would turn to if they had a problem 17
5 Contact with key worker 17
6 Young people’s experiences of religion and culture 18
7 Young people who said they could easily keep in touch with family and friends 19 8 Young people who felt they had been treated fairly by the rewards and sanctions scheme 19
9 Have you ever been disciplined in the centre? 20
10 Young people’s experiences of health services 21
11 Young people with a training, sentence or remand plan 22
12 Young people encouraged to take part in activities outside education hours 22
13 Young people learning work-related skills 23
14 Young people who felt that the education/training they had taken part in in the centre
would help them on release 23
15 Young people’s perceptions of safety 24
Foreword
HMI Prisons has published an annual report on the results of surveys of children and young people held in young offender institutions (YOIs) since 2003. In April 2012, HM Inspectorate of Prisons, Ofsted and the Care Quality Commission embarked on a programme of joint inspection of secure training centres (STCs). During inspections children and young people are asked about their experiences of the centre. These survey findings are triangulated with other evidence as part of the inspection process and form part of the evidence base for each inspection report, feeding into the overall judgements and recommendations.1 This report, published jointly with the Youth Justice Board (YJB), is the first annual summary of children and young people’s self-reported experiences and perceptions from surveys that were carried out between April 2012 and March 2013 with children and young people in each of the four STCs. It is published simultaneously with our regular annual report into the perceptions of children and young people held in YOIs and should be read in conjunction with it.
The four STCs are all operated by the private sector and the boys and girls who took part in this survey were almost all aged 15 to 17 – with a small number a year younger or older. Eighty-seven per cent of the young people who responded to our survey were male and 13% female. At the time this report was prepared, the government was considering plans for major changes to youth custody arrangements. This report is the authentic voice of some of our most troubled young people who are held in the current facilities. It should inform Ministers as they finalise their plans and be of use to the managers of individual centres, the YJB, academics, policy makers and others with an interest in the detention of children and young people. Inevitably, the first survey of this group raises more questions than answers and many of the findings invite further work to understand what lies behind them. Generally, with the notable exception of views about food, most young people were positive about their treatment and the conditions in which they were held and this has been reflected in our inspection assessments. However, in some important areas, a sizeable minority of young people reported negatively and the range of some results across different establishments is concerning.
Most young people felt safe, felt that staff treated them with respect and that the education they had received in the centre would help them in future. But too many, too often, felt frightened and isolated. Only 57% said they had someone to talk to about how they were feeling when they first arrived. Sixteen per cent said they would have no one to turn to if they had a problem, one in five told us they had felt unsafe at some point (ranging from 30% to 8% across establishments) and almost one in 10 told us they felt unsafe at the time of the inspection. Nineteen per cent told us they had been victimised by other young people and 13% said they had been victimised by staff. Only just over half the young people said they would tell a member of staff if they were being victimised. Too many young people were isolated from families and friends, and in some centres only about four in five young people said it was easy to stay in touch.
The number of young people who said they had been physically restrained by staff or separated from other young people was high. Thirty-seven per cent told us they had been placed in close supervision or single separation and 30% (59% in one establishment) said they had been physically restrained by staff. Two-thirds said they had been treated fairly by the rewards and sanctions scheme.
1 Individual inspection reports can be found at http://www.justice.gov.uk/publications/inspectorate-reports/hmi-prisons/
8
FOREWORD
Young men and young women reported largely similar experiences but young women reported more negatively about feeling safe when they first arrived, health services and whether they were encouraged to take part in activities outside formal education hours. Forty-four per cent of young people told us they were from a black or minority ethnic background, 21% told us they were Muslims, 12% told us they were from a Gypsy, Romany or Traveller background and 19% told us they had a disability. The numbers of young people who told us they were Muslims and those from a Gypsy, Romany or Traveller backgrounds are particularly striking especially as the latter varies substantially from statistical data held by the centres – this requires further investigation. In some important areas, young people from all minority groups reported different experiences from the population as a whole. Young people from black and minority ethnic backgrounds and young Muslim people both reported more difficulty in keeping in touch with family and friends than the population as a whole and both were more negative about aspects of the education they had received in the centre. A higher proportion of young people from Gypsy, Romany or Traveller backgrounds said they had felt unsafe and had been bullied or victimised by other young people and 13% said they had been physically abused by staff compared with 2% of all young people. More work needs to be done to understand the over-representation of these minority groups and what lies behind the differences in their perceived experiences.
All the young people held in STCs are children and have the same fundamental rights as other children – to be safe from harm, educated, healthy, treated fairly and heard. Most of the young people surveyed for this report tell us that is the case, but a significant minority say that in important areas that is not so. The planned changes to the youth custody estate need to take careful account of what young people themselves identify as the strengths and weaknesses of the current provision.
Nick Hardwick
9
MAIN FINDINGS
Main findings
This section provides an overview of the key findings from all analyses conducted for the 2012–13 reporting period. It sets out the findings that are most important in understanding young people’s experiences of custody and those where significant differences exist
between different groups of young people, for example, responses from young women compared with young men, or responses from black and minority ethnic young people compared with white young people. Full survey analysis can be found in the appendices.
Young people – demographic findings
• Thirty-nine per cent of young people reported that they were under 16 at the time of the survey.
• Forty-four per cent said they were from a black or minority ethnic background. • Twelve per cent reported being Gypsy, Romany or Traveller.
• Twenty-one per cent said that they were Muslim. • Nineteen per cent told us that they had a disability.
Experiences of young people in 2012–13 – overall findings
Arrival and first 24 hours
• Young people were generally positive about their journey to their centre and their first 24 hours there. Eighty-seven per cent felt that on arrival they were searched in a respectful way and 88% felt safe on their first night. Only 57%, however, felt that they had someone to talk to when they first arrived, though this varied from 73% in one centre to 45% in another.
Daily life
• Less than a third (29%) reported that the food was good or very good. • Eighty-eight per cent felt that staff treated them with respect.
• Sixteen per cent reported that they would have no one to turn to if they had a problem. • Eighty-three per cent reported that their religious beliefs were respected.
• Eighty-three per cent reported that it was easy to keep in touch with family, ranging across the centres from 97% to 77%.
Behaviour
• Sixty-six per cent of young people said they had been treated fairly by the rewards and sanctions scheme. This ranged from 81% to 46% across establishments.
• Thirty-seven per cent of young people said they had been placed in single separation or close supervision. This ranged from 29% to 43% across establishments.
10
MAIN FINDINGS
Health services
• Sixty-four per cent of young people said health services were good, ranging from 84% to 31%.
Complaints
• Nearly all young people (95%) knew how to make a complaint and few (8%) reported that they had ever felt too scared or intimidated to make one. Of those who had made a complaint, 56% thought it had been dealt with fairly, ranging from 44% to 75% across centres.
Education and training activities
• Sixty-four per cent felt that they had been able to learn work-related skills at their centre. Two-thirds (67%) felt that the education they had taken part in at their centre would help them on release.
Safety
• Twenty per cent of young people reported that they had felt unsafe in their centre at some point, ranging from 30% at one centre to 8% at another. Nine per cent of young people said they felt unsafe at the time of the survey.
• Nineteen per cent said that they had been victimised by other young people and 13% said they had been victimised by staff. Just over half (56%) would tell a member of staff about victimisation they were experiencing and 78% felt that staff would take it seriously, though this ranged from 86% in one centre to 64% in another.
Experiences of young women
• Young women were less likely to report feeling safe on their first night (74% compared with 89% of young men).
• A lower proportion of young women reported that the health services in their centre were good (44% compared with 68% of young men).
• A smaller proportion of young women reported that they were encouraged to take part in activities outside education hours (69% compared with 86% of young men).
Experiences of black and minority ethnic young people
• Black and minority ethnic young people were less likely than white young people to report that they found it easy to keep in touch with family (77% compared with 88%). • A lower proportion felt that the health services were good (48% compared with 75% of
white young people).
• A lower proportion thought that the education they had taken part in at the centre would help them on release (57% compared with 73% of white young people). • Black and minority ethnic young people were also less likely to say that they would
11
MAIN FINDINGS
Experiences of Muslim young people
• Seventy-two per cent of Muslim young people compared with 86% of non-Muslim young people reported that they found it easy to keep in touch with family.
• Only 38% of Muslim young people compared with 71% of non-Muslim young people reported that they had been able to learn work-related skills in their centre.
• Only 2% of Muslim young people reported that they had been bullied or victimised by other young people, compared to 24% of non-Muslim young people.
• A higher proportion of Muslim young people felt that staff would take it seriously if they reported that they were being bullied or victimised (93% compared with 77% of non-Muslim young people).
Experiences of Gypsy, Romany or Traveller young people
• A lower proportion of Gypsy, Romany or Traveller young people reported having been physically restrained in their centre (7% compared with 31%).
• Eighty-nine per cent felt that the education they had taken part in would help them on release (compared with 66% of non-Gypsy, Romany or Traveller young people). • Twenty-seven per cent, however, said that they felt too scared or intimidated to make a
complaint (compared with 7% of non-Gypsy, Romany or Traveller young people). • Thirty-six per cent of Gypsy, Romany or Traveller young people said they had felt
unsafe (compared with 17%) and 39% reported that they had been bullied or victimised by other young people (compared with 13% of non-Gypsy, Romany or Traveller young people).
• Thirteen per cent of Gypsy, Romany or Traveller young people reported they had been physically abused by staff compared with 2% of non-Gypsy, Romany or Traveller young people. Fifty-six per cent felt that staff would take it seriously if they reported that they had been victimised, compared with 82% of non-Gypsy, Romany or Traveller young people.
Experiences of young people who considered themselves to have a disability
12
SECTION ONE
Section 1
Introduction
1.1 Background to children and young people in secure
training centres
Secure training centres hold children and young people aged between 12 and 18; there are four, all run by private operators on behalf of the Youth Justice Board (YJB). The centres are purpose built and the first opened in 1999. While the number of children and young people held in young offender institutions and secure children’s homes has steadily declined in recent years, the number held in secure training centres has remained relatively constant. During the reporting year, provisional figures show that 284 children and young people were held in secure training centres in April 2012; this dropped to a four-year low of 226 in December 2012, though rose again to 259 by March 2013.2 In July 2013, the YJB announced the closure of the three remaining young offender institution units for girls under 18, largely due to the very low numbers held in them: in future any young woman sentenced to custody will be held in either secure training centres or secure children’s homes.
In February 2013, the Government published plans to review the secure estate and put a greater focus on education within youth custody. The Transforming youth custody: Putting education at the heart of detention3 consultation proposed the development of ‘secure colleges’ to increase the quantity and standard of academic and vocational training for young people held in detention as a means to reduce reoffending and tackle underlying issues facing those young people that enter custody. It is proposed that the network of ‘secure colleges’ would meet the overall demand for youth custody in England and Wales. Alongside ‘secure colleges’ the proposals maintain the need for specialist provision for the most vulnerable who are presently held within secure children’s homes and secure training centres. The outcome of the consultation on these proposals had not been published at the time this report was prepared and so the final shape of future youth custody provision was not known.
1.2 Background to the report
HM Inspectorate of Prisons (HMIP), Ofsted and the Care Quality Commission (CQC) began jointly inspecting secure training centres in 2012–13 and each centre is inspected annually on an unannounced basis. To ensure that children and young people are able to comment on their treatment and conditions in custody, a survey was developed by HMIP in collaboration with Ofsted and CQC, with consultation with young people and staff in STCs, as well as the YJB. All children and young people are offered a survey to complete as part of the inspection process: the results form part of the evidence base for each individual inspection. The data is triangulated with inspectors’ observations, discussions with young people and staff, and documentation held in the centre. Following the first year of implementation the survey has been collaboratively reviewed to capture learning and make improvements. As with all surveys used across the places of detention we inspect, this will be subject to regular review.
This report presents the findings from surveys carried out in all four secure training centres between 1 April 2012 and 31 March 2013. In total, 148 responses have been analysed.
2 https://www.gov.uk/government/publications/youth-custody-data
3 Ministry of Justice (2013) Transforming youth custody: Putting education at the heart of detention, consultation paper
13
SECTION ONE
This report is based solely on young people’s self reported perceptions and experiences and therefore may vary from statistical data held by centres.
1.3 Scope of the report
This report contains information on young people’s perceptions of the conditions and treatment they have experienced in custody. A brief description of all the secure training centres where a survey was conducted is outlined in Section 1.5. Section 2 provides the demographic details of the young people who completed our survey. Section 3 includes overall responses to each question, showing an amalgamated figure as well the highest and lowest figures across the centres.
Section 4 of the report presents analyses of the responses of young women compared with young men, young people from black and minority ethnic backgrounds compared with white young people, Muslim young people compared with non-Muslim young people, young people from a Gypsy, Romany or Traveller background compared with those who are not and young people who consider themselves to have a disability compared with those who do not. Only differences that are statistically significant are mentioned in Section 4.4
1.4 Methodology
Surveys were conducted intermittently across the reporting year (between April 2012 and March 2013) during unannounced inspections of the secure training centres. At each centre, researchers distributed questionnaires to all young people. Every effort was made to speak to each person individually in order to explain the purpose and confidentiality of the survey and to make participants aware of the independence of the Inspectorate. Interviews were routinely offered to all young people aged 14 or under and were also conducted with those who said they would have problems completing the survey due to literacy or language difficulties. All completed questionnaires were placed in sealed envelopes and collected by members of the inspection team. To ensure child protection issues could be followed up, each questionnaire was numbered: when given the survey, children and young people were made aware of the process should they write something that raised child protection concerns.
Selecting the sample
All young people in the establishment at the time of the survey were included in the sample. Treatment of data
Throughout this report data are weighted to mimic the whole population at each centre: the overall responses reflect all young people at each secure training centre at the time of the survey. All the figures in the comparator tables are weighted data.
Missing data, where respondents have not answered a question, have been excluded from the analysis. This means that percentages may have been calculated from different totals where there are different response rates across questions.
The majority of figures quoted in this report have been rounded to the nearest whole number. Some figures quoted may not match those previously published in inspection reports as they have been analysed differently for the purposes of this report.
4 Statistical difference is used to indicate whether there is a real difference between the figures, i.e. the difference is
14
SECTION ONE
1.5 Secure training centres
All four secure training centres were surveyed during this reporting year; three of these hold young men and young women, one holds young men only.
Secure training centres are inspected jointly by HM Inspectorate of Prisons, Ofsted and the Care Quality Commission. When inspected, they are awarded a judgement of Outstanding, Good, Adequate, or Inadequate across five key areas – the safety of young people, the behaviour of young people, the well-being of young people, the achievement of young people and the resettlement of young people.
Hassockfield STC
Hassockfield is located in County Durham, and can hold up to 58 young people. It takes young men and young women who are sentenced or on remand. It has been operated by Serco since 1999.
Hassockfield was last inspected in February 2013 and was assessed as follows: Safety – Good; Behaviour – Good; Well-being – Good; Achievement – Good; Resettlement – Outstanding.
Medway STC
Medway is located in Chatham, Kent and is operated by G4S. It opened in April 1998 and originally held up to 40 young men. The centre expanded in 2002 to accommodate a total of 76 young men and young women.
The survey results which are included in this report were used to inform the inspection of Medway which took place in November 2012. At that time, Medway was assessed as follows: Safety – Good; Behaviour – Good; Well-being – Good; Achievement – Adequate; Resettlement – Good. Medway was last inspected in June 2013 and was assessed as follows: Safety – Good; Behaviour – Good; Well-being – Good; Achievement – Good; Resettlement – Good.
Oakhill STC
Oakhill opened in August 2004, originally holding both young men and women. It now holds only young men with a capacity of up to 80. It is located in Milton Keynes and operated by G4S.
Oakhill was last inspected in March 2013 and was assessed as follows: Safety – Good; Behaviour – Good; Well-being – Good; Achievement – Good; Resettlement – Good. Rainsbrook STC
Rainsbrook is located near Rugby and is operated by G4S. It opened in July 1999 and was originally designed to accommodate 40 young men. In 2002 the centre expanded to accommodate a total of 76 young men and women. In October 2006, Rainsbrook STC opened Chadlington, a purpose-built mother and baby unit to care for detained young mothers and their babies, as well as those in the final stages of pregnancy.
15
SECTION TWO
[image:15.595.89.511.228.362.2]14 years old 15 years old 16 years old 17 years old 18 years old Figure 1: Age of young people sampled
39
22 7
32
%
1
Section 2
Young people in custody
2.1 Introduction
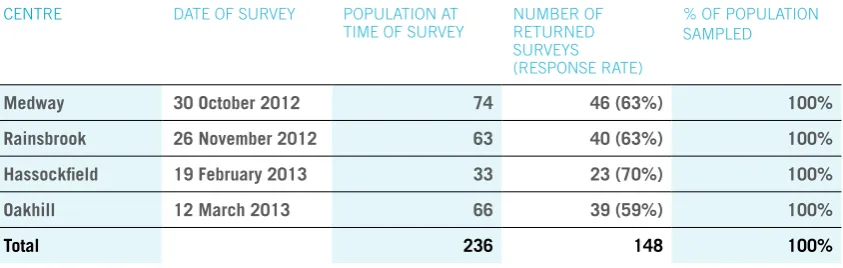
[image:15.595.85.511.579.774.2]This report summarises the survey responses from all four secure training centres visited during the year. In total, 148 young people took part in the survey. Survey information for each secure training centre is shown in Table 1.
Table 1: Samples from the secure training centres CENTRE DATE OF SURVEY POPULATION AT
TIME OF SURVEY NUMBER OF RETURNED SURVEYS (RESPONSE RATE)
% OF POPULATION SAMPLED
Medway 30 October 2012 74 46 (63%) 100%
Rainsbrook 26 November 2012 63 40 (63%) 100%
Hassockfield 19 February 2013 33 23 (70%) 100%
Oakhill 12 March 2013 66 39 (59%) 100%
Total 236 148 100%
2.2 Profile of young people surveyed
All the young people surveyed were asked to give some basic background and demographic information.
2.2.1 Gender
Eighty-seven per cent reported that they were male and 13% female.
2.2.2 Age
16
SECTION TWO
2.2.3 Nationality
The majority of young people reported that they were British nationals (94%). This ranged from 100% of the young people at Hassockfield, closely followed by 97% at Rainsbrook, 95% at Oakhill and 89% at Medway.
2.2.4 Ethnicity
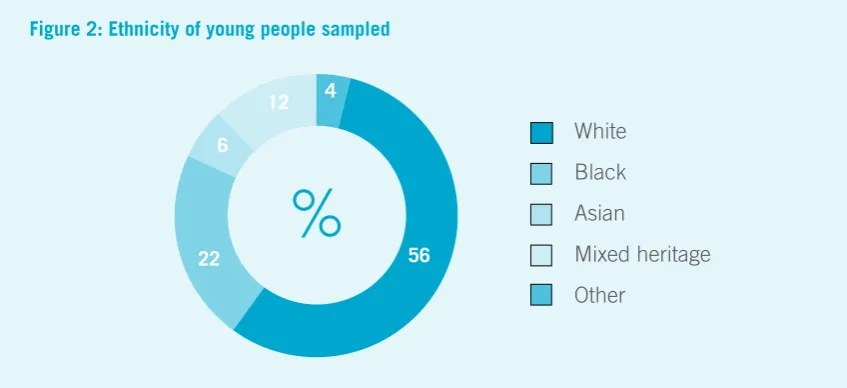
In total, 56% of young people reported that they were from a white background and 44% from a black or minority ethnic background. Twenty-two per cent of young people surveyed reported that they were black, 12% said they were from a mixed heritage background, 6% said they were Asian and 4% reported that they were from another ethnic background (see Figure 2). The full breakdown within these categories is shown in Table 2.
[image:16.595.86.510.251.445.2]White Black Asian Mixed heritage Other 22 56 4 12
%
Figure 2: Ethnicity of young people sampled
6
Table 2: Breakdown of ethnic groups of young people sampled
WHITE BLACK ASIAN MIXED HERITAGE OTHER ETHNIC
GROUP White British 48.1% Caribbean 11.5% Pakistani 2.6%
White and Caribbean 8.1% Arab 1.7% White Irish 3.8% African 9.8% Indian 0.9%
White and African 0.4%
Other ethnic group 2.6% White other 4.3% Black other 0.9% Bangladeshi 1.3%
White and Asian 1.3%
Asian other 1.3%
Other mixed heritage group 1.7%
[image:16.595.85.512.254.634.2] [image:16.595.88.510.481.642.2]17
SECTION TWO
%
None
Church of England Catholic
Other Protestant Other Christian denomination Hindu
Jewish Muslim Sikh 19
35
9 1 1
1
14 20
1 2.2.5 Religion
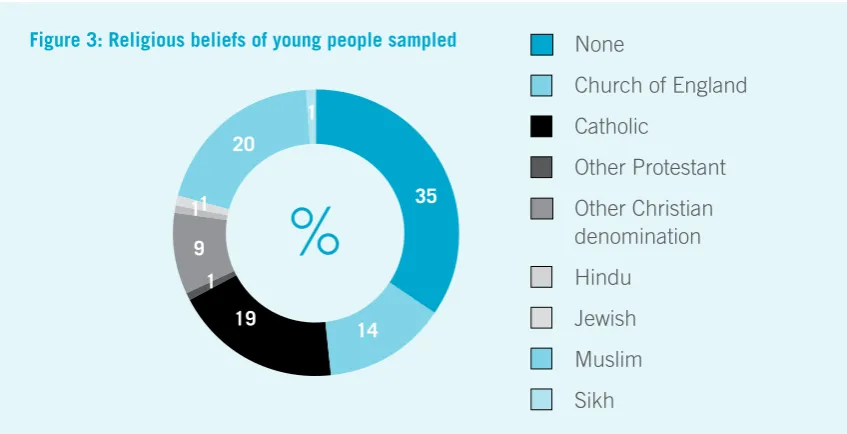
[image:17.595.86.510.171.388.2]Over a third (35%) of young people reported that they had no religion. Twenty per cent of young people reported that they were Muslim and 19% reported that they were Catholic. Fourteen per cent of young people said they were Church of England. A full breakdown of young people’s religions is provided in Figure 3.
Figure 3: Religious beliefs of young people sampled
2.2.6 Gypsy, Romany or Traveller
In total, 12% of young people surveyed reported that they were Gypsy, Romany or Traveller. The largest proportion of young people who considered themselves to be Gypsy, Romany or Traveller was at Medway (22%) and the smallest proportion was at Hassockfield (3%).
2.2.7 Disability
18
SECTION THREE
Section 3
Main analysis
3.1 Arrival and first 24 hours
3.1.1 On your most recent journey here, did you feel that staff were looking after you?
In 2012–13, 92% of young people reported that they felt that staff looked after them on the journey to their centre, ranging from 97% at Oakhill to 88% at both Hassockfield and Rainsbrook.
3.1.2 When you were searched, was this carried out in a respectful way?
Of all young people surveyed in 2012–13, 87% reported that they were searched in a respectful way. Young people at Medway were most likely to report that they had been searched in a respectful way (89%), while those at Rainsbrook were the least likely (83%).
3.1.3 Services available on the first night
When asked about the services that they had access to on their first night, 93% of young people said that they saw a member of the health services staff. This ranged from 100% at Rainsbrook to 81% at Medway.
On the first night at their centre, 57% of all young people said that they were able to talk to someone about how they were feeling; this was highest at Hassockfield (73%) and lowest at Medway (45%).
Of those surveyed, 88% of young people told us that they felt safe on their first night in their centre. The highest proportion of young people reporting feeling safe was at Oakhill (95%) with the lowest proportion at Medway (82%).
3.2 Daily life
3.2.1. Is the food here good/very good?
Of all young people surveyed in 2012–13, less than a third (29%) reported that the food at the centre was either good or very good. Young people at Hassockfield were most likely to report that the food was good or very good (58%), while those at Rainsbrook were the least likely (22%).
3.2.2 If you had a problem, who would you turn to?
19
[image:19.595.87.349.131.318.2]SECTION THREE
Figure 4: Who young people would turn to if they had a problem
8 12
31
48 49
31
0 10 20 30 40 50
Teacher/education staff Another young person No one Caseworker Key worker Staff on your unit Family
Percentage 16
3.2.3 Key workers
Almost all young people reported that they had a key worker (96%). This ranged from all young people at Oakhill to 87% of young people at Hassockfield.
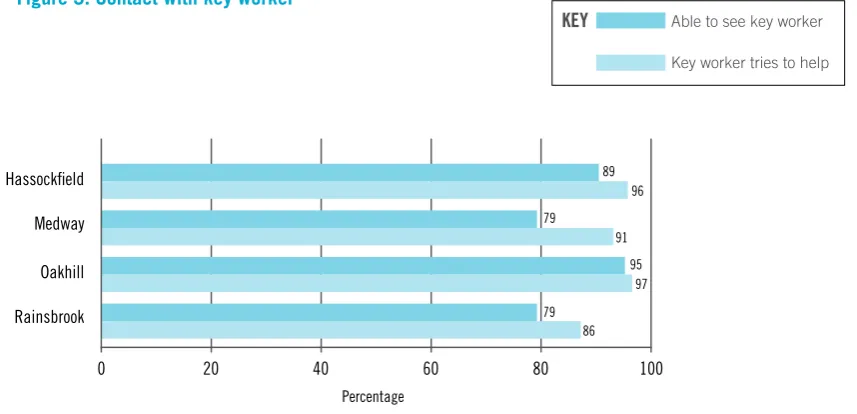
Of those who said that they had a key worker, 85% reported that they were able to see them when they wanted to. The lowest proportion who reported this was at Medway (79%), and the highest was at Oakhill (95%). Ninety-two per cent reported that their key worker tried to help them. The most positive response was from Oakhill with almost all of the young people who reported having a key worker stating that they tried to help them (97%); the least positive response came from Rainsbrook (86%). A breakdown by centre of young people who had contact with their key worker is provided in Figure 5.
Figure 5: Contact with key worker
0 20 40 60 80 100
Rainsbrook Oakhill Medway Hassockfield
Percentage
86 97 91
96
79
95 79
89
Able to see key worker
Key worker tries to help
[image:19.595.88.517.527.734.2]20
SECTION THREE
3.2.4 Do most staff treat you with respect?
Overall, 88% of young people said that they felt most staff treated them with respect. The least positive responses came from Medway (80%); the most positive responses came from young people at Oakhill, where almost all young people said that staff treated them with respect (97%).
3.2.5 Religious beliefs and services
Overall, 83% of young people said they felt that their religious and cultural views were respected. The most positive response came from Oakhill with almost all of the young people stating that their religious and cultural views were respected (95%); the least positive response came from Rainsbrook (71%).
[image:20.595.90.450.391.557.2]Seventy-two per cent of young people reported that they could attend religious services at their centre. This was reported by just 35% at Hassockfield, the lowest proportion across all centres and by 89% at Oakhill, the highest. Young people’s experiences of religion and culture are shown in Figure 6.
Figure 6: Young people’s experiences of religion and culture
0 10 20 30 40 50 60 70 80 90 100
Percentage
Rainsbrook Oakhill Medway Hassockfield
71
95 88 77
64
89 80 35
3.2.6 Is it easy to keep in touch with family?
Eighty-three per cent of young people reported that it was easy for them to keep in touch with family. Oakhill had the lowest proportion (77%) and Hassockfield had the highest proportion, with almost all young people (97%) reporting that it was easy to keep in touch with family. The proportion of young people at each centre who said they were easily able to keep in touch with family and friends is shown in Figure 7.
I can attend religious services
I feel my religious beliefs are respected
21
[image:21.595.91.423.114.247.2]SECTION THREE
Figure 7: Young people who said they could easily keep in touch with family and friends
0 10 20 30 40 50 60 70 80 90 100
Percentage
Rainsbrook Oakhill Medway Hassockfield
87 79
77
97
3.3 Behaviour
3.3.1 Rewards and sanctions scheme
In total, 95% of all young people surveyed reported that they knew what the rewards and sanctions scheme was. Rainsbrook had the highest proportion of young people (100%) who stated they knew what the scheme was, with the lowest proportion at Hassockfield (91%). Sixty-six per cent of young people reported that they felt they had been treated fairly with regards to the rewards and sanctions scheme. Young people at Hassockfield reported most positively (81%) and those at Medway were the most negative, with only 46% reporting that they felt they had been treated fairly by the rewards and sanctions scheme. A breakdown of young people’s experience of the rewards and sanctions scheme is found in Figure 8.
Figure 8: Young people who felt they had been treated fairly by the rewards and sanctions scheme
0 10 20 30 40 50 60 70 80 90 100
Percentage
Medway Rainsbrook Oakhill Hassockfield
46
77
67
81
3.3.2 If you get into trouble, do staff explain why?
[image:21.595.90.427.482.618.2]22
SECTION THREE
3.3.3 Have you been placed in close supervision or single separation here?
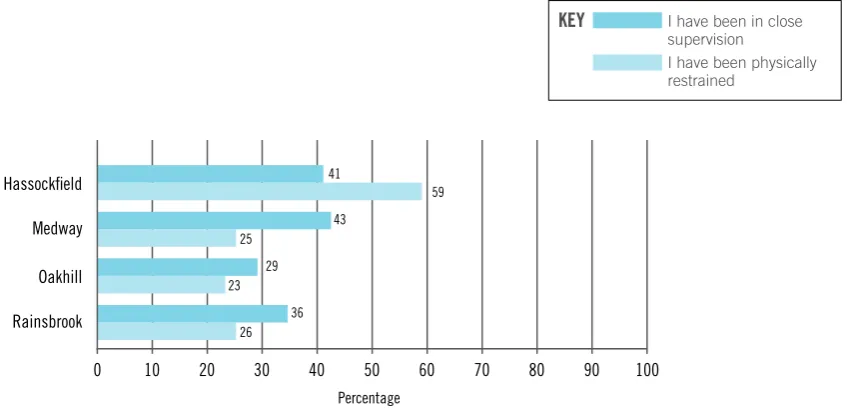
Over a third of young people (37%) reported that they had been placed in close supervision or single separation at their centre. This was most frequently reported in Medway with 43% reporting this. The lowest figures were from Oakhill (29%).
3.3.4 Have you been physically restrained since you have been here?
Thirty per cent of young people told us that they had been physically restrained by staff since arriving at their centre. The highest proportion was found at Hassockfield (59%) and the lowest at Oakhill (23%).
[image:22.595.89.513.280.490.2]A breakdown by centre of young people’s experience of disciplinary procedures is found in Figure 9.
Figure 9: Have you ever been disciplined in the centre?
0 10 20 30 40 50 60 70 80 90 100
Percentage
Rainsbrook Oakhill Medway Hassockfield
26 23
25
59
36 29
43 41
3.4 Health services
3.4.1 If you feel ill, are you able to see a health service worker?
Ninety-two per cent of young people reported that they were able to see a health service worker if they felt ill. This ranged from almost all young people at Oakhill and Rainsbrook (97%) to 85% at Medway.
3.4.2 Do you think that the health services are good here?
Almost two-thirds of young people (64%) said that the health services at their centre were good. Only 31% of young people at Medway reported that health services were good, the lowest across all the centres; the highest proportion was at Oakhill (84%). Figure 10 shows a breakdown of the young people’s reported experiences of health services.
I have been in close supervision
I have been physically restrained
23
[image:23.595.91.429.183.317.2]SECTION THREE
Figure 10: Young people’s experiences of health services
0 10 20 30 40 50 60 70 80 90 100
Percentage
Rainsbrook Oakhill Medway Hassockfield
71 84 31
82
97 97 85
91
3.5 Complaints
3.5.1 Experience of the complaints system
When asked if they knew how to make a complaint, 95% of young people reported that they did; this ranged from 97% at Hassockfield to 93% at Medway.
Of those who had made a complaint, 56% felt that it had been dealt with fairly. The least positive response was from Medway where 44% of young people felt that their complaint was dealt with fairly; the most positive response was from Rainsbrook (75%).
Overall, 8% of young people reported that they had felt too scared or intimidated to make a complaint. Sixteen per cent of young people at Rainsbrook said that this was the case while no young people reported this at Hassockfield.
3.6 Education, training and activities
3.6.1 Do you have a training plan, sentence plan or remand plan?
Overall, just under two-thirds (62%) of young people reported that they had a training plan, sentence plan or remand plan. This varied from a high of 71% of young people at Medway, to a low of 49% at Rainsbrook. A breakdown of young people who reported having a training, sentence or remand plan can be seen in Figure 11.
I am able to see a health worker I think the health services are good
24
[image:24.595.100.420.113.252.2]SECTION THREE
Figure 11: Young people with a training, sentence or remand plan
0 10 20 30 40 50 60 70 80 90 100
Percentage
Rainsbrook Oakhill Medway Hassockfield
49
71
61 70
3.6.2 Are you encouraged to take part in activities outside education hours?
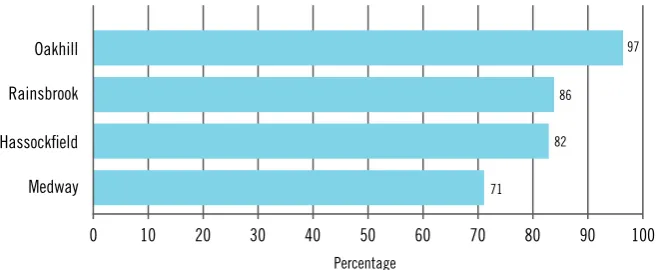
Overall, 84% of young people surveyed in 2012–13 said that they were encouraged to take part in activities outside education hours. Responses varied from 97% of young people at Oakhill to 71% at Medway. A full breakdown by centre is provided in Figure 12.
Figure 12: Young people encouraged to take part in activities outside education hours
0 10 20 30 40 50 60 70 80 90 100
Percentage
Medway Hassockfield Rainsbrook Oakhill
71
86
82
97
3.6.3 Have you been given career advice here?
At the time of the survey, 61% of all young people told us that they had been given career advice in their centre. The highest proportion was at Hassockfield (77%) and the lowest proportion at Medway (49%).
3.6.4 Have you been able to learn work-related skills here?
[image:24.595.91.422.404.539.2]25
[image:25.595.91.421.117.254.2]SECTION THREE
Figure 13: Young people learning work-related skills
0 10 20 30 40 50 60 70 80 90 100
Percentage
Medway Rainsbrook Hassockfield Oakhill
56 66
63 72
3.6.5 Do you think your education here will help you once you leave?
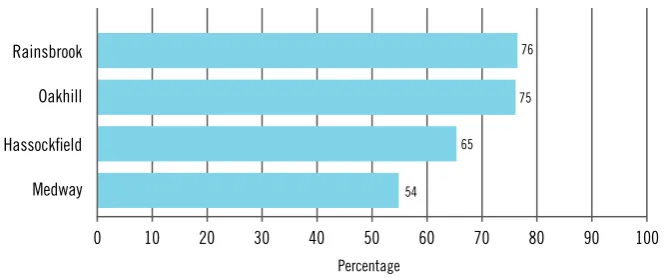
Young people were asked if they thought that the education they had received while at their centre, would help them on release – two thirds (67%) felt that it would, ranging from 76% of the young people at Rainsbrook to 54% at Medway. A full breakdown by centre is provided in Figure 14.
Figure 14: Young people who felt that the education/training they had taken part in in the centre would help them on release
0 10 20 30 40 50 60 70 80 90 100
Percentage
Medway Hassockfield Oakhill Rainsbrook
54
75
65 76
3.7 Safety
3.7.1 How safe do you feel here?
[image:25.595.89.423.419.558.2]26
SECTION THREE
0 5 10 15 20 25 30 35 40 45 50
Percentage
Rainsbrook Oakhill Medway Hassockfield
5 8
14 9
26 8
30 12
Young people who have ever felt unsafe Young people who feel unsafe at the moment
[image:26.595.90.507.91.328.2]KEY
Figure 15: Young people’s perceptions of safety
3.7.2 Have you been victimised by other young people?
[image:26.595.79.513.473.722.2]Almost a fifth (19%) of young people surveyed in 2012–13 told us that they had been victimised by another young person or group of young people at their centre. At Medway, the proportion of young people reporting victimisation by their peers was almost a quarter (24%), followed by 22% at Rainsbrook, 18% at Hassockfield and 11% at Oakhill. A detailed breakdown of types of victimisation by other young people can be seen in Table 3.
Table 3: Types of victimisation by other young people
OVERALL PERCENTAGE OF YOUNG PEOPLE WHO REPORTED EXPERIENCING DIFFERENT TYPES OF VICTIMISATION
Insulting remarks 9%
Physical abuse 8%
Feeling threatened or intimidated 7%
For being new 7%
Because of their crime 3%
Having property taken 2%
Because of drugs 2%
Racial or ethnic abuse 2%
Because of their nationality 2%
For being from a different part of the country 2%
Because of religious beliefs 1%
For being from the Traveller community 1%
Because of their sexual orientation 1%
Because of their disability 1%
Gang-related issues 1%
27
SECTION THREE
The second most commonly reported form of victimisation by other young people was physical abuse, ranging from 10% of young people at Rainsbrook to 3% of young people at Oakhill.
3.7.3 Have you been victimised by staff?
[image:27.595.85.512.245.483.2]Thirteen per cent of young people told us that they had been victimised by a member or group of staff at their current centre. This was highest at Medway (18%), followed by Rainsbrook (17%), Hassockfield (13%) and Oakhill (3%). A detailed breakdown of types of victimisation by staff can be seen in Table 4.
Table 4: Types of victimisation by staff
OVERALL PERCENTAGE OF YOUNG PEOPLE WHO REPORTED EXPERIENCING DIFFERENT TYPES OF VICTIMISATION
Insulting remarks 5%
Physical abuse 4%
Feeling threatened or intimidated 3%
Having property taken 2%
Racial or ethnic abuse 2%
For being new 2%
Because of their crime 2%
Because of religious beliefs 1%
Because of their nationality 1%
For being from a different part of the Country 1%
For being from the Traveller community 1%
Because of their disability 1%
Gang-related issues 1%
For making a complaint 1%
Insulting remarks by staff was the most common type of victimisation experienced, with 5% of all young people saying that they had experienced this. This was most commonly reported at both Medway and Rainsbrook, where 9% of young people told us they had been insulted by staff, and lowest at Oakhill (0%).
The second most commonly reported form of victimisation by staff was physical abuse, reported by 4% of young people. This ranged from 7% at Medway to none of the young people at Hassockfield.
3.7.4 Would you report victimisation to a member of staff?
Of all the young people surveyed in 2012–13, 56% told us that they felt they would tell a member of staff if they were being victimised. The highest proportion was at Hassockfield with almost two-thirds (65%) saying this, and the lowest proportion was at Oakhill (41%). Overall, 78% of young people said that they thought the staff would take them seriously if they told them they were being bullied. This ranged from 86% at Rainsbrook to 64% at Medway.
3.7.5 Is shouting through the windows a problem?
28
SECTION FOUR
Section 4
Diversity
4.1 Introduction
This section reports on the experiences of young women compared with young men, black and minority ethnic young people compared with white young people, Muslim young people compared with non-Muslim young people, Gypsy, Romany or Traveller young people compared with non-Gypsy, Romany or Traveller young people, and young people who consider themselves to have a disability compared with those who do not.
Appendices B, C, D, E and F show the full analyses with any statistically significant differences highlighted. Missing data have been excluded for each question.
4.2 The experiences of young women
In our sample there were 20 young women (13%) and 126 young men (87%).
• Less than three-quarters (74%) of young women reported feeling safe in their first 24 hours at their centre, compared with 89% of young men.
• When asked who they would turn to if they had a problem, young women were more likely to turn to another young person in their centre than young men (50% compared with 7%). Young women also reported that they were more likely to turn to their family if they had a problem (71% compared with 45% of young men).
• Forty-four per cent of young women felt that the health services at their centre were good, compared with 68% of young men.
• Sixty-nine per cent of young women said that they were encouraged to take part in activities outside of education hours, compared to 89% of young men.
• Over a quarter (26%) of young women reported that they had been victimised by other young people using insulting remarks, compared to 7% of young men. A higher proportion of young women reported being victimised by other young people because they were new (26% compared with 4% of young men).
4.3 The experiences of black and minority ethnic young people
In our sample, there were 63 (44%) young people from black and minority ethnic groups compared with 83 (56%) young people from white groups (see Figure 2, page 14, for a breakdown of ethnicity). The questionnaire did not directly ask young people to comment on their experiences of racism: data has been analysed by comparing responses based on demographic information. Young people from black and minority ethnic backgrounds generally had more negative perceptions of their custodial experience than those from white backgrounds (see Appendix C).
• When asked who they would turn to if they had a problem, 3% of black and minority ethnic young people said they would turn to a teacher or a member of the education staff, compared with 13% of white young people. Forty per cent reported that they would turn to staff on their unit, compared with 55% of white young people. • A smaller proportion of black and minority ethnic young people reported that they
29
SECTION FOUR
• Forty-eight per cent of black and minority ethnic young people reported that they thought the health services were good at their centre, compared with three-quarters (75%) of white young people.
• Fifty-seven per cent of black and minority ethnic young people told us that they thought their education would help them once released, compared with 73% of white young people.
• Black and minority ethnic young people were less likely than white young people to report that they had felt threatened or intimidated by staff (0% compared with 5%). • A lower proportion of black and minority ethnic young people reported that they would
tell a member of staff if they were being bullied (45% compared with 63% of white young people).
4.4 The experiences of Muslim young people
Twenty-one per cent of the young people surveyed in 2012–13 said they were Muslim. Appendix D shows that the perceptions of Muslim young people were generally more positive than those of non-Muslim young people.
• Muslim young people were more likely to report that they would turn to another young person if they had a problem (22% compared with 9% of non-Muslim young people). • A lower proportion of Muslim young people felt that it was easy for them to keep in touch
with their family and friends (72% compared with 86% of non-Muslim young people). • Two per cent of Muslim young people reported having been victimised by other
young people, compared with 24% of non-Muslim young people who reported this. A smaller proportion of Muslim young people than non-Muslim young people reported victimisation in the form of insulting remarks, physical abuse, feeling threatened or intimidated or for being new.
• A lower proportion of Muslim young people reported that they were able to learn work-related skills in their centre than non-Muslim young people (38% compared with 71%). • A higher proportion of Muslim young people than non-Muslim young people reported
that they felt staff would take it seriously if they told them that they were being bullied or victimised (93% compared with 77%).
4.5 The experiences of young people who considered themselves
to be Gypsy, Romany or Traveller
Of the young people surveyed, 12% considered themselves to be Gypsy, Romany or Traveller. As shown in Appendix E, the perceptions of young people who considered themselves to be Gypsy, Romany or Traveller were broadly similar to those who did not consider themselves to be Gypsy, Romany or Traveller in many areas.
30
SECTION FOUR
• A smaller proportion of Gypsy, Romany or Traveller young people reported being restrained since they came to their centre than non-Gypsy, Romany or Traveller young people (7% compared with 31%).
• More than a quarter (27%) of Gypsy, Romany or Traveller young people reported that they had felt too scared or intimidated to make a complaint, compared with 7% of non-Gypsy, Romany or Traveller young people.
• Gypsy, Romany or Traveller young people were more likely to report that they felt their education would help them once they left their centre (89% compared with 66%). • Over a third (36%) of Gypsy, Romany or Traveller young people reported that they had
felt unsafe in their centre, compared with 17% of non-Gypsy, Romany or Traveller young people.
• Thirty-nine per cent of Gypsy, Romany or Traveller young people reported that they had been victimised by other young people, compared to 13% of non-Gypsy, Romany or Traveller young people. Higher proportions of Gypsy, Romany or Traveller young people than non-Gypsy, Romany or Traveller young people reported victimisation in the form of insulting remarks (19% compared with 7%), physical abuse (19% compared with 6%) and victimisation for being from the Traveller community (8% compared with 0%). • Thirteen per cent of Gypsy, Romany or Traveller young people reported that they had
been physically abused by staff, compared with 2% of non-Gypsy, Romany or Traveller young people. Gypsy, Romany or Traveller young people were also less likely to feel that staff would take them seriously if they complained about being bullied or victimised (56% compared with 82% of non-Gypsy, Romany or Traveller young people).
4.6 The experiences of young people who considered themselves
to have a disability
Of the young people surveyed, 19% considered themselves to have a disability. Appendix F shows the areas that differed significantly between those who considered themselves to have a disability and those who did not. As shown in Appendix F, the perceptions of young people who considered themselves to have a disability were broadly similar to those who did not in most areas.
• Young people who considered themselves to have a disability were more likely to turn to a teacher or a member of the education staff if they had a problem than those who did not (25% compared with 5%).
• No young people who considered themselves to have a disability reported feeling too scared or intimidated to make a complaint, compared with 10% of young people who did not consider themselves to have a disability.
• Young people who considered themselves to have a disability were more likely to report victimisation by other young people because they were from the Traveller community (5% compared with 0%) or because of their disability (5% compared with 0%). • Twelve per cent of young people who considered themselves to have a disability
31
APPENDICES
APPENDIX A: SECURE TRAINING CENTRE ANALYSIS, 2012–13
KEY TO TABLES
Hassockfield 2013 Medway 2012 Oakhill 2013 Rainsbrook 2012 Overall
The best score across establishments
The worst score across establishments
Number of completed questionnaires returned 23 46 39 40 148
SECTION 1: ABOUT YOU
1.1 Are you aged under 16? 23% 39% 38% 47% 39%
1.2 Are you from a minority ethnic group? (including all those who did not tick White British, White Irish or White other category)
18% 55% 61% 29% 44%
1.3 Are you Muslim? 3% 19% 39% 11% 21%
1.4 Do you consider yourself to be Gypsy/Romany/Traveller? 3% 22% 11% 8% 12%
1.5 Are you a foreign national? 0% 11% 5% 3% 6%
1.6 Do you think that you have a disability? 19% 21% 19% 16% 19%
SECTION 2: YOUR TRIP HERE AND FIRST 24 HOURS
2.1 On your most recent journey here, did you feel that staff were looking after you? 88% 93% 97% 88% 92%
2.2 When you were searched, was this carried out in a respectful way? 88% 89% 88% 83% 87%
On your first night here:
2.3 Were you seen by a health services worker before you went to bed? 97% 81% 97% 100% 93%
2.4 Were you able to talk to someone about how you were feeling? 73% 45% 56% 63% 57%
2.5 Did you feel safe? 91% 82% 95% 84% 88%
SECTION 3: DAILY LIFE
3.1 Is the food here good/very good? 58% 23% 29% 22% 29%
If you had a problem, who you would turn to?
3.2a No one 10% 16% 22% 13% 16%
3.2b Teacher/education staff 3% 4% 16% 8% 8%
3.2c Key worker 13% 25% 42% 33% 31%
3.2d Caseworker 37% 31% 31% 29% 31%
3.2e Staff on the unit 57% 47% 42% 52% 48%
3.2f Another young person here 13% 20% 8% 8% 12%
3.2g Family 43% 64% 37% 48% 49%
32
APPENDICES
APPENDIX A: SECURE TRAINING CENTRE ANALYSIS, 2012–13
KEY TO TABLES
The best score across establishments
The worst score across establishments
For those who said they had a key worker:
3.3 Are you able to see your key worker when you want to? 89% 79% 95% 79% 85%
3.4 Does your key worker try to help you? 96% 91% 97% 86% 92%
3.5 Do most staff treat you with respect? 88% 80% 97% 87% 88%
3.6 Are your religious and cultural views respected? 77% 88% 95% 71% 83%
3.7 Can you attend religious services? 35% 80% 89% 64% 72%
3.8 Is it easy to keep in touch with family? 97% 79% 77% 87% 83%
SECTION 4: BEHAVIOUR
Hassockfield 2013
4.1 Do you know what the rewards and sanctions scheme is? 91% 93% 92% 100% 95%
4.2 Do you think the rewards and sanctions scheme is fair? 81% 46% 77% 67% 66%
Medway 2012
4.3 If you get in trouble, do staff explain why? 77% 81% 92% 83% 84%
Have you been placed in close supervision or
4.4 41% 43% 29% 36% 37%
Oakhill 2013
single separation here?
Have you been physically restrained (PCC) since
4.5 59% 25% 23% 26% 30%
you have been here?
Rainsbrook 2012
SECTION 5: HEALTH SERVICES
If you feel ill, are you able to see a health service
5.1 91% 85% 97% 97%
Overall
92%
worker?
5.2 Do you think that the health services are good here? 82% 31% 84% 71% 64% SECTION 6: COMPLAINTS
6.1 Do you know how to make a complaint? 97% 93% 96% 95% 95%
For those who have made a complaint:
6.2 Are complaints dealt with fairly? 55% 44% 59% 75% 56%
Have you ever felt too scared or intimidated to
6.3 0% 9% 5% 16% 8%
make a complaint?
SECTION 7: EDUCATION AND ACTIVITIES
Do you have a training plan, sentence plan or
7.1 70% 71% 61% 49% 62%
remand plan?
Are you encouraged to take part in activities outside
7.2 82% 71% 97% 86% 84%
education hours?
7.3 Have you been given career advice here? 77% 49% 68% 61% 61%
7.4 Have you been able to learn work-related skills here? 66% 56% 72% 63% 64%
Do you think your education here will help you once
7.5 65% 54% 75% 76% 67%
33
APPENDICES
KEY TO TABLES
Hassockfield 2013 Medway 2012 Oakhill 2013 Rainsbrook 2012 Overall
The best score across establishments
The worst score across establishments
SECTION 8: SAFETY
8.1 Have you ever felt unsafe here? 12% 30% 8% 26% 20%
8.2 Do you feel unsafe at the moment? 9% 14% 8% 5% 9%
8.3 Have you ever been bullied or victimised by another young person or group of young people here? 18% 24% 11% 22% 19%
If you have felt bullied or victimised by another young person/group of young people, did the incident involve:
8.4a Insulting remarks? 3% 16% 3% 10% 9%
8.4b Physical abuse? 9% 9% 3% 10% 8%
8.4c Sexual abuse? 3% 0% 0% 3% 1%
8.4d Feeling threatened or intimidated? 9% 11% 0% 9% 7%
8.4e Having your canteen/property taken? 3% 3% 3% 0% 2%
8.4f Medication? 3% 0% 0% 0% 0%
8.4g Drugs? 3% 4% 0% 0% 2%
8.4h Your race or ethnic origin? 9% 0% 0% 3% 2%
8.4i Your religion or religious beliefs? 9% 0% 0% 0% 1%
8.4j Your nationality? 9% 3% 0% 0% 2%
8.4k Being from a different part of the country than others? 9% 3% 0% 0% 2%
8.4l Being from a Traveller community? 3% 3% 0% 0% 1%
8.4m Your sexual orientation? 3% 3% 0% 0% 1%
8.4n Your age? 3% 0% 0% 0% 0%
8.4o You having a disability? 3% 3% 0% 0% 1%
8.4p You being new here? 3% 14% 0% 9% 7%
8.4q Your offence/crime? 3% 7% 0% 0% 3%
8.4r Gang-related issues? 3% 0% 0% 3% 1%
8.5 Have you ever been bullied or victimised by a member of staff or group of staff members here? 13% 18% 3% 17% 13%
If you have felt bullied or victimised by a member of staff/group of staff members, did the incident involve:
8.6a Insulting remarks? 3% 9% c0% 9% 5%
8.6b Physical abuse? 0% 7% 3% 3% 4%
8.6c Sexual abuse? 0% 0% 0% 0% 0%
8.6d Feeling threatened or intimidated? 0% 4% 0% 5% 3%
34
APPENDICES KEY TO TABLES
Hassockfield 2013 Medway 2012 Oakhill 2013 Rainsbrook 2012 Overall
The best score across establishments
The worst score across establishments
8.6e Having your canteen/property taken? 0% 3% 0% 3% 2%
8.6f Medication? 0% 0% 0% 0% 0%
8.6g Drugs? 0% 0% 0% 0% 0%
8.6h Your race or ethnic origin? 3% 3% 0% 3% 2%
8.6i Your religion or religious beliefs? 3% 3% 0% 0% 1%
8.6j Your nationality? 3% 3% 0% 0% 1%
8.6k Being from a different part of the country than others? 3% 0% 0% 0% 1%
8.6l Being from a Traveller community? 3% 0% 0% 0% 1%
8.6m Your sexual orientation? 0% 0% 0% 0% 0%
8.6n Your age? 0% 0% 0% 0% 0%
8.6o You having a disability? 0% 3% 0% 0% 1%
8.6p You being new here? 0% 3% 0% 5% 2%
8.6q Your offence/crime? 0% 3% 0% 3% 2%
8.6r Gang-related issues? 0% 3% 0% 3% 1%
8.6s Because you made a complaint? 0% 0% 0% 3% 1%
8.7 If you were being bullied or victimised, would you tell a member of staff? 65% 62% 41% 59% 56%
8.8 Do you think staff would take it seriously if you told them you were being bullied or victimised? 81% 64% 84% 86% 78%
35
APPENDICES
APPENDIX B: EXPERIENCES OF YOUNG WOMEN, COMPARED WITH YOUNG MEN, 2012–2013
KEY TO TABLES
YOUNG WOMEN YOUNG MEN
Significantly better for young women Significantly worse for young women
A significant difference in background details
Percentages which are not highlighted show there is no significant difference
Number of completed questionnaires returned 20 126
SECTION 1: ABOUT YOU
1.1 Are you aged under 16? 26% 41%
1.2
Are you from a minority ethnic group? (including all those who did not tick White British, White Irish or White other category)
41% 43%
1.3 Are you Muslim? 7% 23%
1.4 Do you consider yourself to be Gypsy/Romany/Traveller? 17% 12%
1.5 Are you a foreign national? 10% 5%
1.6 Do you think that you have a disability? 17% 19%
SECTION 2: YOUR TRIP HERE AND FIRST 24 HOURS
2.1 On your most recent journey here, did you feel that staff were looking after you? 94% 92%
2.2 When you were searched, was this carried out in a respectful way? 94% 85%
On your first night here:
2.3 Were you seen by a health services worker before you went to bed? 90% 93%
2.4 Were you able to talk to someone about how you were feeling? 65% 55%
2.5 Did you feel safe? 74% 89%
SECTION 3: DAILY LIFE
3.1 Is the food here good/very good? 25% 30%
If you had a problem, who you would turn to?
3.2a No one 10% 17%
3.2b Teacher/education staff 6% 9%
3.2c Key worker 26% 31%
3.2d Caseworker 26% 33%
3.2e Staff on the unit 55% 48%
3.2f Another young person here 50% 7%
3.2g Family 71% 45%
3.3 Do most staff treat you with respect? 94% 86%
3.4 Are your religious and cultural views respected? 83% 84%
3.5 Can you attend religious services? 70% 74%
36
APPENDICES
APPENDIX B: EXPERIENCES OF YOUNG WOMEN, COMPARED WITH YOUNG MEN, 2012–2013
SECTION 4: BEHAVIOUR
4.1 Do you know what the rewards and sanctions scheme is? 100% 94% 4.2 Do you think the rewards and sanctions scheme is fair? 69% 65% 4.3 If you get in trouble, do staff explain why? 79% 85%
4.4 Have you been placed in close supervision or single separation here? 30% 39%
4.5 Have you been physically restrained (PCC) since you have been here? 20% 31%
SECTION 5: HEALTH SERVICES
5.1 If you feel ill, are you able to see a health service worker? 94% 92% 5.2 Do you think that the health services are good here? 44% 68%
SECTION 6: COMPLAINTS
6.1 Do you know how to make a complaint? 93% 94%
6.2 Have you ever felt too scared or intimidated to make a complaint? 16% 8%
SECTION 7: EDUCATION AND ACTIVITIES
7.1 Do you have a training plan, sentence plan or remand plan? 59% 63%
7.2 Are you encouraged to take part in activities outside education hours? 69% 86%
7.3 Have you been given career advice here? 44% 63%
7.4 Have you been able to learn work-related skills here? 63% 63%
7.5 Do you think your education here will help you once you leave? 59% 68%
SECTION 8: SAFETY
8.1 Have you ever felt unsafe here? 31% 19%
8.2 Do you feel unsafe at the moment? 6% 10%
8.3 Have you ever been bullied or victimised by another young person or group of young people here? 31% 17%
If you have felt bullied or victimised by another young person/group of young people, did the incident involve:
8.4a Insulting remarks? 26% 7%
8.4b Physical abuse? 6% 8%
8.4c Sexual abuse? 6% 1%
8.4d Feeling threatened or intimidated? 16% 6%
8.4e Having your canteen/property taken? 0% 3%
8.4f Medication? 0% 1%
8.4g Drugs? 0% 3%
8.4h Your race or ethnic origin? 0% 2%
8.4i Your religion or religious beliefs? 0% 2%
8.4j Your nationality? 0% 2%
8.4k Being from a different part of the country than others? 6% 2%
37
APPENDICES
APPENDIX B: EXPERIENCES OF YOUNG WOMEN, COMPARED WITH YOUNG MEN, 2012–2013
8.4m Your sexual orientation? 6% 1%
8.4n Your age? 0% 1%
8.4o You having a disability? 0% 2%
8.4p You being new here? 26% 4%
8.4q Your offence/crime? 6% 3%
8.4r Gang-related issues? 0% 2%
8.5 Have you ever been bullied or victimised by a member of staff or group of staff members here? 6% 14%
If you have felt bullied or victimised by a member of staff/group of staff members, did the incident involve:
8.6a Insulting remarks? 6% 6%
8.6b Physical abuse? 0% 4%
8.6c Sexual abuse? 0% 0%
8.6d Feeling threatened or intimidated? 0% 3%
8.6e Having your canteen/property taken? 6% 1%
8.6f Medication? 0% 0%
8.6g Drugs? 0% 0%
8.6h Your race or ethnic origin? 0% 3%
8.6i Your religion or religious beliefs? 0% 2%
8.6j Your nationality? 0% 2%
8.6k Being from a different part of the country than others? 0% 1%
8.6l Being from a Traveller community? 0% 1%
8.6m Your sexual orientation? 0% 0%
8.6n Your age? 0% 0%
8.6o You having a disability? 0% 1%
8.6p You being new here? 0% 3%
8.6q Your offence/crime? 0% 2%
8.6r Gang-related issues? 0% 1%
8.6s Because you made a complaint? 0% 1%
8.7 If you were being bullied or victimised, would you tell a member of staff? 65% 55%
8.8 Do you think staff would take it seriously if you told them you were being bullied or victimised? 79% 77%
38
APPENDICES
APPENDIX C: EXPERIENCES OF BLACK AND MINORITY ETHNIC YOUNG PEOPLE, COMPARED WITH WHITE YOUNG PEOPLE, 2012–13
KEY TO TABLES
BLACK AND
MINORITY ETHNIC YOUNG PEOPLE WHITE YOUNG
PEOPLE
Significantly better for black and minority ethnic young people
Significantly worse for black and minority ethnic young people
A significant difference in background details
Percentages which are not highlighted show there is no significant difference
Number of completed questionnaires returned 63 83
SECTION 1: ABOUT YOU
1.1 Are you aged under 16? 42% 38%
1.3 Are you Muslim? 41% 6%
1.4 Do you consider yourself to be Gypsy/Romany/Traveller? 0% 21%
1.5 Are you a foreign national? 3% 8%
1.6 Do you think that you have a disability? 11% 25%
SECTION 2: YOUR TRIP HERE AND FIRST 24 HOURS
2.1 On your most recent journey here, did you feel that staff were looking after you? 89% 94%
2.2 When you were searched, was this carried out in a respectful way? 84% 89%
On your first night here:
2.3 Were you seen by a health services worker before you went to bed? 94% 92%
2.4 Were you able to talk to someone about how you were feeling? 57% 58%
2.5 Did you feel safe? 90% 87%
SECTION 3: DAILY LIFE
3.1 Is the food here good/very good? 23% 34%
If you had a problem, who would you turn to?
3.2a No one 21% 11%
3.2b Teacher/education staff 3% 13%
3.2c Key worker 26% 34%
3.2d Caseworker 30% 33%
3.2e