Children and Young People in Custody
2012–13
An analysis of 15–18-year-olds’ perceptions of their experiences
in young offender institutions
Children and Young People in Custody
2012–13
An analysis of 15–18-year-olds’ perceptions of their experiences
in young offender institutions
2
ACKNOWLEDGEMENTS
Acknowledgements
HM Inspectorate of Prisons owes thanks to all the young people who took the time to complete our survey and offer their experiences for analysis.
The research and development team at HM Inspectorate of Prisons also appreciates the help given by staff at each young offender institution.
The members of the research, development and thematic team who contributed to the collection and analysis of data over the year were:
Samantha Booth Jessica Broughton Hayley Cripps Annie Crowley Caroline Elwood Chloe Flint Ewan Kennedy Olayinka Macauley Rachel Murray Laura Nettleingham Danielle Pearson Amy Radford Helen Ranns Alissa Redmond Alice Reid Nalini Sharma Catherine Shaw Joe Simmonds
© Crown copyright 2013
You may re-use this information (excluding logos) free of charge in any format or medium, under the terms of the Open Government Licence. To view this licence, visit http://www.nationalarchives.gov.uk/doc/open-government-licence/ or e-mail: [email protected]
Where we have identified any third party copyright information you will need to obtain permission from the copyright holders concerned.
Any enquiries regarding this publication should be sent to us at [email protected] or HMI Prisons, Victory House, 6th floor, 30-34 Kingsway, London WC2B 6EX.
You can download this publication from http://www.justice.gov.uk/publications/inspectorate-reports/hmi-prisons/ juvenile-survey
ISBN: 9780108560088
Printed in the UK by The Stationery Office Limited
on behalf of the Controller of Her Majesty’s Stationery Office
ID 2604451 12/13
3
CONTENTS
Foreword
7Main findings
101
Introduction
171.1 Background to children and young people in young offender institutions 17
1.2 Background to the report 18
1.3 Scope of the report 18
1.4 Methodology 19
2
The children and young people’s estate
202.1 Establishments holding young men 20
2.2 Establishments holding young women 22
3
Young people in custody
243.1 Introduction 24
3.2 Profile of young men surveyed 24
3.3 How has the profile of young men changed since 2011–12? 28
3.4 Profile of young women surveyed 28
3.5 How has the profile of young women changed since 2011–12? 30
4
Safety
314.1 Courts, transfers and escorts 31
4.2 Early days in custody 32
4.3 First night 36
4.4 Induction 37
4.5 Bullying and victimisation 37
4.6 Have you been victimised in this establishment? 38
4.7 Behaviour management 44
4.8 Discipline 46
4.9 Substance misuse 48
5
Respect
505.1 Residential units 50
5.2 Applications 51
5.3 Faith and religious activity 52
5.4 Access to other services 53
5.5 Relationships between staff and children and young people 53
5.6 Personal officers 55
5.7 Complaints 56
5.8 Health services 58
6
Purposeful activity
606.1 Learning and skills 60
6.2 Physical education and health promotion 65
4
CONTENTS
7
Resettlement
687.1 Children, families and contact with the outside world 68
7.2 Training planning and remand management 70
7.3 Plans for release 72
8
Young people in custody – have things improved?
768.1 Background to the analysis 76
8.2 Summary of changes 76
9
Diversity
819.1 Introduction 81
9.2 The experiences of black and minority ethnic young men 81
9.3 Differences between respondents 81
9.4 The experiences of Muslim young men 86
9.5 Differences between respondents 86
9.6 The experiences of young men who considered themselves to have a disability 90
9.7 Differences between respondents 90
9.8 The experiences of young men who reported having been in local authority care 93
9.9 Differences between respondents 93
Appendices
96A Experiences of young men in 2012–13 compared with 2011–12 96
B Establishment analysis – young men, 2012–13 102
C Experiences of black and minority ethnic young men, compared with white young men,
2012–13 115
D Experiences of Muslim young men compared with non-Muslim young men, 2012–13 123
E Comparison between young men who considered themselves to have a disability and
those who did not, 2012–13 131
F Comparison of young men who said they had been in local authority care compared with
those who did not, 2012–13 139
G Experiences of young women in 2012–13 compared with 2011–12 147
5
REFERENCES
REFERENCES
List of tables
1 Samples from the male estate 24
2 Samples from the female estate 24
3 Breakdown of ethnic groups of young men sampled 26
4 Breakdown of ethnic groups of young women sampled 29
5 Types of victimisation by other young men 39
6 Types of victimisation by staff 41
List of figures
1 Age of young men sampled 25
2 Ethnicity of young men sampled 25
3 Religious beliefs of young men sampled 26
4 Young men’s experience of education 27
5 Ethnicity of young women sampled 28
6 Religious beliefs of young women sampled 29
7 Experience of reception 32
8 Young men’s problems and help offered on arrival 33
9 Young women’s problems and help offered on arrival 34
10 Facilities offered to young men on arrival 35
11 Facilities offered to young women on arrival 35
12 Young people who said they felt safe on their first night 37
13 Young people who reported that they felt/had felt unsafe in their establishment 38
14 If you were being victimised, would you tell a member of staff? 43
15 Young men’s reward scheme levels 44
16 Young women’s reward scheme levels 44
17 Experience of the rewards scheme 45
18 Have you ever been disciplined in the establishment? 47
19 Young people reporting problems with alcohol and drugs 48
20 Young men’s perception of daily life 50
21 Young people who felt applications were dealt with fairly and promptly 51
22 Respect for religious beliefs 52
23 Relationships with staff 54
24 Young men – if you had a problem, who would you turn to? 54
25 Young women – if you had a problem, who would you turn to? 55
26 Contact with personal officers 56
27 Young people who felt complaints were dealt with fairly and promptly 57
28 Young people who found it easy to access health services 58
29 Young people who reported having emotional or mental health problems 59
6
REFERENCES
31 Young people involved in a job 62
32 Young people involved in vocational or skills training 63
33 Young people involved in offending behaviour programmes 64
34 Young people not involved in an activity at the time of the survey 64
35 Young people involved in each type of activity 65
36 Young people who told us they could exercise outside daily 66
37 Young men – how many times do you go to the gym each week? 66
38 Young people who told us they had association every day 67
39 Young people who said they could access the telephone every day 68
40 Young people’s experience of visits 69
41 Young people who said they had a training, sentence or remand plan and of these, how involved they had been in its development
71
42 Young men – do you think you will have any problems once released and do you know who to contact for help?
73
43 Young women – do you think you will have any problems once released and do you know who to contact for help?
74
44 Young men – what is most likely to stop you offending in the future? 74
45 Young women – what is most likely to stop you offending in the future? 75
46 Young men’s perception of daily life, 2009–2013 77
47 Young men’s perceptions of staff relationships, 2009–2013 78
48 Young men who told us it was easy to make an application/complaint 79
49 Young men who said they got visits from family or friends, 2010–13 79
50 Young men who knew who to contact for help with specific problems on release 80
51 Black and minority ethnic young men and white young men who said they knew who to contact for help in their establishment in each area of resettlement
7
FOREWORD
Foreword
This is the ninth review HM Inspectorate of Prisons has published jointly with the Youth Justice Board (YJB) examining the perceptions of young men and women detained in young offender institutions (YOIs) across England and Wales. Throughout each year, HM Inspectorate of Prisons conducts surveys in each YOI holding children and young people aged between 15 and 18. This report summarises the responses of 942 young men and 16 young women, representing 76% of young men and 88% of young women held in custody at the time of our surveys. This report is published simultaneously with our first report looking at the perceptions of children and young people held in secure training centres (STCs) and should be read in conjunction with it.
During the reporting period (April 2012 to March 2013) there were significant developments in the youth justice estate.
Since 2011–12, the number of young people aged 18 and under in custody dropped by just over 28% to 1,420 in March 2013.1 Those held in young offender institutions made up the majority of those in custody and there was a similar 32% drop over the reporting period with 1,044 young men and women being held in March 2013.2 This period saw the decision to decommission a further 360 places by re-roling HMYOI Ashfield into a category C male prison, and by the end of May 2013 the young men held at Ashfield had been moved to other locations. This period between 2012 and 2013 was the last period that young women were held in YOIs. In July 2013, the decision was taken to decommission the remaining female YOI units and hold all young women in STCs and secure children homes (SCHs).
At the time this report was prepared, the government was considering plans for major changes to youth custody arrangements. This report is the authentic voice of some of our most troubled young people who are held in the current facilities. It should inform Ministers as they finalise their plans and be of use to the managers of individual centres, the YJB, academics, policy makers and others with an interest in the detention of children and young people.
Our inspection findings in 2012–13 broadly suggest that establishments were delivering improved treatment and conditions to most young people held, but were struggling to manage some of the most challenging or vulnerable young people safely. Considering the different establishments surveyed and their range in size, intake and roles, the results from the surveys unsurprisingly demonstrate variation in young people’s perceptions of custody. However, the overall picture for young men this year was of improvement in their perceptions across almost all areas of life in custody, with significantly better responses to 35% of questions and significantly worse responses to 10% of questions compared to last year. It is not possible to definitively explain this improvement. It is likely to largely reflect actual improvements in the treatment and conditions of most young men and this may be a reflection of the reduced populations held in many of the YOIs. It is worth noting that in this reporting period there were a significantly higher proportion of sentenced young men than in the previous year and a higher proportion were aged 18. It may therefore be that the population was a little more stable and mature than in the previous year.
8
FOREWORD
However, the vulnerability of many of the young men held is clear. A third had been in local authority care and almost nine out of 10 had been excluded from school; more than a third had not been at school since they were 14. One in five said they had emotional or mental health problems, 10% said they had a problem with alcohol and 34% said they had a problem with drugs. A quarter said they had no one to turn to if they had a problem, almost a third said they had not felt safe in the establishment at some time and one in 10 said they did not feel safe at the time of the survey. More than one in five said they had been bullied by other young people or victimised by staff.
Notwithstanding the vulnerabilities and concerns of a significant minority of young men in all areas, the improvements identified in this report are very welcome. In particular, 74% of young men said most staff treated them with respect compared with 64% in 2011–12 and more said staff had checked on them personally in the last week (43% compared with 35%). A smaller proportion said they had been physically restrained (30% compared with 37%) and those who had spent time in care and separation were more likely to say staff had treated them well (48% compared with 38%).
The most concerning area where young men’s perceptions of their treatment had deteriorated was in preparation for release. Young men overwhelmingly (90%) told us that they wanted to stop offending on release and believed that the key things that would prevent them getting into further trouble were getting a job (46%), having a partner (30%), having something to do that wasn’t crime (28%), the sentence they were serving (28%) and getting into school or college (28%). However, a higher proportion than last year thought they would have problems getting a job on release and a lower proportion knew where to get help with a range of problems they anticipated on release. These perceptions have deteriorated over the last four years. Despite this, 51% felt they had done something in the establishment that would make them less likely to offend in the future, compared with 45% in 2011–12.
The population of young men who said they were from a black and minority ethnic background remained stable at 45% of those surveyed. Overall, they were less likely to report vulnerabilities than white young men. However, their perceptions were worse than young men from white backgrounds across almost all areas of their treatment and conditions. Sixty-five per cent of young men from black and minority ethnic backgrounds said most staff treated them with respect compared with 81% of white young men. They were less likely to report being on the top level of the rewards scheme (27% compared with 36%) and less likely to feel they had been treated fairly under the scheme (44% compared with 58%).
9
FOREWORD
Similar to last year, nearly a third (33%) of young men surveyed said they had been looked after by a local authority at some point. The consistency of this figure since last year continues to reflect the over representation of looked after children in contact with the criminal justice system and wider experiences of disadvantage. They have more positive perceptions of entering establishments and navigating daily life but a greater proportion report drug, alcohol or emotional and mental health problems and victimisation by other young people, and are more likely to anticipate problems across all areas of resettlement. Positively, compared with 2011–12, higher proportions of young men who had been in care reported that most staff treated them with respect and that their personal officer tried to help them.
The number of young women held in custody is very small and reduced further in 2012–13. Young women are detained in small units which are often a long way from home. The views from the surveys were very similar to the previous reporting period with some deterioration in terms of problems contacting family on arrival. However, there was improvement in the proportion of young women reporting one or more visits per week. Three very clear messages are apparent from this year’s survey findings. First, young people have been better able to navigate the experience of custody itself. Second, that there are significant minorities of young people, such as those with protected
characteristics or who are vulnerable for some other reason, for whom this is not true and the variation across establishments is too wide. It is in these exceptions that the greatest risks lie. Third, young people may be generally able to manage the experience of custody better but they are more anxious about how they will manage after release. They want to get a job and stay out of trouble but too many do not know where to go to get the help they need.
Nick Hardwick
10
MAIN FINDINGS
Main findings
This section provides an overview of the key findings from all analyses conducted for the 2012–13 reporting period. It sets out the findings that are most important in understanding young people’s experiences of custody and those where significant differences exist
between different groups of young people, for example, responses from young people who reported that they had a disability and those who did not, or responses from black and minority ethnic young people compared with white young people. Where the range of results across all establishments is quoted, this excludes the Keppel Unit because the young people held there were not typical of the YOI population as a whole. Full survey analysis can be found in the appendices.
Young people – demographic findings
Young men
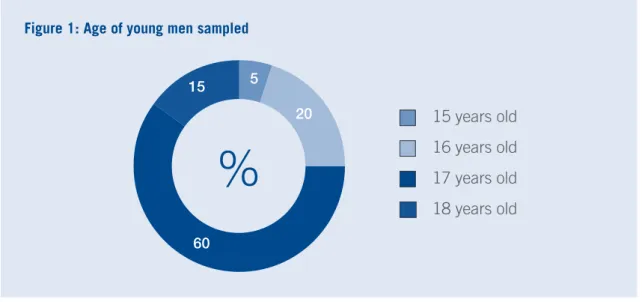
Five per cent of young men said they were 15 years old, a fifth (20%) reported that •
they were 16. Over half (60%) said that they were 17 years old and 15% told us that they were 18.
Forty-five per cent of young men said they were from a black or minority ethnic •
background.
Twenty-two per cent of young men described themselves as Muslim, similar to last •
year.
Four per cent of young men said they were foreign nationals. •
Five per cent of young men considered themselves Gypsy, Romany or Traveller. •
Sixteen per cent of young men considered themselves to have a disability, a rise from •
11% in 2011–12.
More than half (56%) of the young men said it was their first time in custody, similar •
to last year but a significantly higher proportion said they were sentenced (81% compared with 75%).
Of those who said that they were sentenced, 42% said that their sentence was 12 •
months or less, lower than the 49% of young men who reported this in 2011–12. A third of young men said they had spent time in local authority care.
•
Young women
Nearly all (92%, n=15) of the young women surveyed in 2012–13 said they were 17 •
years old, and 8% (n=1) stated that they were 18.
Sixty-five per cent (n=10) of young women said they were from a white background •
and 35% (n=6) reported they were from a black and minority ethnic background. Seventeen per cent (n=3) of the young women told us that they considered themselves •
to have a disability.
Fifty-six per cent (n=5) of young women who told us they were sentenced said their •
sentence was less than 12 months. Another 11% (n=1) reported that they were serving a sentence of more than 12 months and up to two years.
Sixty-one per cent (n=9) of young women surveyed told us that they had spent time in •
11
MAIN FINDINGS
Experiences of young men
Safety
Only 53% of young men reported that they were treated well or very well by escort staff. •
Thirty-six per cent said they had travelled with adults or women, a rise from 26% in 2011–12.
Three-quarters (75%) of young men told us that they were seen by a doctor or nurse •
before they were locked up on their first night, compared with 69% in 2011–12. The number of young men reporting that they felt safe on their first night increased to •
82%, from 78% in 2011–12.
A smaller proportion of young men reported that they had been physically restrained •
(30% down from 37% in 2011–12).
Only half (48%) of young men who said they had been in care and separation felt the •
staff had treated them well or very well (although this was higher than the 38% who said the same in 2011–12).
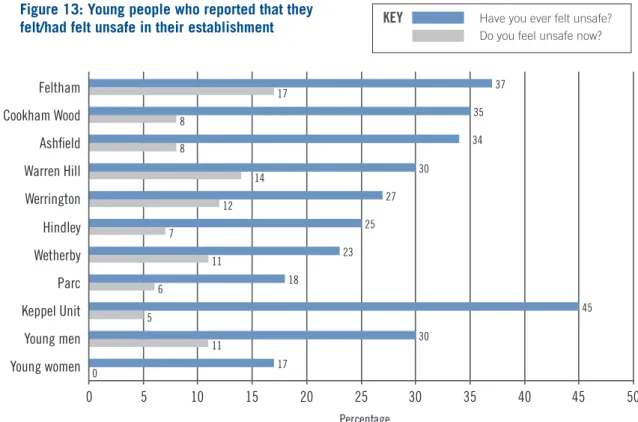
Thirty per cent of young men said they had felt unsafe at their establishment, ranging •
from 37% at one establishment to 18% at another. Eleven per cent did not feel safe at the time of the survey.
A fifth (22%) said they had been victimised by other young men and 22% said that •
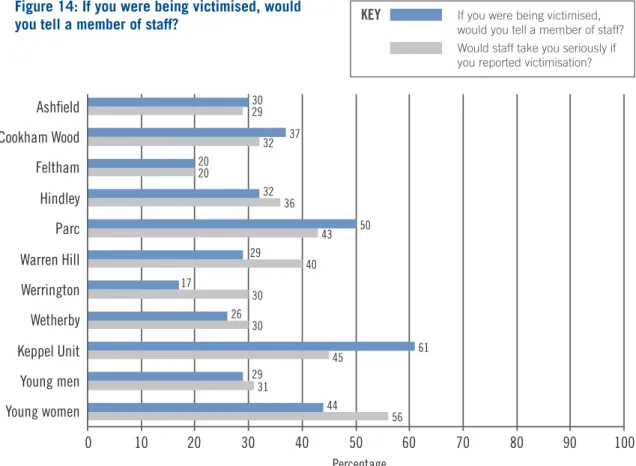
they had been victimised by staff. Only 29% said they would tell a member of staff if they were being victimised.
Ten per cent of young men said they had a problem with alcohol when they first arrived •
at the establishment and 34% said they had a problem with drugs. Respect
Seventy-one per cent of young men across the estate reported that they could have a •
shower every day, though this ranged from all of the young men at Parc to only 27% at Wetherby.
Only 41% reported that their cell call bell was normally answered within five minutes. •
Only 18% said the food was good or very good. •
A higher proportion of young men said that they found it easy to attend religious •
services (62%) and that they could speak to a chaplain of their faith in private (71%), compared with 56% and 67% respectively in 2011–12.
Three-quarters (74%) of young men said that most staff treated them with respect, a •
rise from 64% in 2011–12. Between establishments this ranged from a low of 59% at Feltham to 84% at Wetherby. The proportion of young people who said that staff had checked on them personally in the last week rose from 35% in 2011–12 to 43% in 2012–13.
A quarter of young men said they had no one to turn to if they had a problem. •
The proportion of young men who said it was easy to make a complaint decreased to •
55% (from 63% in 2011–12).
Sixty per cent of the young people who had used health services said the service was •
good or very good.
A lower proportion of young men reported that they had emotional or mental health •
12
MAIN FINDINGS
Purposeful activity
Almost one in 10 young people (9%) said they did not have a job and were not taking •
part in education, vocational training or offending behaviour programmes. This ranged from 19% to 5% across establishments. Two-thirds (66%) of young people who had been involved in education, 55% of those who had had a job, 53% of those who had been involved in vocational training and 52% of those who had been involved in offending behaviour programmes thought these would help them on release.
Three-quarters (76%) of young men reported that they usually had association every •
day.
Only 45% said that they could usually go outside for exercise every day, ranging from •
94% at Parc to only 5% at Werrington. Resettlement
Only 79% of young men said they received visits compared with 97% in 2011–12 and •
only 37% reported that they had one or more visits from family or friends each week. Fifty-three per cent of young men said they had a training, sentence or remand plan •
and of these, 85% said they had been involved in its development and 95% said they understood the targets set out in the plan.
There was a rise in the number of young men who felt they would have problems with •
getting a job, from 49% in 2011–12 to 55% in 2012–13.
Young men reported less knowledge of where to get help regarding a range of •
resettlement issues, including how to find accommodation (28% compared with 38% in 2011–12), getting into school or college (27% compared with 44% in 2011–12) and getting job (34% compared with 41% in 2011–12).
Ninety per cent of young men wanted to stop offending on release and the five most •
common motivations identified by sentenced young men as most likely to stop them offending in the future were getting a job (46%), having a partner (30%), having something to do that isn’t crime (28%), the sentence they were serving (28%) and getting into school or college (28%).
Half (51%) of young men said that something had happened to them in the •
establishment that would make them less likely to offend in the future, a rise from 45% in 2011–12.
Experiences of young women
Safety
All of the young women reported feeling safe on their most recent journey (n=16), an •
increase from 67% (n=17) who reported the same in 2011–12.
Sixty-five per cent (n=10) of young women reported that on arrival they had problems •
contacting family, higher than the 20% (n=4) in 2011–12 who reported the same. However, 87% (n=11) of young women were asked by staff if they needed help with contacting family, an improvement from 50% (n=12) in 2011–12.
Seventeen per cent of young women (n=3) reported that they had felt unsafe in their •
establishment and the same number reported they had been victimised by another young person.
Twenty-two per cent (n=4) said that they had been victimised by staff within their •
13
MAIN FINDINGS
• Twelve per cent (n=2) of young women said that they had an alcohol problem on arrival at the establishment and 41% (n=6) said they had a drug problem.
Respect
Seventy-one per cent (n=11) of young women said they could speak to a member of •
the Independent Monitoring Board (IMB), compared with 26% (n=6) in 2011–12. Half (50%, n=8) said they could speak to a peer mentor and 78% (n=12) to a chaplain of their faith in private.
Just over half (56%, n=9) reported that it was easy to make a complaint, which was a •
decrease from 85% (n=20) in 2011–12.
Over three-quarters (78%, n=12) of young women said that most staff treated them •
with respect.
Of those who had been to health services, 77% (n=11) reported the quality of the •
service to be good/very good. Purposeful activity
All the young women who answered the question said they were taking part in •
education (n=15), and 71% (n=11) thought it would help them on release.
Less than a fifth (18%, n=3) reported that they were in a job and 39% (n=6) told us •
they were taking part in offending behaviour programmes.
Nearly all the young women (94%, n=14) reported that they usually had association •
every day and just over half (53%, n=8) said they went to the gym more than five times a week.
Resettlement
Under half (44%, n=7) of the young women surveyed said that they usually got one or •
more visits per week. This was an increase, however, from 12% (n=3) in 2011–12. Nearly all (89%, n=14) reported that they could use the telephone every day. A third •
(33%, n=6) reported they had problems sending or receiving letters or parcels. A smaller proportion of young women (11%, n=2) said they anticipated problems with •
claiming benefits in 2012–13 than in 2011–12 (36%, n=8).
Only a quarter (24%, n=3) said that they had had a say in what would happen to them •
when they were released.
Experiences of black and minority ethnic young men
Safety
Thirty-six per cent of black and minority ethnic young men reported that they had been •
physically restrained, higher than the 25% of white young men who reported the same. The proportion of black and minority ethnic young men who reported that they felt •
unsafe at the time of the survey was higher than that of white young men (13% compared with 9%).
A smaller proportion of young men from a black and minority ethnic background said •
they would tell a member of staff if they were being victimised (21% compared with 35% of white young men).
Six per cent of black and minority ethnic young men reported that staff had victimised •
14
MAIN FINDINGS
Respect
A smaller proportion of young men from black and minority ethnic backgrounds •
(27%) than white young men (36%) reported they were on the top level of the reward scheme.
Black and minority ethnic young men were less likely than white young men to report •
that most staff treated them with respect (65% compared with 81%).
Seventy per cent of black and minority ethnic young men said it was easy to make an •
application compared with 87% of white young men. Fifty-one per cent of black and minority ethnic young men reported that it was easy to make a complaint compared with 59% of white young men. The perceptions of black and minority ethnic young men remained similar to those in 2011–12, whereas the perceptions of white young men had improved.
As found in previous years, young men from black and minority ethnic backgrounds •
reported more positively about access to religious services (66% compared with 59% of white young men felt that it was easy to attend religious services) and 73% felt that their religious beliefs were respected (compared with 48% of white young men). Purposeful activity
A smaller proportion of black and minority ethnic young men reported that they had a •
job (23% compared with 32% of white young men), or were involved in vocational or skills training (13% compared with 22%) or offending behaviour programmes (20% compared with 27%).
Resettlement
Although only 37% of black and minority ethnic young men reported that they had one •
or more visits from family and friends each week, this was similar to the 39% of white young men who reported the same and was therefore an improvement from 2011–12 where the results for black and minority ethnic young men were significantly worse compared with their white counterparts (31% compared with 39%).
A smaller proportion of young men from black and minority ethnic backgrounds said •
that they had a say in what was going to happen to them when they were released (35% compared with 46% of white young men).
Black and minority ethnic young men were less likely to report that they knew who to •
go to for help with their resettlement needs across most areas.
Experiences of Muslim young men
Safety
In 2011–12, a significantly higher proportion of Muslim young men than non-•
Muslim young men reported that they had been physically restrained (44% and 36% respectively). This gap had narrowed in 2012–13 and was no longer significantly different (34% and 30% respectively).
Perceptions of safety for Muslim young men have deteriorated. Whereas in 2011–12, •
15
MAIN FINDINGS
• A smaller proportion of Muslim young men said that they would report victimisation to a member of staff (22% compared with 31% of non-Muslim young men).
Respect
A smaller proportion of Muslim young men compared with non-Muslim young men •
said that most staff treated them with respect (58% compared with 78%). In 2011–12, responses from the two cohorts were the same (both 64%).
Muslim young men in 2012–13 had more negative perceptions of the complaints •
system, with only 43% reporting that it was easy to make a complaint, compared with 59% of non-Muslim young men. In 2011–12, there was little difference (63% and 64% respectively).
Muslim young men’s perceptions of the rewards scheme were worse than their non-•
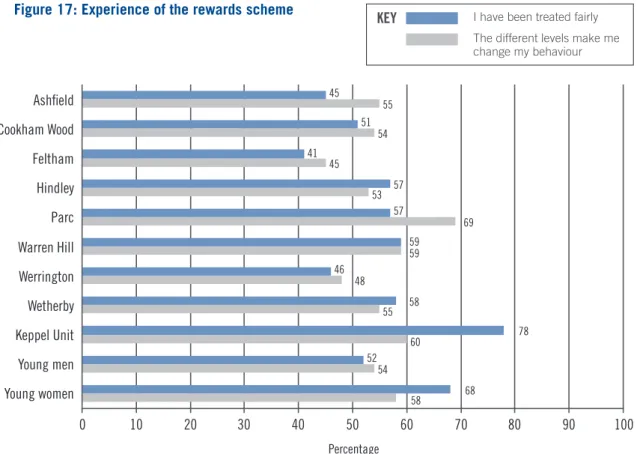
Muslim counterparts: a smaller proportion reported that they were on the top level of the scheme (25% compared with 34%), a smaller proportion felt that they had been treated fairly by the scheme (42% compared with 55%) and a smaller proportion felt that the different levels made them change their behaviour (45% compared with 56%). A higher proportion of Muslim young men than non-Muslim young men reported that •
they found it easy to access religious services (71% compared with 60%) and that their religious beliefs were respected (80% compared with 54%).
Purposeful activity
In 2011–12, there was a smaller proportion of Muslim young men reporting •
involvement in education, vocational training or having a job in their establishment than non-Muslim young men. In 2012–13, the gap between the groups had closed and similar proportions of Muslim and non-Muslim young men reported involvement in education, vocational training or having a job.
Resettlement
A smaller proportion of Muslim young men reported that it was easy for their family and •
friends to visit them (27% compared with 36% of non-Muslim young men) or that their visits started on time (36% compared with 48%).
Experiences of young men who considered themselves to have a
disability
Safety
Young men who considered themselves to have a disability were more likely than •
young men who did not to report that they had felt unsafe in their establishment (42% compared with 28%). They were also more likely to report that they had been victimised by other young people (35% compared with 20%).
In 2011–12, a significantly higher proportion of young men who considered themselves •
to have a disability reported that they had been victimised by staff (32% compared with 22%). In 2012–13 this was no longer significantly different (25% compared with 21%). Young men who considered themselves to have a disability were also more likely to •
report that staff had hit, kicked or assaulted them (7% compared with 3% of young men who did not consider themselves to have a disability).
Respect
A higher proportion of young men who considered themselves to have a disability •
16
MAIN FINDINGS
• Only 64% of those young men who considered themselves to have a disability,
compared with 72% of young men who did not, reported that they could have a shower every day if they wanted to.
• A smaller proportion of young men who considered themselves to have a disability reported that they were on the top level of the rewards scheme (23% compared with 34% of young men who did not consider themselves to have a disability).
• A higher proportion of young men who considered themselves to have a disability reported that they had emotional or mental health problems (56% compared with 12% of young men who did not consider themselves to have a disability).
Resettlement
A smaller proportion of young men who considered themselves to have a disability •
reported that they were able to use the telephone every day (58% compared with 72% of young men who did not).
A smaller proportion also reported that they had one or more visits per week (25% •
compared with 40% of young people who did not consider themselves to have a disability).
Experiences of young men who said they had been in local authority
care
Safety
Over a quarter (28%) of young men who had been in care reported that they had been •
victimised by other young people (compared with 20% of young men who had not been in care).
Fourteen per cent of young men who had been in care reported that other young •
people had made insulting remarks to them, 13% reported that other young people had hit, kicked or assaulted them and 11% reported that other young people had threatened or intimidated them – all significantly worse responses when compared with those young people who had not been in care.
Respect
Seventy-four per cent of young men who said that they had been in care reported that •
they had had problems when they first arrived at their establishment, compared with 68% of young men who had not been in care.
Young men who said that they had been in care were more likely to report that staff •
treated them with respect (78% compared with 72%).
Twenty-eight per cent of young men who said that they had been in care reported that •
they were on the enhanced level of the reward scheme (compared with 35% of men who had not been in care) but were more likely to feel that they had been treated fairly by the scheme (57% compared with 50%).
A higher proportion of young men who had been in care reported that they had •
emotional or mental health problems (26% compared with 16% of other young men). Resettlement
Young men who reported having spent time in care were more likely to anticipate •
17
SECTION ONE
Section 1
Introduction
1.1 Background to children and young people in young offender
institutions
The steady decline in the number of children and young people held in custody in England and Wales continued during the 2012–13 reporting period. Over the past five years the total number of 15–18-year-olds in young offender institutions (YOIs) has fallen from 2,365 in March 20093 to 1,044 in March 2013,4 a decrease of 56%. This included a 32% decrease from the 1,540 children and young people who were held in YOIs in March 2012.5 The 1,044 young people held in YOIs in March 2013 included 1,032 young men and 12 young women.
Reflecting this decreasing demand for the secure estate, the Youth Justice Board (YJB) decommissioned 983 YOI places between April 2009 and March 2012.6 During 2012–13 it was announced that HMYOI Ashfield was to re-role into a category C male prison; all of the young men were transferred out of the establishment by the end of May 2013.
In July 2013, the YJB announced that the number of available custodial places for children and young people will be reduced by 353. This will involve the YJB withdrawing from all the girls’ YOI units and a reduction in places at both HMYOI Hindley and HMYOI Wetherby. In future, all young women remanded or sentenced to custody will be held in secure children’s homes or secure training centres.7
In February 2013, Ministers published plans to review the secure estate and put a greater focus on education within youth custody. The Transforming youth custody: Putting education at the heart of detention8 consultation was held between February and April 2013 and proposed the development of ‘secure colleges’ to increase the quantity and standard of academic and vocational training for young people held in detention as a means to reduce reoffending and tackle underlying issues facing those young people that enter custody. At the time this report was being prepared, these plans were still being considered.
In our report last year we noted that the rate of reoffending following a period of secure custody for children and young people had declined from the period 2006–07 to 2009–10, reaching a low of 69.7% in that year.9 The most up-to-date data available is from 2010–11, and shows that the rate of reoffending has risen again to 72.6%.10
3 Youth Justice Board (2010) Youth Justice Board annual workload statistics 2008/09, England and Wales – workload
tables. London: YJB.
4 Unpublished Youth Justice statistics: the March 2013 figure is provisional and will be finalised in the annual Youth
Justice statistics, published in January 2014.
5 Ibid.
6 Youth Justice Board (2012) Developing the secure estate for children and young people in England and Wales –
Plans until 2015. London: YJB.
7 Youth Justice Board of England and Wales, YJB reduces number of commissioned places in youth custody,
announcement 2 July 2013.
8 Ministry of Justice (2013) Transforming youth custody: Putting education at the heart of detention, consultation
paper CP4/2013. London: The Stationery Office https://consult.justice.gov.uk/digital-communications/transforming-youth-custody accessed on 14/06/2013.
18
SECTION ONE
1.2 Background to the report
Since September 2001 a team of researchers from HM Inspectorate of Prisons has conducted surveys of children and young people (aged 15 to 18) held in each YOI. Each YOI holding children and young people is now surveyed annually. This report sets out the survey responses between 1 April 2012 and 31 March 2013. Individual surveys are used as part of the evidence base for inspections, where they are triangulated with inspectors’ observations, discussions with young people and staff, and documentation held in the establishment. Taken together, they provide an opportunity for young people’s own experience of custody to inform the policies of the YJB and wider government. This is the ninth report to be published. The evidence has been collected from eight male establishments and three female establishments. This included 12 separate survey samples, as the Keppel Unit within HMYOI Wetherby is sampled separately from the main establishment. In total, 958 responses have been analysed, with responses from 942 young men and 16 young women.
1.3 Scope of the report
This report contains information on young people’s perceptions of their conditions and treatment in custody. Outlined in section 2 is a description of all the establishments in the children and young people’s estate where a survey was conducted (see methodology below). Section 3 provides the demographic details of the young men and young women who completed our survey.
Within sections 4–7, young people’s perceptions and experiences are described under each of the Inspectorate’s healthy prison areas: safety, respect, purposeful activity and resettlement. Under each of these healthy prison areas, the report outlines what the Inspectorate expects from an establishment.11 Each expectation is followed by an amalgamated response from all the young men or young women in custody to each survey question. The highest and lowest responses across the male estate are also included. The Keppel Unit, due to its specialist function, is included in the tables and graphs but results are not referred to in the text. Due to the small numbers of young women in prison custody, a best and worst analysis was not conducted for the female estate.
In addition to the main analysis, responses from young men and young women have been compared with the last reporting period (1 April 2011 to 31 March 2012). The findings are outlined in section 8.
The responses of young men from black and minority ethnic backgrounds compared with white young men, as well as Muslim young men compared with non-Muslim young men, young men who consider themselves to have a disability compared with those who do not, and young men who said they had been in care compared with those who said they had not, are also analysed in the report. The findings are discussed in section 9. The numbers were not high enough to conduct any other diversity analyses, for example of foreign national young people or young people from a Gypsy/Romany/Traveller background, and there were not enough young women in custody to conduct any diversity analysis for the female estate.
11 HM Inspectorate of Prisons (2012) Her Majesty’s Inspectorate of Prisons Expectations: Criteria for assessing the
19
SECTION ONE
Additional analyses comparing the responses of sentenced young men and young men on remand and the responses of young men reporting that it was their first time in custody against those who said they had been in custody before have been conducted and, where relevant, are included within the main sections of the report.
Only differences that are statistically significant are mentioned throughout the text.12
1.4 Methodology
Surveys are conducted intermittently across the reporting year (between April 2012 and March 2013). Depending on the size of the establishment, researchers distributed questionnaires to all or a randomly selected sample of young people. Every effort was made to speak to each person individually in order to explain the purpose and confidentiality of the survey and to make participants aware of the independence of the Inspectorate. Interviews were conducted with those who said they would have problems completing the survey due to literacy or language difficulties. All completed questionnaires were placed in sealed envelopes and collected by Inspectorate staff. To ensure child protection issues could be followed up, each questionnaire was numbered; when given the survey, children and young people were made aware of the process should they write something that raised child protection concerns.
Selecting the sample
Where establishments were too large to distribute surveys to all young people, a statistical formula13 was used to calculate the baseline sample size needed to ensure that the survey was representative of the population held. The sample selected was greater than the baseline sample size to ensure the baseline was met. The percentage of each population included in the sample is outlined in Tables 1 and 2: this ranged from 43% to 100% across the whole estate. It was also ensured that the proportion of black and minority ethnic young people in the samples reflected the proportion in the individual establishments as a whole. Treatment of data
Throughout this report data are weighted to mimic the whole population at each
establishment so that the overall responses reflect the entire young people’s estate. All the figures in the comparator tables are weighted data.14
Missing data, where respondents have not answered a question, have been excluded from the analysis. This means that percentages may have been calculated from different totals where there are different response rates across questions.
The majority of figures quoted in this report have been rounded to the nearest whole number.
Some figures quoted may not match those previously published in inspection reports as they have been analysed differently for the purposes of this report.
12 Statistical difference is used to indicate whether there is a real difference between the figures, i.e. the difference is
not due to chance alone.
13 The formula was provided by a Ministry of Justice statistician and has a 95% confidence level with a standard error
margin of 3% either way.
14 In previous reports, some demographic data was unweighted in the main report; this year, all demographic data is
20
SECTION TWO
20
Section 2
The children and young people’s estate
2.1 Establishments holding young men
During the 12-month survey period, young men were held in the following types of establishment:
dedicated site – holding young people only (15–18 years old) •
split site – holding young people and young adults (18–21 years old) •
mixed site – holding young people, young adults and adults (over 21 years old) •
specialist unit – small unit within an establishment holding young people convicted of •
serious offences and/or those who are considered to be vulnerable.
It should be noted that even in a split or mixed site, young people are still held in their own dedicated wings or units.
All establishments are in the public estate, with the exception of Parc which is run privately by G4S and Ashfield which was run by Serco Group.
Young offender institutions (YOIs) are inspected at least every three years by HM Inspectorate of Prisons. When inspected, they are awarded a judgement of Good, Reasonably Good, Not Sufficiently Good or Poor across four areas – Safety, Respect, Purposeful Activity and Resettlement.
Ashfield – dedicated site
Ashfield in Bristol opened in November 1999 and changed from a split site to a dedicated young person’s establishment in 2004. During the reporting period, it was announced that Ashfield would be re-rolled into a category C male prison. All young people were transferred out of the establishment by the end of May 2013. At the time of the survey, Ashfield held both sentenced young men and young men on remand and was privately run by Serco Group. It had a certified normal accommodation (CNA)15 of 407 with an operational capacity16 of 383.
At its inspection in May 2010, Ashfield was assessed as follows: Safety – Good, Respect – Reasonably Good, Purposeful Activity – Good, Resettlement – Good. Ashfield was also inspected in February 2013 – its closure had already been announced and children and young people were in the process of being moved to other establishments – judgements were therefore not awarded during this last inspection.
Cookham Wood – dedicated site
Cookham Wood, in Rochester, Kent, was built in the 1970s and was re-rolled from a women’s establishment to accommodate young men in May 2008. It has a CNA and operational capacity for 143 young men. It holds both sentenced young men and young men on remand.
At its inspection in November 2011, Cookham Wood was assessed as follows: Safety – Reasonably Good, Respect – Reasonably Good, Purposeful Activity – Reasonably Good, Resettlement – Reasonably Good.
15 CNA is the Prison Service’s own measure of accommodation. CNA represents the good, decent standard of
accommodation that the service aspires to provide all prisoners.
16 The operational capacity of an establishment is the total number of prisoners that an establishment can hold taking
21
SECTION TWO
Feltham – split site
Feltham, in Middlesex, serves mainly the London area. Originally built in 1854 as an industrial school, it was taken over by the Prison Commissioners in 1910 as a Borstal. The existing building began holding young people from 1988 as a remand centre and in 1991 combined with Ashford remand centre to form Feltham in its present form. The young people’s side has a CNA and an operational capacity of 240. Feltham used to contain the Heron Unit, a 30-bed specialist resettlement unit funded by the European Social Fund, Youth Justice Board and the Greater London Authority as one strand of Project Daedalus.17 The funding for this ended in May 201218 although some funding for increased staff numbers does remain.19
At its inspection in January 2013, Feltham was assessed as follows: Safety – Not Sufficiently Good, Respect – Reasonably Good, Purposeful Activity – Reasonably Good, Resettlement – Reasonably Good.
Hindley – dedicated site
Hindley, near Wigan, opened in 1961. Previously a split site, it became a dedicated site for unsentenced and sentenced children and young people in April 2009 and is currently the largest establishment in the country holding 15–18-year-olds, with a CNA and operational capacity of 506. The YJB plans to reduce the operational capacity to 314 places during 2013–14.20 Hindley has a complex needs unit for young people requiring more intensive interventions.
At its inspection in November 2012, Hindley was assessed as follows: Safety – Not
Sufficiently Good, Respect – Reasonably Good, Purposeful Activity – Good, Resettlement – Good.
Keppel Unit – specialist unit
The 48-bed Keppel Unit at HMYOI Wetherby opened in 2008 and is a national resource for very vulnerable young people and those who find it difficult to engage in the regime in larger establishments.
The Keppel Unit was first inspected in April 2009, shortly after it opened and was assessed as follows: Safety – Good, Respect – Good, Purposeful Activity – Good, Resettlement – Reasonably Good.21
Parc – mixed site
Parc is the only male establishment to hold young people, young adults and adults on the same site. The only private prison in Wales, it opened in 1997 and is run by G4S. The young people’s unit has an operational capacity of 64 and holds sentenced young men and young men on remand.
At its inspection in July 2012, Parc was assessed as follows: Safety – Reasonably Good, Respect – Good, Purposeful Activity – Good, Resettlement – Reasonably Good.
17 Social Research Institute (2012) Evaluation of the London Reducing Reoffending Programme (Daedalus): Final
report. Ipso MORI, p.3.
18 Ibid.
19 HMP YOI Feltham IMB (2013) HMP YOI IMB Annual Report, p.4.
20 Youth Justice Board of England and Wales, YJB reduces number of commissioned places in youth custody,
announcement, 2 July 2013.
21 Since the time of this inspection, HM Inspectorate of Prisons judgements terminology has been amended, although
22
SECTION TWO
Warren Hill – dedicated site
Warren Hill, in Suffolk, opened in 1982. It has a CNA and an operational capacity of 192 (including the Waveney Unit, a unit for long-term sentenced young men). It became an establishment exclusively for young people in October 2000 and holds sentenced young men and young men on remand.
At its inspection in March 2013, Warren Hill was assessed as follows: Safety – Not Sufficiently Good, Respect – Reasonably Good, Purposeful Activity – Reasonably Good, Resettlement – Good.
Werrington – dedicated site
Werrington, near Stoke-on-Trent, opened in 1895 as an industrial school. It was reopened by the Prison Commissioners as a senior detention centre in 1957 and has held young people in its modern guise since 1988. It is one of the oldest establishments for young people and has a CNA and operational capacity of 160.
At its inspection in August 2012, Werrington was assessed as follows: Safety – Reasonably Good, Respect – Not Sufficiently Good, Purposeful Activity – Not Sufficiently Good,
Resettlement – Good. Wetherby – dedicated site
Wetherby, in North Yorkshire, opened in 1958, but only began holding young people in 1983. It has a CNA and operational capacity of 396 (including the specialist unit, Keppel). In April 2000 it became a dedicated establishment for sentenced and unsentenced young people. The YJB plans to reduce the operational capacity to 276 places during 2013–14.22 At its inspection in January 2012, Wetherby was assessed as follows: Safety – Reasonably Good, Respect – Reasonably Good, Purposeful Activity – Reasonably Good, Resettlement – Good.
2.1.1 Changes in the male estate since the 2011–12 reporting period
The Carlford Unit ceased to operate as a separate unit at Warren Hill in February 2012 so is not included within this report. A 40-bed specialist unit, the Waveney Unit (also on the site of Warren Hill) has been opened since and serves a similar function but was not surveyed as a discrete unit. The Heron Unit, formerly a specialist resettlement unit at Feltham, was similarly not surveyed as a discrete unit this year.
2.2 Establishments holding young women
In July 2013, the YJB announced its withdrawal from all the YOI units for girls under 18 in England and Wales.23 Post January 2014 the following units will no longer be used to hold girls under 18 and their use will be determined by NOMS.
Josephine Butler Unit
The Josephine Butler Unit was in the grounds of HMP and YOI Downview, a closed
women’s prison in Surrey. The 16-bed unit opened in December 2004 and held sentenced young women and those on remand.
Mary Carpenter Unit
The Mary Carpenter Unit was a discrete unit in the grounds of HMP and YOI Eastwood Park, a local closed women’s prison in Gloucestershire. The 16-bed unit opened in 2005 and held sentenced young women and those on remand.
22 Youth Justice Board of England and Wales, YJB reduces number of commissioned places in youth custody,
announcement, 2 July 2013.
23
SECTION TWO
Rivendell Unit
24
SECTION THREE
Section 3
Young people in custody
3.1 Introduction
This report summarises the survey responses from all eight young men’s establishments, one specialist unit and three young women’s establishments visited during the year. In total, 942 young men and 16 young women took part in the survey. Survey information for each establishment across the male and female estate is shown in Tables 1 and 2 respectively.
Table 1: Samples from the male estate
ESTABLISHMENT DATE OF SURVEY POPULATION AT
TIME OF SURVEY
NUMBER OF RETURNED SURVEYS (RESPONSE RATE)
% OF POPULATION SAMPLED
Parc 30 May 2012 52 38 (76%) 73%
Werrington 21 August 2012 132 112 (85%) 85%
Ashfield 25 September 2012 205 170 (84%) 83%
Cookham Wood 16 October 2012 117 97 (83%) 83%
Hindley 13 November 2012 196 169 (87%) 86%
Feltham 15 January 2013 183 155 (85%) 85%
Wetherby 28 January 2013 194 83 (65%) 43%
Keppel Unit 28 January 2013 38 33 (87%) 87%
Warren Hill 11 February 2013 117 85 (73%) 73%
Total 1,234 942 76%
Table 2: Samples from the female estate
ESTABLISHMENT DATE OF SURVEY POPULATION AT
TIME OF SURVEY
NUMBER OF RETURNED SURVEYS (RESPONSE RATE)
% OF POPULATION SAMPLED
Mary Carpenter Unit 8 August 2012 6 6 (100%) 100%
Josephine Butler Unit
22 August 2012 9 8 (89%) 89%
Rivendell Unit 20 March 2013 3 2 (67%) 67%
Total 18 16 89%
3.2 Profile of young men surveyed
All the young men surveyed were asked to give some basic background and demographic information.
3.2.1 Age
25
SECTION THREE
15 years old 16 years old 17 years old 18 years old 60
15 5
20
%
Figure 1: Age of young men sampled
3.2.2 Nationality and language
The majority of young men in the sample reported that they were British nationals (96%). This varied from 99% of young men at Wetherby to 91% at Cookham Wood. Overall, 99% of the young men surveyed said that they understood spoken English, which was highest at Ashfield, Cookham Wood and Hindley (100% at each) and lowest at Werrington (96%). Ninety-eight per cent of all young men reported that they could understand written English. This was again highest at Ashfield and Hindley (100% at each) and lowest at Werrington (95%).
3.2.3 Ethnicity
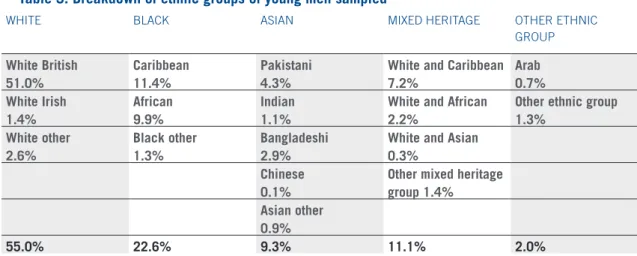
Overall, 55% of young men reported that they were from a white background, while 45% reported that they were from a black or minority ethnic background. Nearly a quarter (23%) of young men identified themselves as black and 11% said they were of a mixed heritage background. Nine per cent of young men reported they were Asian and 2% said they were from any other ethnic background (see Figure 2). See Table 3 for a full breakdown of all ethnic groups.
White Black
Mixed heritage Asian
Other 11
55 2
23
%
Figure 2: Ethnicity of young men sampled
26
SECTION THREE
Table 3: Breakdown of ethnic groups of young men sampled
WHITE BLACK ASIAN MIXED HERITAGE OTHER ETHNIC
GROUP White British 51.0% Caribbean 11.4% Pakistani 4.3%
White and Caribbean 7.2% Arab 0.7% White Irish 1.4% African 9.9% Indian 1.1%
White and African 2.2%
Other ethnic group 1.3% White other 2.6% Black other 1.3% Bangladeshi 2.9%
White and Asian 0.3%
Chinese 0.1%
Other mixed heritage group 1.4%
Asian other 0.9%
55.0% 22.6% 9.3% 11.1% 2.0%
3.2.4 Religion
Sixty-six per cent of young men surveyed stated that they had a religion. As in 2011–12, 22% reported that they were Muslim. Similar proportions of young men reported that they were Catholic or Church of England at 18% and 17% respectively. A full breakdown of young men’s religion is provided in Figure 3.
Figure 3: Religious beliefs of young men sampled
18 34 7
%
2 17 22 NoneChurch of England Catholic
Protestant Other Christian denomination Muslim
3.2.5 Gypsy, Romany or Traveller
In total, 5% of young men surveyed said that they were Gypsy, Romany or Traveller. The largest proportion was at Warren Hill (12%) and the smallest proportion was at Parc (2%). 3.2.6 Disability
Of the young men surveyed, 16% considered themselves to have a disability. The largest proportion was at Cookham Wood (21%). The lowest figure was reported at Feltham, where 7% of young men surveyed said they considered themselves to have a disability.
3.2.7 Are you sentenced?
Eighty-one per cent of the young men in the sample reported that they were sentenced. The highest proportion was at Wetherby (93%), and the lowest proportions were at Cookham Wood and Feltham (67% at each).
27
SECTION THREE
sentence of more than two years. Of those who said they were sentenced, 4% told us they were serving an indeterminate sentence for public protection.
3.2.8 Have you been in custody before?
Over half (56%) of the young men surveyed reported that this was their first time in a young offender institution, secure training centre or secure children’s home. The highest proportion of young men reporting that it was their first time in custody was at Parc (71%) whilst the lowest was at Cookham Wood (49%).
3.4.9 How long have you been in this establishment?
Over half (55%) of the young men surveyed had been in their current establishment for between one and six months. Nineteen per cent of young men had been in their current establishment for between six months and a year, and 9% had been in their establishment for between one and two years. Fifteen per cent of the young men had been in their establishment for less than one month, while 2% had been there for over two years. 3.2.10 Looked after children
A third (33%) of young men surveyed reported that they had spent some time in local authority care. This ranged from 39% at Wetherby to 26% at Werrington.
3.2.11 Do you have any children?
Eleven per cent of young men surveyed said that they had children. This was highest at Warren Hill (16%) and lowest at Parc and Wetherby where 8% of young men at each establishment reported that they had children.
3.2.12 Educational background
Over a third (37%) of young men in the sample said they were 14 or younger when they last attended school.
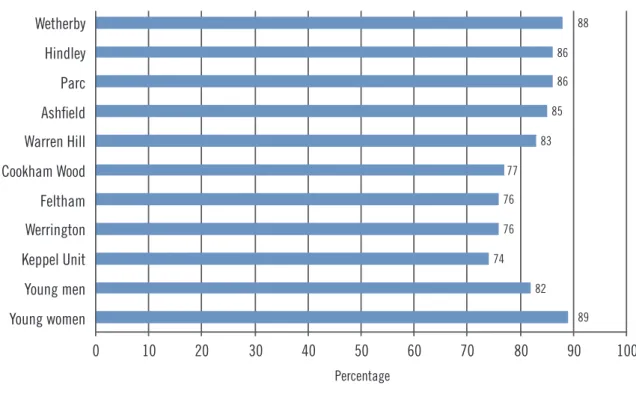
The majority (86%) of young men reported that they had been excluded from school and just under three-quarters (74%) of young men said that they had skipped school at some point before they came to custody. For a full breakdown by establishment, see Figure 4.
Excluded Skipped
KEY Figure 4: Young men’s experience of education
87
85
83
87
89
86
87
91
61
86 70
66
60
80
83
81
71
88
66
74
0 10 20 30 40 50 60 70 80 90 100
Ashfield
Cookham Wood
Feltham
Hindley
Parc
Warren Hill
Werrington
Wetherby
Keppel Unit
Young men
28
SECTION THREE
3.3 How has the profile of young men changed since 2011–12?
These data are weighted to mimic the whole population at each establishment and for comparator purposes. Only demographic data that are significantly different from those reported in 2011–12 are included below.In 2012–13, 15% of young men surveyed said that they were 18 years old, which was •
significantly more than the 12% of young men who did so in 2011–12.
The proportion of young men who said they considered themselves to have a disability •
had increased from 12% in 2011–12 to 16% in 2012–13.
There was an increase in the proportion of young men who reported being sentenced, •
from 75% in 2011–12 to 81% in 2012–13.
3.4 Profile of young women surveyed
The number of young women at each of the units was very small and therefore the percentages quoted may represent a small number of young women or a small number of respondents for that question (even though responses were received from nearly all young women at each unit). Therefore, the actual numbers have been included alongside percentages for young women.
All the young women surveyed were asked to give some basic background and demographic information.
3.4.1 Age
Other than in exceptional circumstances, all young women under 18 will be held in secure training centres and those aged 18 in adult prisons. Nearly all (92%, n=15) of the young women surveyed in 2012–13 said that they were 17 years old, and just one (8%) stated that she was 18.
3.4.2 Nationality and language
All of the young women surveyed told us that they were British nationals and that they understood both spoken and written English.
3.4.3 Ethnicity
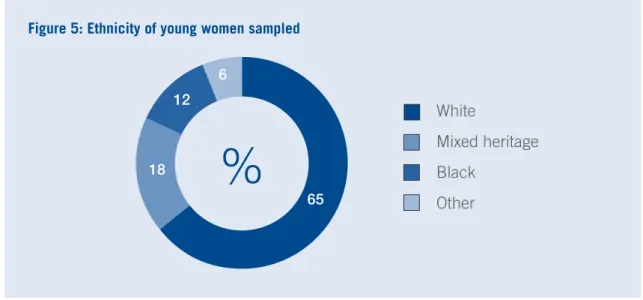
Overall, 65% (n=10) of young women said they were from a white background and 35% (n=6) reported that they were from a black and minority ethnic background (see Figure 5). The breakdown within these groups can be seen in Table 4.
Figure 5: Ethnicity of young women sampled
White
Mixed heritage Black
Other 65
6 12
29
SECTION THREE
Table 4: Breakdown of ethnic groups of young women sampled
WHITE BLACK ASIAN MIXED HERITAGE OTHER ETHNIC
GROUP White British 58.8% (n=9) Caribbean 11.8% (n=2) Pakistani 0.0%
White and Caribbean 11.8% (n=2) Arab 0.0% White Irish 5.9% (n=1) African 0.0% Indian 0.0%
White and African 0.0%
Other ethnic group 5.9% (n=1) White other 0.0% Black other 0.0% Bangladeshi 0.0%
White and Asian 5.9% (n=1) Chinese
0.0%
Other mixed heritage group 0.0%
Asian other 0.0%
64.7% (n=10) 11.8% (n=2) 0.0% 17.7% (n=3) 5.9% (n=1)
3.4.4 Religion
Forty-one per cent (n=6) of the young women surveyed reported that they had no religion. Twelve per cent of young women identified themselves as Church of England (n=2), Muslim (n=2) and Catholic (n=1). Another 24% (n=4) of the young women reported that they belonged to other Christian denominations (see Figure 6).
Figure 6: Religious beliefs of young women sampled
None
Church of England Catholic Other Christian denominations Muslim 41 12 12
%
24 123.4.5 Gypsy, Romany or Traveller
Of the young women surveyed, just one identified themselves as Gypsy, Romany or Traveller (6%).
3.4.6 Disability
Overall, 17% (n=3) of the young women told us that they considered themselves to have a disability.
3.4.7 Are you sentenced?
Over half (55%, n=9) of the young women reported that they were sentenced. Fifty-six per cent (n=5) of young women who told us they were sentenced said their
30
SECTION THREE
3.4.8 Have you been in custody before?
Nearly two-thirds (61%, n=10) of the young women reported that this was the first time they had been in a young offender institution, a secure training centre or a secure children’s home.
3.4.9 How long have you been in this establishment?
Thirty-eight per cent (n=6) of young women reported they had been in their current establishment for less than one month. Forty-five per cent (n=7) of the young women said that they had been in their current establishment for over one month but less than six months, and 19% (n=3) told us they had been there more than six months but less than 12 months.
3.4.10 Looked after children
Sixty-one per cent (n=9) of young women surveyed told us that they had spent time in local authority care.
3.4.11 Do you have any children?
Two (11%) of the young women reported that they had children. 3.4.12 Educational background
Sixty-five per cent (n=9) of the young women said that they were 14 or younger when they last went to school. All of the young women surveyed reported that they had been excluded from school and 82% (n=12) told us that they had skipped school before coming to
custody.
31
SECTION FOUR
Section 4
Safety
Children and young people, particularly the most vulnerable, are held safely.
4.1 Courts, transfers and escorts
Expectation: Children and young people transferring to and from the establishment
are treated safely, decently and efficiently.
4.1.1 What was your most recent transfer like?
A higher proportion of young men in 2012–13 reported that they had travelled in a van with people over the age of 18 or of a different gender than in 2011–12 (36% compared with 26%). This figure was highest at Parc (52%) and lowest at Cookham Wood and Warren Hill (24% each).
Eighty-two per cent of young men reported feeling safe during their most recent journey. This ranged from 92% of young men at Hindley to 76% at Feltham and Werrington. All of the young women surveyed in 2012–13 said that they felt safe on their most recent journey (n=16), significantly higher than the 67% (n=17) of young women who reported this in 2011–12. Nearly three-quarters of young women (72%, n=11) reported that they had travelled with someone over the age of 18 or of a different gender.
When asked about their recent journey, 9% of young men reported spending more than four hours in the van. This was highest at Wetherby where 17% of young men said they had spent more than four hours in the van and lowest at Parc (2%). Young men who were on remand were less likely to report spending more than four hours in the van than those who were sentenced (5% compared with 10%).
No young women reported that they had spent more than four hours in the van. Of the young men who reported that they had spent more than two hours in the van on their most recent journey, 15% said that they were offered a toilet break, ranging from no young men at Parc to 23% at Wetherby. Thirty-three per cent reported that they had been offered something to eat or drink, ranging from 20% at Parc to 38% at Warren Hill. In 2012–13, all of the young women surveyed who said they had spent more than two hours in the escort van (n=6) reported that they had been offered something to eat or drink, higher than the proportion in 2011–12 (50%, n=9). None of the young women stated that they had been offered a toilet break.
When asked if they were treated well or very well by escort staff, 53% of young men reported that they had been. Young men at Wetherby reported most positively (63%) and those at Cookham Wood most negatively (43%).
In total, 17% of young men reported that they had received information that helped them prepare, before they had arrived at their establishment. This figure was highest at Parc where 24% of young men reported receiving helpful information, and lowest at Feltham where only 12% of young men reported they had received helpful information before their arrival.
32
SECTION FOUR
4.2 Early days in custody
Expectation: