Demand-Side Response Load Management Modeling
Encountering Electrical Peak Demands in Eastern and
Southern Australia - Smart Grid Tools
Marwan Marwan and Fouad Kamel
University of Southern Queensland Toowoomba, Queensland, AustraliaAbstract—The paper describes a demand-side response scheme consisting of computer-controlled switches operated at end-users premises to shift loads targeting a homogenized national demand profile. The paper presents further simulation of the economic model corresponding to the above described scheme representing an incentive-based demand response. In the simulation the impact of these programs on load shape and peak load magnitudes, financial benefit to users as well as reduction of energy consumption are shown. The results demonstrated more homogenized load curves at lesser peak load magnitudes and reduced energy cost
Keywords- Smart grid, demand-side response, load management modeling, peak electrical demand
I. INTRODUCTION
Growing electrical demands followed by constantly growing supply led to troubled electrical services manifested mainly by daily and seasonal excessive but short-lasting successive peak and low demands. Peak demands are usually associated with compromised power quality, risk of forced outages and high-priced energy supply; while low-demands in contrast might be driving some power plants to be operating at critical economic viability. Demand-side-response techniques are helping electricity users to become proactively participating in averting detrimental conditions presently prevailing in the electricity sector. Coordinated strategies shall help achieving improved use of electrical power plants and pertinent infrastructure, besides integrated use of different types of energy sources.
The Australian Energy Market Operator [1] is managing power flows across the Australian Capital Territory, New South Wales, Queensland, South Australia, Victoria and Tasmania. Western Australia and the Northern Territory are not currently connected to this market primarily because of their geographic distance from the rest of the market. The electricity market comprises of a wholesale sector and a competitive retail sector. All electricity dispatched in the market must be traded through the central spot market.
Figure 1 depicts an example of an actual energy demand and prices situation regularly broadcasted on the internet by the AMEO [1]. The price curve is closely following the demand curve.
Figure 1 Wholesale electricity price in AUD $/MWh and demand in MW for a typical day in Queensland on 5th May 2009; source: The Australian
Energy Market Operator [2].
[image:1.595.311.561.217.360.2]Electricity prices are typically at their lowest level during times of low demand (off-peak) e.g. at night. Traditionally, prices are soaring twice daily following morning and evening peak demands. For most residential electricity customers, electricity pricing doesn't vary; instead, consumers typically pay flat-rate price regardless of the time of day.
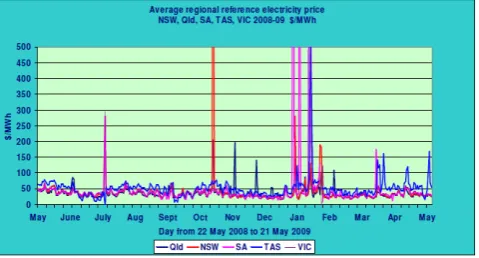
Figure 2 summarizes an example of classic fluctuations in electricity price in Queensland, from 22 May 2008 to 22 May 2009 according to [3]. This graph illustrates that the average price during that time was in the range of $50/MWh (¢5/kWh) Regional Reference Wholesale Price (RRP), however, extreme prices occurred exceeding $500/MWh (¢50/kWh). The graph indicates also that excessive demands are occurring regularly in all states on the interconnected power network. [4] stated that customers, even those bound by flat-rate contracts, must bear the additional cost for managing the corresponding extreme prices.
Figure 2 Fluctuation of Electricity Price in Queensland [6]
Any loads exceeding the base load are usually covered by other power plants operated for shorter periods at plant capacity factor lesser than 1 providing thus higher energy prices. This implies, the higher the peak demand is the higher the energy price will be. Accordingly, the limited operation of the more expensive power plants makes their operation even more expensive.
Figure 4 illustrates the occurrence of the regional reference wholesale price RRP in Queensland during the year 2008; extracted from the [1]. The figure indicates mainly that low-priced supplies are taking place at very high occurrences of more than 80% a year, while high prices occur at lower frequencies. For instance, prices around AUD $20/MWh are occurring at frequencies of about 80 %, while prices of over $50/MWh have occurrences of less than 10 %.
Objectives of this work are to achieve reduced peak demand, improved power system supply economics by improving capacity/utilization factor of electrical networks and finally reduced transmission and distribution losses by curtailment of load during demand peak events.
II. DEMAND SIDE RESPONSE (DSR)
Demand side response (DSR), as described by [7] can be defined as the changes in electricity usage by end-use customers from their normal consumption patterns in response to changes in the price of electricity over time. The Department of Energy (DOE) is describing in [8] demand side response as a tariff or program established to motivate changes in electric usages by end-use customers in response to changes in the price of electricity over time. Demand side response provides means for users to reduce the power consumption and save energy. Further on, it maximizes utilizing the current capacity of the distribution system infrastructure, reducing or eliminating the need for building new lines and expanding the system.
Energy Demand Queensland 01 Jan-31 Dec 2008 Total 52.18 TWh/Year, Base-load 4100 MW
Data source AEM O (2009)
0 1000 2000 3000 4000 5000 6000 7000 8000 9000 10000
0 14 28 43 57 71 85 100
% Time / year
[image:2.595.56.296.59.188.2]MW
Figure 3 Occurrence of electrical energy demand Queensland during 2008. Peak demand 8413 MW, base-load 4100 MW and total supplied electrical energy 52.18 TWh. Data extracted from the Australian Energy
Market Operator [1].
The energy users association of Australia targeting a DSR action summarizes by [4] that, for example, South Australian electricity consumers only use the highest 10% of their maximum electrical demand on the network less than 0.5% of the time per year, i.e., for about 40 hours per year. The report is stating further: while the electricity consumers are insulated from price volatility by ‘flat’ electricity prices, they are also paying a significant and undisclosed (hard to evaluate) premium in their retail electricity prices to cover the retail supplier’s costs of managing the risks of the extreme price volatility.
In a report of the DOE [9] while the nation’s transportation sector emits 20% of all the carbon dioxide produced, the generation of electricity emits 40% – clearly presenting an enormous challenge for the electric power industry in terms of global climate change.
[10] report new approach to electric power adding computers and communications to the existing network.
The combined effects of energy efficiency and demand response on the potential for peak demand reduction for the United States as a whole are presented in [11] showing savings approaching 43% of the peak demand in 2030. Such savings are capable of not only reducing the need for new generation capacity, but also compensating for grid reliability problems.
Energy Average Regional Reference Price (RRP) Queensland 01 Jan-31 Dec 2008 data source AEMO (2009)
0 10 20 30 40 50 60 70 80 90 100
0 14 28 43 57 71 85 100
% Time a year
R
R
P
Ener
gy W
h
o
lesa
le Pr
ice
$/
M
W
[image:2.595.324.558.524.651.2]h
III. DEMANDSIDERESPONSE MODELS
Many different economic models are used to represent Demand Side Response programs. In the report [12] of the strategic plan of the International Energy Agency (IEA), DSR is divided into two basic categories, namely, the time based program and the incentives based program. According to [13] the specific types of time based program are: time of use (TOU), real time pricing (RTP) and critical peak pricing. The FERC reports in [14], the specific types of incentive based program consist of direct load control (DLC), Interruptible/curtailable (I/C), demand bidding (DB), emergency demand response program (EDRP), capacity market (CAP) and ancillary service markets (A/S) programs. In the following, an overview of selected DSR models: I/C program, the EDRP, TOU and the proposed scheme, as presented in Figure 5.
A. Interruptible/ Curtailable Program (I/C)
The interruptible/curtailable service provides incentives/rewords to customers participating to curtail electricity demand. The electricity provider sends directives to the user for following this program at certain times. The user must obey those directives to curtail their electricity when being notified from the utility or face penalties. For example: the customer must curtail their electricity consumption starting from 6:00 pm – 7:00 pm; those customers who are following will get a financial bonus/reword to their electricity bill from the utility. In California the incentive of I/C program was $700 /MWh/month in 2001 as reported in [15]
.
Figure 5 Models of DSR programs: a) Interruptible/Curtailable (I/C), b)
Emergency Demand Response (EDRP), c) Time Of Use (TOU) and d) the Proposed Scheme.
B. Emergency Demand Response Program (EDRP)
EDRP is energy-efficient program that provides incentives to customers who can reduce electricity usage for a certain time; this is usually conducted at the time of limited availability of electricity. To participate on this program, all customers are expected to reduce their energy consumption during the events. Emergency Demand Response Program provides typical incentive payment of $350-$500/MWh of curtailed demand as in [14]. [14] reports further, utility have requested voluntary curtailments from customers during system emergencies in the past however, the provider did not pay customer for these curtailments
.
.C. Time of Use program
In this program, the electricity prices are determined according to the electricity supply cost from the utility as reported in [13], e.g. high price in peak period and low price for off-peak time. For applying this program, the utility does not provide reward or penalty to customer. To participate, all customers are required to remove their energy consumption during peak session to off-peak session as soon as their receipt information from the utility.
D. The proposed scheme
The proposed scheme in this research will be enabling customers to achieve savings by curtailing electrical consumption or shifting loads from high- to low-priced times averting periods of peak demand congestion, e.g. making use of night tariffs instead of day tariffs. Usually the electricity price will be high during peak demands and low at off-peak periods. Customers are controlling consumption on self controlled load preferences. In case the user is in a DSR program agreement with the supplier, the scheme is allowing additional savings besides the benefits and saving already achieved through the DSR agreement. The proposed scheme is securing financial and energy savings to user’s independent from user’s benefits from a DSR program.
IV. METHODOLOGY
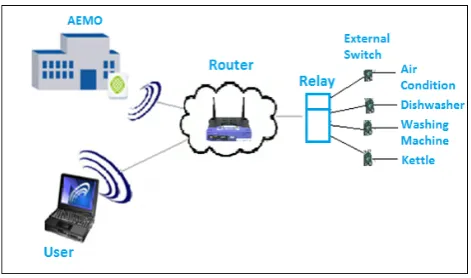
The scheme uses a router and a programmable internet relay and solid-state switches to control electrical demand at the user’s premises. The relay is programmed to receive and act upon information received from the AEMO on the internet about demand/price conditions. Figure 6 illustrates the scheme, where four appliances are controlled by four solid-state switches receiving on/off signals from the relay.
[image:3.595.57.285.400.614.2]Consumers use local computers to set-up their preferences for appliance profile usage and priorities, e.g. Table 1. The profile of appliances identifies when an appliance is run according to electricity price or network conditions (national demand. Pursuant to the order from the relay to a solid-state switch, household appliances connected to that switch can be turned on/off.
Table 1 illustrates an example of an appliance profile. All control systems above is implemented by a shell script under a Linux operation system.
Table 1 An example of appliance profile.
V. ANALYSIS AND RESULTS
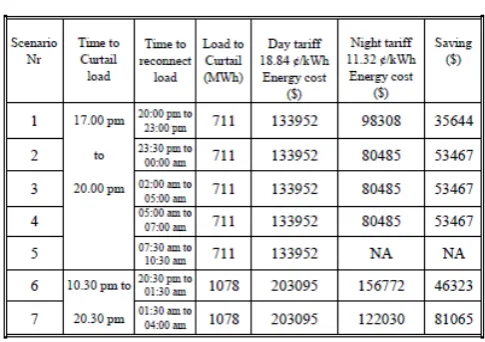
In order to evaluate the effect of the proposed scheme on electricity energy saving the electricity price/demand in Queensland for the period 2-4 May 2010 has been used, Fig. 6. In the following, seven scenarios have been formulated to demonstrate the results as presented in Fig. 8 and summarized in Table 2.
Scenario 1. In this scenario users are shifting 711 MWh peak electricity usages occurring between 17:00-20:00 pm towards the time period 20:00-23:00 pm when energy demand and prices are low. All participants are suggested to set-up the electricity profile to stop some appliance from running during that time. For example, air conditioning, washing machines and dishwashers. Achievable savings in energy cost $35644.
Scenario 2. Users are shifting peak demand of 711 MWh occurring between 17:00-20:00 pm has to be shifted to the period between 23.30 pm to 00:00 am. Achievable savings in energy cost $53467.
[image:4.595.320.559.532.689.2]Scenario 3. Users are shifting peak demand of 711 MWh occurring between 17:00-20:00 pm has to be shifted as to the period between 02:00 am to 05:00 am. Achievable savings in energy cost $53467.
Figure 6 Controlled Scenario
If [start - $Finish]; then Case name in
Air Condition) turn on relay1 State=1 Dishwasher) turn on relay2 State=1 Washing Machine) turn on relay3 State=1 Kettle) turn on relay4 State=1
Else
Case name in
Air Condition) turn on relay1 State=0 Dishwasher) turn on relay2 State=0 Washing Machine) turn on relay3 State=0 Kettle) turn on relay4 State=0
Finish
Figure 7 Pseudo Code of the Control Loop
Scenario 4. Users are shifting peak demand of 711 MWh occurring between 17:00-20:00 pm has to be shifted to the period between 05:00 am to 07:30 am. Achievable savings in energy cost $53467.
Scenario 5. Users are shifting peak demand of 711 MWh occurring between 17:00-20:00 pm has to be shifted to the period between 07:30 am to 10:30 am. No savings in energy cost due to applicable day-time tariffs. However, the scheme was still able to remove congestions out of peak demand area.
Scenario 6. Users are shifting peak demand of 1078 MWh occurring between 10:30 am-20:30 pm. All participants are suggested to set-up the electricity profile to stop some appliance to run during this time. User can run chosen appliances between 20:30 pm -01:30 am. Achievable savings in energy cost $46323.
[image:4.595.52.288.545.684.2]Scenario 7. Users are shifting peak demand of 1078 MWh occurring between 10:30 am-20:30 pm. All participants are suggested to set-up the electricity profile to stop some appliance to run during this time. User can run chosen appliances between 01:30 am to 04:00 am. Achievable savings in energy cost $81065.
VIDISCUSSION
The scheme can be considered a complementary effort to concurrent energy supplier’s efforts to mitigate electrical peak demands and the associated technical and economic detriments. It allows electricity end-users to “smoothen out” significant peaks by curtailing or shifting demand, avoiding or delaying investments in new infrastructure. A wide deployment of the scheme will allow a quite flattened load profile representing thus an optimized use of the electricity generation and distribution infrastructure. The scheme is aiming to achieve reduced energy prices and price volatility, curbing peak demands, improved grid usability and reliability, and reduced energy consumption. Additionally, the scheme is providing additional capacity more quickly and more efficiently than new supplies. The flexibility provided lowers the likelihood and consequences of forced outages as well. By reducing significant peaks, the scheme is averting the need to use the most costly-to-run power plants driving electricity costs down for all electricity users. And most importantly, by enabling end-users to observe electricity prices and congestions on the electrical network it allows users to be positively sharing responsibility by reducing and optimizing energy consumption and realizing electricity savings.
VII CONCLUSIONS
The scheme is aiming to reduce the energy price volatility by decreasing peak demands. A wide-scale deployment of the scheme shall be increasing grid reliability, reducing energy cost, and optimizing energy consumption. To achieve that, the scheme allows electricity end-users to “smooth-out” significant peaks by curtailing or shifting demand. The scheme is effectively making use of the internet and modern communication systems to maximize benefit for the user and supplier. Additionally, the scheme is practically providing additional capacity more quickly and more efficiently than new supplies. The flexibility provided lowers the likelihood and consequences of forced outages as well. By reducing significant peaks, the scheme is averting the need to use the most costly-to-run power plants, driving electricity costs down for all electricity users. And most importantly, by enabling end-users to observe electricity prices and congestions on the electrical network it allows users to be positively sharing responsibility by reducing and optimizing energy consumption and experiencing electricity savings.
ACKNOWLEDGMENT
[image:5.595.321.564.77.248.2]The authors are expressing gratitude and recognition to the Australian Power Institute (API) for the sponsorship and support given to the team of Electrical Power Engineering at the USQ.
Table 2 Result of operating scenarios
Gratitude and recognition are also expressed to the Department of National Education “DIKTI” of the Indonesian Government for sponsoring PhD researcher Marwan Marwan.
AUTHORCONTRIBUTION
Fouad Kamel set general concept of the undertaking, carried out structure of the paper, sourcing out and presenting data of electrical consumption from the AEMO and is covering electrical power engineering elements of the subject.
Marwan Marwan carried out information collection, literature review, preparation of graphs, testing and operation of data-controlled switching
REFERENCES
[ 1 ] AEMO. Price & Demand Data Sets [Online]. Available: http://www.aemo.com.au/data/price_demand.html [ 2 ] AEMO. Australian Energy Market Operator [Online].
Available: http://www.aemo.com.au/aboutaemo.html [ 3 ] F. Kamel, "User-Controlled Energy Consumption In A
Transparent Electricity System," Solar 09, the annual conference of the ANZSES, Townsville, Queensland, Queensland’s Solar City, Australia 29th September – 2nd
October 2009, Sept 2009 2009.
[ 4 ] R. S. Fraser. Demand Side Response in the National Electricity Market Case Studies End-Use Customer Awareness Program [Online]. Available:
http://www.euaa.com.au/publications/papers/files/DSR% 20Case%20Studies%20Final%20Draft3.3%20RF%201.8 %20Clean%20(LOW%20RES).pdf
[ 6 ] Fouad Kamel, "User-Controlled Energy Consumption in a Transparent Eelectricity System," presented at the 47th Annual Conference of the Australian and New Zaeland Solar Energy Society,, Townsville Queensland Australia, 2009.
[ 7 ] M. H. Albadi and E. F. El-Saadany, "A summary of demand response in electricity markets," Electric Power Systems Research, vol. 78, pp. 1989-1996, 2008. [ 8 ] DOE. Benefits of Demand Response In Electricity
Markets And Recommendations For Achieving Them [Online]. Available:
http://eetd.lbl.gov/ea/EMP/reports/congress-1252d.pdf [ 9 ] DOE. The Smart Grid an Introduction [Online].
Available:
http://www.oe.energy.gov/SmartGridIntroduction.htm [ 10 ] J. Berst, et al. The Electricity Economy New
Opportunities from the Transformation of the Electric Power Sector [Online]. Available:
http://www.globalenvironmentfund.com/data/uploads/Th e%20Electricity%20Economy.pdf
[ 11 ] O. Siddiqui. Assessment of Achievable Potential from Energy Efficiency and Demand Response Programs in the U.S.:(2010-2030) [Online]. Available:
http://mydocs.epri.com/docs/public/00000000000101836 3.pdf
[ 12 ] IEA, "Strategic plan for the IEA demand- side management program 2004-2009," 2010.
[ 13 ] H. A. Aalami, et al., "Demand Response model considering EDRP and TOU programs," in Transmission and Distribution Conference and Exposition, 2008.;D. IEEE/PES, 2008, pp. 1-6.
[ 14 ] FERC, "Assesment of Demand Response and Advanced Metering,," Department of Energy, Ed., ed. Washington DC, 2006.