Abstract: Earth is a beautiful place to live in. People are leading more sophistication and comfort life when compared to the olden days. Human are inventing things to ease of their work. But the burden is put on the Mother Nature. The earth is facing enormous environmental issues due to this. For our existence we need the Earth; but for its existence does not need human. It has evolved based on its own transformation. Once the transformations are natural it didn’t harm the Earth. But if it is anthropogenic, it affects all the living things on the Earth. This research work proposes a novel framework for predicting and analyzing the impact of climate change. The results of the analysis are presented for better understanding. The performance of the framework is also validated in this work in terms of accuracy and misclassification rate.
Keywords: Climate Change, Clustering, Prediction, Temperature change, Accuracy.
I. INTRODUCTION
T
he amount of data as in 2011 is growing 75 times more than the number of information resources by 2020. The primary source of data is Internet. Due to the existence of this huge data there comes the opportunity for human intelligence. People need to have the power of data in their fingertips. Knowledge Discovery in Database (KDD) is the primary phase of Data mining applications. KDD will extract valuable knowledge from the raw data [10]. Clustering is the prominent strategy that is used to mine the database [7].Clustering is nothing but combining the given data into meaningful groups (also called as clusters) based on specific criteria. Clustering is a form of unsupervised classification pattern [1]. Generally by clustering, the data will be divided into meaningful or useful groups called clusters. Clustering algorithms are broadly categorized as Hierarchical, Partitioned and Density based [2]. Clustering has a wide range of applications namely arts and humanities, social sciences, biological sciences, statistics, information retrieval, machine learning and data mining [5].
Clustering can be applied to environment oriented data to get valuable knowledge from the dataset. The outcome of such research works are highly needed for the benefits of the human welfare.
The research works [8, 9] are making use of clustering, classification and prediction for environment oriented research for coral mortality in Indian Ocean, managing
Revised Manuscript Received on October 05, 2019.
* Correspondence Author
K Selvan, Department of Computer Applications, J.J. College of Arts
and Science (Autonomous), Pudukkottai, Tamilnadu, India.
mangroves etc. This paper is also presented a framework for analyzing the impact of global climate change.
This research paper is organized as follows. The review of the literature is elaborated in the section II. The phases of the proposed framework are explained in the section III. The results and discussion are presented in section IV. The outcomes are concluded in section V.
II. REVIEWOFLITERATURE
The authors of [12] analyzed the global warming estimates for two time periods — one during the time when the papers were found to be overstating challenges to then-prevailing scientific consensus, and the other focusing on 2008, after the IPCC and former Vice-President Gore shared the Nobel Prize for their work on climate disruption, and before opinion polls showed the U.S. public to be growing more doubtful toward climate science once again. The findings conclude that scrutiny of the scientific agreement on global warming and climate change is highly needed.
In the paper [13], the author recorded their findings about the recent analyses with respect to the environmental data may underestimated the scale and proportion of the expected impacts of climatic changes in the nature that are caused by humans. The scientists usually do not share this kind of information but they do share something which will be giving dramatic explanations of the natural phenomena.
In the research work [10], the authors proposed a new methodology for improving the accuracy of clustering based on a feature extraction model. K-Means clustering is used here. The accuracy of the Document Term Matrix (DTM) is enhanced.
The authors of [10] employed combination of data mining techniques to recognize the content of benzene in air. The accuracy is improved with the combination of the techniques. They combined the random forest with that of J48 algorithm.
The United Nations Framework Convention on Climate Change (UNFCCC) [3] secretariat has released a book in the year 2007. The book highlights the concerns and needs of developing countries to withstand as well as adapt the effects of climate change. The impact of change in average temperature of the developing countries like Asia, Africa, Latin America and Small Island developing States are described in this book. Also the fore coming crisis due to future climate change, the pitfalls in the existing adaptation plans and actions need are dealt in this book.
The need for the proposed framework is clearly explained by the United Nations Framework Convention on Climate Change (UNFCCC).
Novel Framework for Predicting and Analyzing
the Impact on Climate Change
The impact of climate change in the Amazon – the lungs of the world – is studied in the report [14]. These reports motivated a lot to develop the proposed framework. The following section will elaborate the proposed framework.
III. PROPOSEDFRAMEWORK
The phases of the proposed framework for predicting and analyzing the impact of climate change are shown in the figure 1. It is subdivided into three phases namely, preprocessing phase, clustering phase and data presentation phase.
Fig. 1. Phases of the proposed work
Theses phases of the framework are explained in the following section.
A. Pre-processing phase
The dataset consists of missing as well as unknown values. Before going to the clustering and prediction phase it is essential to remove the unknown values and validate the dataset. Missing values are removed in this phase. Only valid data are filtered and passed as inputs to the next phase. The unwanted attributes for the study are also reduced in this phase. The results of the preprocessing phase will be explained in the results and discussion section.
B. Clustering and Prediction phase
The problem of clustering has been addressed in many contexts by the researchers belonging to different disciplines. This reveals the wide range of demand for including clustering as an inevitable step in groping the data while performing analysis. Irrespective of the difficulties faced in the definition of clusters, its assumptions and context, clustering has its own impact in solving difficult problems. The K-Means clustering is used in this phase to group the years with either increase or decrease in the average temperature of the surface.
C. Data Presentation phase
Tableau is the software that will exactly deliver data in the fingertips of the users. The data presentation phase will visualize the analysis part in an efficient manner.
The impact of climatic change is analyzed during the preprocessing phase for removal of unknown values and reduction of unwanted attributes.
Similarly the changes in the average temperature, formation of clusters for prediction, increase / decrease in the temperature, impact of temperature uncertainty are presented
IV. RESULTSANDDISCUSSION
The dataset used for the experimental setup is described in this section. The data visualization of the ―Climate Change: Earth Surface Temperature Data‖ is visualized using Tableau software.
A. Dataset Description
The dataset of this research work is downloaded from the kaggle data source [16]. This dataset consists of data related
to climate change. For this work, the
[image:2.595.52.280.198.312.2]―GlobalLandTemperaturesByCity.csv‖ dataset is used. This dataset consists of seven columns as listed below.
Table – I. Attributes of the
GlobalLandTemperatureByCity.csv Dataset
S. No Attribute Name
1 Dt
2 AverageTemperature
3 AverageTemperatureUncertainty
4 City
5 Country
6 Latitude
7 Longitude
The size of the dataset is 74.12 MB. This dataset is maintained by Berkeley Earth. In the early 2010s Berkeley Earth was envisioned by Richard and Elizabeth Muller. With the group of scientists they analyzed the surface temperature of the Earth over years and published their reports in 2012. It has become an independent non-profit organization in the year 2013.
The dataset consists of 15,717,007 mean entries of different countries and cities. The earliest month in the dataset is January 1701 and the most recent month is October 2013. The values of the average temperature are recorded for every month with respect to the cities in the globe.
The average temperature uncertainty is also recorded for every month. While evaluating the temperature of the entire planet there will be inherent level of uncertainty. These values are provided as plus/minus values. Combined with the ±0.2° C average station error, a representative lower-limit uncertainty of ±0.46° C was found for any global annual surface air temperature anomaly.
For example, a month's temperature anomaly may be reported as "0.54°C above the 20th Century average, plus or minus 0.08°C." This may be written in shorthand as "+0.54°C +/- 0.08°C."
B. Scope of the study
The scope of the experimental study is restricted to the city Agra in India. It is the city of the glorious Taj Mahal – one among the Seven Wonders of the World. It attracts 7-8 million of visitors on an average every year [18]. The visitors count increases every year. The Taj Mahal was constructed in the year 1653. It will be the pride for India ever.
[image:2.595.325.527.228.322.2]Among the data with respect to the scope of the study, some data are missing. For example the following figure depicts the missing values in the dataset.
[image:3.595.310.547.177.334.2]Fig. 2 Average Surface Temperature of Agra (1796-1799) From the month wise temperature details in the dataset the year wise temperature details are populated. The following charts show the average temperature changes from year 1796 to 1820.
Fig. 3. Average Temperature changes of Agra (1796-1820)
In the above figure it is evident that the missing values in the dataset may lead to inaccurate predictions. So in the first phase the missing values are removed. The unwanted attributes will be an unnecessary cost that will increase the size of the dataset. This kind of dataset will be growing gradually with respect to time. Here the unwanted attributes such as the latitude and longitude can be reduced from the dataset before going for further analysis.
Fig. 4.Average Temperature changes of Agra (1900-1910)
The above figure shows the average temperature changes for the period of 10 years from 1900 to 1910 for the city Agra in India.
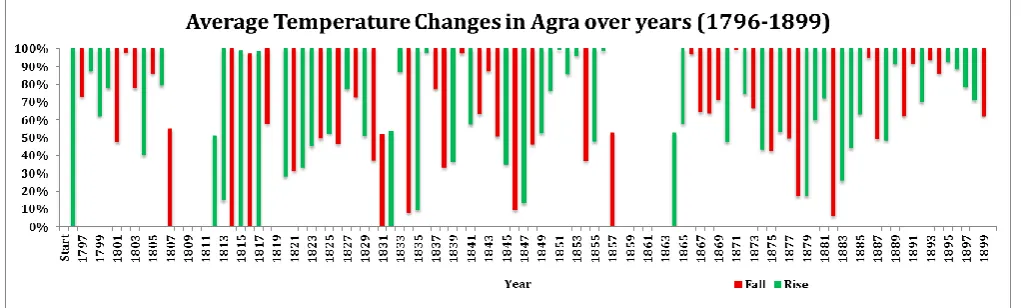
The following charts show the average temperature changes over the period of 1796 to 1899 and 1900 to 2012.
[image:3.595.46.557.462.616.2]Fig. 6.Average Temperature changes of Agra (1796-1820)
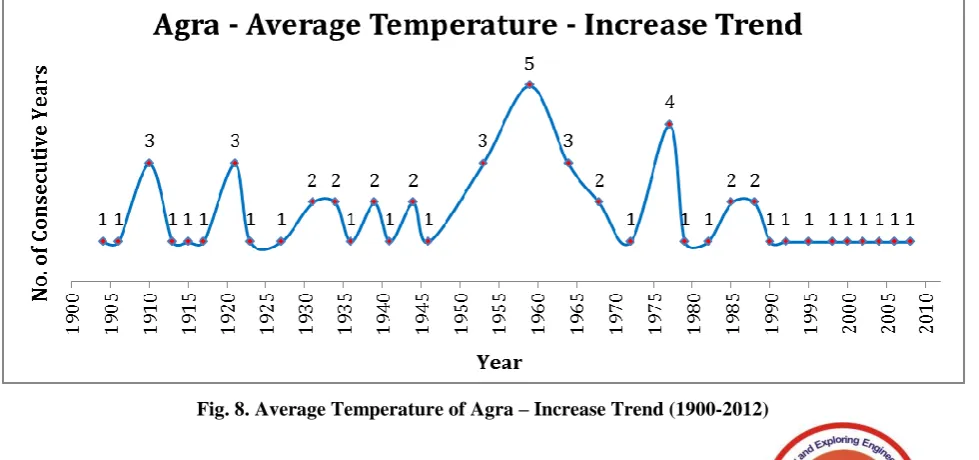
[image:4.595.115.482.278.477.2]The rise as well as the fall in the average temperatures is shown in figure 5 and figure 6. The temperature distribution is shown in the following figure for the period of 1900 to 2012 using a scatter diagram in figure 7.
Fig. 7 Average Temperature of Agra (1796-1820)
[image:4.595.56.546.542.772.2]Fig. 9. Average Temperature of Agra – Decrease Trend (1900-2012)
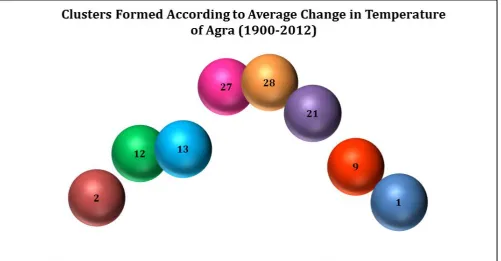
The second phase of the proposed framework is to cluster the years based on the average temperature changes in Agra. The ranges of the difference values in temperature are used to form the clusters. Here K-means clustering is used to form the clusters. The cluster formation is shown in the following figure 10.
Fig. 10. Cluster Formation with respect to average changes in temperature of Agra (1900-2012)
Based on the clusters formed, the predictions about the increase as well as decrease in temperature can be predicted. For the period of 1900 to 2012 – totally 113 years, there is a rise in average temperature for 59 years. Similarly there is a fall in temperature for 54 years. The maximum rise in temperature is 0.243 and minimum fall in temperature is -0.288. On an average the difference in temperature is -0.00026.
[image:5.595.52.554.339.600.2]Fig. 11. Increase / Decrease in Temperarue of Agra (1900-2012)
The packed bubble chart for the occurrence of the year wise average changes in temperature of Agra is shown in figure 12. The size of the bubble varies in accordance to the number of entries in the clusters.
Fig. 12. Packed Bubble Chart with respect to average changes in temperature of Agra (1900-2012) D. Metrics
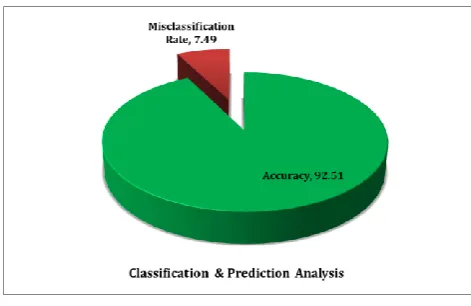
The predictions drawn from the proposed framework are analyzed in terms of the metric Accuracy [4].
𝐴𝑐𝑐𝑢𝑟𝑎𝑐𝑦 = (𝑇𝑃 + 𝑇𝑁)
False positive (FP): Number of normal samples that are incorrectly classified as attacks.
False negative (FN): Number of attack samples that are incorrectly classified as normal.
[image:6.595.125.476.280.642.2]7.49%. It is depicted in the following figure.
Fig. 13. Performance Analysis - Accuracy
V. CONCLUSION
The proposed framework offers better accuracy while predicting the impact of climatic change over a specific city. The dataset is reduced for the period 1900 to 2012 during the preprocessing phase. The earlier period has missing values. Clustering will reduce the time taken to predict the change in climate. This framework can be used to analyze any city in the dataset. The visualization helps the users to understand what they see. This work can be further extended to incorporate usage of sensors to get predictions with greater accuracy. The parameters may also be increased to consider other notable factors influencing on the global climatic change.
REFERENCES
1. ACM Computing Surveys (CSUR) Journal, Volume 31 Issue 3, Sept.
1999, Pages 264-323
2. Richard C. Dubes and Anil K. Jain, ―Algorithms for Clustering Data‖,
Prentice Hall, 1988.
3. ―Climate change: impacts, vulnerabilities and adaptation in developing
countries‖, United Nations Framework Convention on Climate Change , 2007.
4. Cortez, Paulo & Morais, A., "A Data Mining Approach to Predict Forest Fires using Meteorological Data", 2007.
5. Gasparetti, F, "Modeling user interests from web browsing activities", Data Mining and Knowledge Discovery, Springer, Volume 31, Issue 2, pp 502–547, March 2017.
6. Shivangi Bhardwaj, "Data Mining Clustering Techniques - A Review",
International Journal of Computer Science and Mobile Computing, Vol.6 Issue.5, pg. 183-186, ISSN 2320–088X, May- 2017.
7. Pragati Shrivastava, Hitesh Gupta, ―A Review of Density-Based
clustering in Spatial Data,‖ IJACR, vol. 2, pp. 200-202, September 2012.
8. Sheppard C R C., ―Predicted recurrences of mass coral mortality in the
Indian Ocean‖, Nature – 425, pp. 294 – 297, 2003 .
9. McLeod E and Salm R V.,. ―Managing Mangroves for Resilience to
Climate Change. The World Conservation Union (IUCN)‖, Gland, Switzerland. 64 pp, 2006.
10. T.SenthilSelvi , R.Parimala, ―Improving Clustering Accuracy using
Feature Extraction Method‖, Int. J. Sci. Res. in Computer Science and Engineering, Vol-6(2), pp. 15-19 , E-ISSN: 2320-7639, April 2018.
11. Gagandeep Kaur , Harmanpreet Kaur, ―Ensemble based J48 and random
forest based C6H6 air pollution detection‖, Int. J. Sci. Res. in Computer Science and Engineering, Vol-6(2), pp 41-50, E-ISSN: 2320-7639, April 2018
12. Freudenberg, W.R., Muselli, V., ―Global warming estimates, media
expectations, and the asymmetry of scientific challenge‖, Global Environmental Change 20, 483–491, 2010.
13. Brysse, K., et al., Climate change prediction: Erring on the side of least
drama? Global Environ. Change,
http://dx.doi.org/10.1016/j.gloenvcha.2012.10.008, 2012.
14. ―Climate Change Impacts in the Amazon – Review of scientific
literature‖, World Wide Fund for Nature, Presentation at the 8th UN Conference of the Parties to the Biodiversity Convention.
15. https://swachhindia.ndtv.com/taj-mahal-environmental-pollution-supre
me-court-21085/ Last accessed on 01-09-2019.
16. Climate Change : Earth Surface Temperature Data, Downloaded from
the Kaggle website,
https://www.kaggle.com/berkeleyearth/climate-change-earth-surface-te mperature-data
17. http://berkeleyearth.org/about/ - Last accessed on 01-09-2019.
18.https://world.new7wonders.com/wonders/taj-mahal-1630-a-d-agra-indi
a/ - Last accessed on 01-09-2019.
AUTHORPROFILE
K.Selvan has a rich experience of 21 years in the field of education and is presently serving as Assistant Professor in the Department of Computer Applications, J.J. College of Arts and Science(Autonomous, Pudukkottai, Tamilnadu. He acquired his M.C.A degree
from St.Joseph’s College (Autonomous),