1-1-1985
Computer simulation of blood flow in the human
arm
Salil D. Balar
Iowa State UniversityFollow this and additional works at:
https://lib.dr.iastate.edu/rtd
Part of the
Engineering Commons
This Thesis is brought to you for free and open access by the Iowa State University Capstones, Theses and Dissertations at Iowa State University Digital Repository. It has been accepted for inclusion in Retrospective Theses and Dissertations by an authorized administrator of Iowa State University Digital Repository. For more information, please [email protected].
Recommended Citation
Balar, Salil D., "Computer simulation of blood flow in the human arm" (1985).Retrospective Theses and Dissertations. 17939.
.;:&:Sb/
/91?-<
g,191.1
(!!~
9
by
Salil D. Balar
A Thesis Submitted to the
Grad ua te Faculty in Partial Fulfillment of the
Requirements for the Degree of
MASTER QF SCIENCE
Major: Biomedical Engineering
Signatures have been redacted for privacy
Iowa State University
Ames, Iowa
TABLE OF CONTENTS
PAGE
NOMENCLATURE iV
INTRODUCTION 1
Brachial and Radial Arterial Pulses in Health and Disease 3
History of Hemodynamics and Development of Arterial Models 9
Measurements of Hemodynamic Parameters and Modeling Approach in
Brachial and Radial Arteries 10
Measurement of pressure and its physiological significance 10
Measurement of flow and its physiological significance 15
Estimation of compliance and its physiological significance 16
Measurement of pulse wave velocity and pulse wave transit
time and their physiological significance 17
Models of arm arteries 19
MATHEMATICAL MODEL AND METHODOLOGY 22
Governing Equations 22
Stenos is 23
Boundary Conditions 24
Tube Taper 25
Finite-element Simulation 26
PHYSIOLOGICAL MODEL 29
Arterial Dimensions and Flow Distributions 29
RESULTS AND DISCUSSION 47
Control Case 4 7
Stenosed Arteries
A single stenosis
Dual s tenoses
Long s tenoses
Effects of Changes in
c
0 and
c
1
Effects of Changes in Lumped Resistances
SUMMARY
BIBLIOGRAPHY
ACKNOWLEDGMENTS
APPENDIX A
Determination of the Volume
v
0 of the Entire Artery
Volume of the brachial artery
Volume of the radial artery
Volume of the entire artery
APPENDIX B
Computer Programs
59
59
70
73
80
84
91
94
100
101
101
102
102
102
103
A
A m
A p
ao
ca
0c
lumpedc
totalc
tubeNOMENCLATURE
cross-sectional area
cross-sectional area at reference pressure p0 area of obstructed arterial lumen
literature value of cross-sectional area at the distal end of the brachial artery
literature value of cross-sectional area at the proximal end of the radial artery
cross-sectional area at the distal end of the radial artery
Input value of cross-sectional area for the distal end of the brachial artery and proximal end of the radial artery cross-sectional area at the proximal end of the brachial artery
wave speed
coefficient of polynomial
coefficient of polynomial
linear compliance term
nonlinear compliance term
lumped compliance
total arterial volumetric compliance
c
uD
E
K
K u
K v
L
L u p
Q
R
compliance per unit length
terminal compliance
diameter of the unobstructed lumen
diameter of the obstructed lumen
Young's modulus
arterial wall thickness
-1
the reflection coefficient
the turbulence coefficient
the inertial coefficient
the viscous coefficint
length of the stenos is
inertance per unit length
pressure
reference pressure, 95 mm Hg
flow rate
peripheral resistance of the arm
RT(distal) peripheral resistance of the distal bed
R T(ulnar) peripheral resistance of the ulnar branch
t time
V volume of the entire artery
x
µ
v
w
p
T
e
longitudinal coordinate characteristic impedance
terminal impedance
frequency parameter viscosity of the fluid
kinematic viscosity of the fluid heart frequency
density of the fluid shear stress
phase angle
INTRODUCTION
Atherosclerosis is not commonly found in the brachial and radial
arteries; hence, these arteries have not been studied as extensively
as other arteries such as the coronary artery, carotid artery and
femoral artery, However, the study of flow in the brachial and radial
arteries may be useful for diagnostic purposes in many clinical
situations. The heart pulse is usually measured from the radial
artery, and blood pressure is measured in the brachial artery. Many
investigators have measured parameters such as pulse wave velocity and
compliance in these arteries (Fulton and McSwiney, 1925, Gribbin et
al., 1976, Smulyan et al., 1983, Scarpello et al., 1980, Avolio et
al., 1983, Simon et al., 1983, Randall et al., 1984). Others have
studied how heart disease, aortic valve disease, hypertension,
diabetes, hyperemia and hyperthyrodism are related to the nature of
the waveform in the brachial or radial artery (Hancock and Abelmann,
1957, Kannel et al., 1981). The study of the brachial and radial
arteries is of major clinical importance since arterial pressure is
(values of systolic and diastolic pressures) conventionally measured
from the brachial artery, and is used as a measure of the pressure in
the proximal aorta, and the remaining arterial system. This value of
blood pressure can be misleading, if we do not consider the
people in the United States had hypertensive conditions which caused a
limitation of ·activity (U, S. Department of Heal th and Human Services,
1982, p. 29). Even though hypertension is not a immediate cause of
death, there exist extensive evidence that hypertension is responsible
for many other diseases such as stroke, heart disease etc, (Kannel et
al., 1981).
In spite of the above clinical applications of the brachia! and
the radial arteries, there has been very few attempts to model these
arteries, One reason for this is that a serious disease such as
atherosclerosis is not prevalent in these arteries, It was decided to
model the brachia! and radial arteries, since the anatomy of these
arteries is simple, and by studying the nature of the pressure and the
flow waveforms in these arteries, it may be possible to use the
waveforms to diagnose some common diseases such as heart disease and
hypertension. It is possible to construct a computer model of the
system using previously developed finite element programs (Weerapulli,
1986), This same program can also be modified to study other arteries
such as the coronary arteries and the carotid artery.
An extensive literature survey was done to find suitable data for
the brachial and radial arteries, while the sys tern of differential
equations cited by Raines et al. (1974) was used to describe the
Brachial and Radial Arterial Pulses in Health and Disease
"There is in clinical medicine no physical sign more basic or important than the arterial pulse" (O'Rourke, 1970). This subject is
of a prime interest. Many people have studied arterial pulses in various arteries such as the aorta, carotid, femoral, brachial, and radial. It is beyond the scope of this thesis to give a comprehensive
literature survey which covers pulses in the carotid arteries and femoral arteries. Only some imp or tan t studies highlighting the importance of the brachial and radial pulses in heal thy and diseased
arteries are discussed here.
The recording of the arterial pressure pulse by direct puncture of the brachial artery was considered to be a routine procedure in
clinical cardiac physiology in the mid-fifties of this century
(Hancock and Abelmann, 1957). Hancock and Abelmann (1957) attempted to diagnose aortic valve lesions from arterial pulse contours, which were scant and fragmentary at that time. The above work was done on normal subjects and various groups of patients with severe aortic
stenosis, mild aortic stenosis, myocardial failure, aortic
insufficiency, severe rheumatic mitral insufficiency without stenosis, anemia, and hypertension. A prolonged duration of systolic upstroke and an anarobic notch were found in most instances of severe aortic stenos is and frequently in patients with insignificant degrees of
and exercise, characteristic but nondiagnostic changes in the pulse
form were observed. Unfortunately, the brachial arterial tracings
encountered in normal subjects vary considerably, and overlap to some
extent the tracings associated with disorders of the circulation, and
hence such tracings were difficult to interpret as a clinical
diagnostic test. It was also noted that the brachial arterial pulse
contour may serve to confirm a clinical diagnosis of aortic stenosis
but in any individual patient yields no information as to the severity
of the lesion.
Mason et al. (1964) computed first and second derivatives of the
brachial arterial pressure pulse in normal subjects and in patients
with idiopathic hyper trophic subaor tic stenosis, di sere te subvalvular
subaortic stenosis, valvular aortic stenosis, combined aortic stenosis
and regurgitation, and pure aortic regurgitation. This quantitation
served as a useful diagnostic tool in separation of the various groups
of pa tien ts. The analysis of the dp/d t and of d p/d t of the brachial 2 2
artery pressure pulse was proved to be a simple and reliable
assessment of the n'! ture and location of left ventricular outflow
obs true ti on and helpful in the differen tia ti on of valvular aortic
stenosis, combined stenosis and regurgitation, and pure aortic
regurgitation.
Gault et al. (1966) did a basic study on patterns of brachial
arterial blood flow in conscious human subjects with and without
cardiac dysfunction, which permitted the investigation of rapid,
accessible to measurement, An electromagnetic flowmeter was used to
measure brachial arterial blood flow and recorded phasic flow patterns
in subjects without significant left heart disease, as well as in
patients having various cardiac lesions. Also investigated were the
patterns of mean brachial arterial blood flow in the resting state,
the instantaneous changes in the mean flow during local anesthesia and
surgical exposure of the brachial artery, and the influence of reflex
interventions on the brachial arterial flow. In interpreting the
various reflex interventions described above, it was recognized that
the complexity of the vascular bed served by the brachial artery
influences greatly both the quantitative and directional changes in
forearm vascular resistance (FVR). A delayed rise in systolic flow
rate was observed in patients with aortic stenosis and an absence of
• dicrotic wave in patients with severe aortic regurgitation. These
observations were helpful in distinguishing these patients from normal
subjects.
Even though Ewy et al. (1969) worked mainly on the carotid pulse,
they also determined a useful conclusion about the similar behavior of
the brachial arterial pressure pulse. The indirect carotid pulse was
characterized by a single systolic wave, a low dicrotic notch, and
large dicrotic wave. The brachial arterial pressure pulse had a
similar configuration with a shortened ejection time index. The
presence of a marked dicrotic pulse in afebrile (without symptoms of
Hawker et al. (1974), O'Rourke et al. (1968) and O'Rourke (1970)
found that in adults, amplification be tween the origin of the aorta
and the proximal end of the brachial artery (which includes the aorta,
subclavian artery and axillary artery) was less in patients with all
types of aortic valve disease than in controls, whereas it had been
previously shown that amplification in the descending aorta (which
supplies blood to the abdomen and lower extremity) was not related to
aortic valve disease. The explanation of this dissimilarity is that
the lower harmonics are amplified more in the upper limbs, while the
higher harmonics are amplified relatively more in the lower limbs.
Since in an aortic s tenosi s most of the energy of the wave is in the
lower harmonics, amplif ica ti on in the brachial artery, but not in the
descending aorta, might be expected.
Inagaki et al. (1976) studied the effects of treadmill exercise
on the slope of the brachial arterial pulse wave along with other
cardiac parameters, and these studies provide a baseline for analysis
of patients with cardiovascular disease.
Millington and Record (1977) measured the radial arterial pulse
under clinical conditions. In the literature review, it is stated
that the method of pressure recordings of the radial pulse is useful
in detecting arterial diseases, and the time derivative of pressure
could be a sensitive indicator of cardiac ejection performance and
valve function.
Barnes et al. (1974) mentioned that the measurement of forearm
the presence and hemodynamic significance of brachial artery
obs true tion following cardiac ca the teriza ti on.
Karwash et al. (1979) were interested in the disease diagnosis
from arterial pressure waveforms, and stated, "Currently, our most
common procedure, partly because of simplicity, is to simultaneously
record the pressure profiles from the brachial and radial
arteries." A comparison of representative tracings of waveforms taken
from a typical young healthy male and from an elderly healthy male,
showed the striking difference in the prominence of the dicro tic wave.
Bennett et al. (1980) noninvasively measured brachial artery peak
velocity (BAPV) as an index of cardiac performance in normal subjects
and in patients with acute myocardial infarction (AMI). BAPV in
patients with AMI was significantly less. BAPV in patients with acute
AMI who died was the least, and was significantly less than the AMI
patients who had survived.
Kannel et al. (1981) concluded that the prevalence of isolated
systolic hypertension increased with age and with the degree of
blunting of the dicrotic notch in the pulse wave. Hypertensive
subjects experienced more risk of strokes compared to normal subjects.
A comparison of pulse-wave recordings in subjects with hypertension,
arteriosclerosis, and diabetes, concludes that the appearance of the
dicrotic notch was the most important diagnostic feature of the
peripheral pulse wave.
In contrast to above studies, Giuliani and Gould (1969) saw a
arterial pressure. A study was performed on two patients with severe
aortic. s tenosis, both with cardiac. c.a the teriza ti on and peripheral
arterial pulse pressures. It was observed that the ejection time,
first derivative and upstroke time of brac.hial artery pressure were
compatible with severe aortic. stenosis, but in the c.ase of mild
stenosis only the cardiac. c.atheterization gave a reliable estimate in
diagnosing the aortic. stenosis.
In spite of the above exception, numerous current studies have
proved the importance of the brac.hial and radial arterial pulses in
the clinic.al diagnosis of arterial diseases. Moreover, due to the
simplic.i ty of the anatomy of these arteries and the c.onvenienc.e of
measuring pulses from these arteries, these arteries may be possibly
adopted for a routine procedure in the diagnosis of arterial diseases
especially near the heart. In addition to the development of
sophisticated and reliable instruments for noninvasive recording of
waveforms, use of c.ompu ter-genera ted waveforms and c.ompu ter-based data
processing c.an certainly give a better insight into the interpretation
of the waveforms.
History of Hemodynamic.s and Development of Arterial Models
In the eighteenth century, Stephen Hales contributed invaluably to
the fasc.ina ting field of arterial dynamics and c.er ta inly deserved the
title 'The Father of Hemodynamic.s' (quoted by Mc.Donald, 1974). He was
introduced the concept of the peripheral resistance. He showed that
the distensible properties of the arteries, forming a Windkessel
(elastic reservoir) during ventricular systole, are responsible for
the smooth change of pul sa tile flow in the arteries in to the steady
flow in veins (McDonald, 1974).
After Hale's work, Euler's equations of fluid motion, Bernoulli's
Law of energy, Poiseuille' s law of viscous flow through a tube, the
Navier-Stokes equations, Thomas Young's elastic modulus, Fourier
series for the analysis of periodic functions, and the Moens-Korteweg
equation of pressure pulse wave velocity were remarkable·contributions
(before the twentieth century) to the field of fluid dynamics and to
modern hemodynamics.
In the late nine teen th and earlier twentieth century, Frank's
work on the Windkessel model based on time-domain considerations was
considered to be imp or tan t (Westerhof et al., 1977). After Womersley
(1955) and McDonald (1955) used Fourier series for the analysis of the
pressure and flow waveforms, the Windkessel models of elastic
reservoirs were less frequently used, and the approach to arterial
system entered the frequency domain. Some of Womersley's mathematical
analysis regarding pressure-flow relationships in arteries was tested
experimentally by McDonald on the femoral artery of dog, while some of
McDonald's experimental results were checked mathematically by
In addition, availability of good flowmeters accelerated this kind of
trend-setting work, and many investigators started testing theoretical
work by actually measuring the blood flow in arteries in vivo.
Measurements of Hemodynamic Parameters and Modeling Approach
in Brachia! and Radial Arteries
Measurement~ pressure and its physiological significance
As mentioned earlier, pressure measurements in the brachia!
artery became clinically important because values of systolic and
diastolic pressures obtained in the brachia! artery were usually
re presented as those values in the proximal aorta and in the rest of
the system. Kroeker and Wood (1955, 1956) studied extensively the
pressure transmission from central to peripheral arteries by
simultaneously recording central and peripheral arterial pressure
pulses at many sites in the steady state under varying physiological
conditions ·as well as during rapid alterations in the cardiovascular
status of normal persons induced by the Valsalva maneuver or a
prolonged expiration, It was found that amplification of the pressure
pulse between the aortic arch and brachia! artery under basal
conditions averaged 31 percent, while amplification to the radial
artery averaged 46 percent, and to the femoral artery averaged 39
percent. Their results were supported later by O'Rourke (1970), who
found average amplification of 18 percent to the brachia! artery while
study, but on patients undergoing cardiac ca the teriza ti on). Kroeker
and Wood's (1955, 1956) measured values indicated definite increase in
systolic pressure from the brachia! to radial arteries in the same
arm. Even though the increase was small, it was quite noticeable.
O'Rourke (1982) reported the physiological significance and
factors affecting the pulse transmission to the brachia! artery by
discussing the results of Kroeker and Wood (1955, 1956) and O'Rourke
(1970). O'Rourke (1970) did not find any consistent relationship
be tween age and brachia! amplification in contrast to the definite
relationship previously shown be tween age and femoral amplification.
Both O'Rourke (1970) and Kroeker and Wood (1955, 1956) agreed that
brachia! amplification was remarkably dependent on the duration of
ventricular systole. The brachia! amplification was decreased when
systole was lengthened as in aortic
valve
disease, and increased-whensystole was shortened as by prolonged expiration, head-up tilt and
during Valsalva's maneuver (an increase of intrapulmonic pressure by
forcible exhale tion against the closed glottis). The amplification of
the pulse pressure to the radial artery also increased up to 200
percent during Valsalva maneuver. The brachia! arterial pulse also
increased in the leg exercise when the systole was shortened, The
main reason for this increase is the change in ejection pattern and
not the alteration in properties of arteries in the upper limb
(O'Rourke, 1970). In support of earlier work done by Rowell in 1968,
O'Rourke (1982) explained that similar to the femoral artery, brachia!
vascular bed, and almost disappears when vasodilation is induced in
the upper limb. Kroeker and Wood (1955, 1956) explained this increase
in amplification of the pressure pulse with decreased ventricular
ejection period on the basis of resonance stating that when the
frequency of the ventricular ejection (driving function) corresponds
to the resonant frequency of the arterial system in the upper limb,
the apparent exaggeration of wave reflection occurs.
Interpretation of directly recorded brachia! artery pressure
waves involves pressure pulse transmission to the brachial artery.
O'Rourke (1982) clearly explained that when the duration of systole is
shortened or resonant frequency of the whole arterial system or of
specific vascular segments is decreased (as when blood pressure, and
so, wave velocity, are decreased), brachial artery tracings may give a
falsely high measure of systolic pressure and a falsely low measure of
diastolic pressure in the ascending aorta and throughout the arterial
system. However, these differences may be remarkably altered if
shortened systole and hypotension are combined, as in clinical shock.
So, under clinical conditions these differences should be measured in
the proximal aorta.
One of the earliest studies regarding the physiological
relationships of arterial pressures was done by Hamilton et
pulse wave approaches the periphery, seem to be in the lower limbs and
abdominal aorta to a greater extent than in the arteries of the arm.
Later on Kroeker and Wood (1955, 1956) and O'Rourke (1970) found the
correct estimate for amplifications of pulse pressure in the femoral,
brachial and radial arteries (which was mentioned earlier in this
thesis).
It was demonstrated later (Doupe et al., 1939) that the systolic
arterial pressure in the extremities may show considerable variations
as the result of local vasomotor changes, and such variations are
independent of alterations in systemic pressure (in central arteries).
Alterations in the blood flow in the extremities are responsible for
these phenomena. Measurements were taken of° arterial pressure in the
upper arm and forearm by the ordinary ausculatory method using a
mercury manometer. Gaskell and Krisman (1958) found the brachial to
digital pressure gradient greater in the hyper tensive patients than
that in the normal subjects in different vasomotor states by using the
clinical ausculatory technique. Wallace and Stead (1959) found a
decrease in pressure in the radial artery during reactive hyperemia in
normal subjects. Approximately 30 per cent of the energy of pressure
may be lost between the aorta and the radial artery, when the arterial
bed between the aorta and radial artery offers an appreciable
resistance to flow. The effect was more pronounced in patients with
hypertension.
measured digital arterial compliance. Even though the present thesis
is not related to the digital artery, the above studies can be helpful
in the future extension of the arm arterial model to include the
digital arteries. Another aspect of the arm-models is the study of
the effects of external pressure on arm arterial pressure (Foley and
Greenberg, 1969, Caro et al., 1968). One controversial subject
regarding pressure measurement is the relationship between directly
and indirectly measured brachial pressures. Even though Rastelli et
al. ( 1968) reported that an indirect systolic pressure is lower than
the direct level, and an indirect diastolic pressure is equal to or
higher than the direct level, there is no known definite relationship
be tween directly and indirectly recorded brachial artery pressure and
there is far more variation in this relationship under basal condition
(and more so under abnormal conditions) than most are aware of (Floras
et al., 1981). This is due to the fact that the Korotkov sounds do
not accurately identify systolic and diastolic pressures. The
diastolic pressure varies so much that there is no internationally
accepted standard for determining diastolic pressure, with some taking
this to be cuff pressure at muffling of sound (phase 4) and some at
disappearance of sound (phase 5) (O'Rourke, 1982). O'Rourke
considered this topic of directly and indirectly measured arterial
pressure as uncomfortable but important. In his words, the variable
relationship be tween indirectly and directly recorded brachial artery
pressure, and between directly recorded brachial artery pressure and
pressure monitoring under such conditions as cardiogenic shock, where
cardiac function must be assessed accurately, and intra-aortic balloon
pumping timed correctly.
Measurement of flow and its physiological significance
Even though good flowmeters were only available in the market by
the 1960s, earlier attempts were made to measure blood flow. Kerslake
(1949) used his own previously developed automatic blood-flow recorder
to record forearm blood flow at frequent and regular intervals. This
study was primarily meant for observing changes in forearm blood flow
occurring immediately after the application of an arterial occlusion
cuff to the wrist of the subjects. Andres et al. (1954) measured
forearm blood flow of man by continuous injection of solution of Evans
blue dye. But in none of the above studies, was the blood flow
through the brachial artery measured. Recently, Levenson et
al. (1981) and Safar et al. (1981) measured blood flow in the brachial
artery as well as the diameter and blood flow velocity. A pulsed
doppler velocity meter was used with an adj us table range-gated time
sys tern and a double transducer probe for these determinations. The
apparatus provided an accurate noninvasive method. Safar et
al. (1981) monitored the hypertensive patients for similar
measurements, and demonstrated that the diameter of the brachial
artery increased significantly in sustained essential hypertension,
large arteries dilate excessively, contributing to the maintenance of
arterial blood fl~w within normal ranges.
Estimation of compliance and its physiological significance
Recently many people have become interested in estimating the
brachial arterial compliance, as it is suspected to be associated with
various physiological factors and hemodynamic parameters. In one of
the recent studies, Simon et al. (1983) determined forearm arterial
compliance in normal and hypertensive men from simultaneous pressure
and flow measurements in the brachia! artery, using a pulsed doppler
device and a first-order arterial model during diastole. Some
important conclusions are: (1) The reduced forearm arterial
compliance was associated with a significant increase in brachial
artery diameter, (2) The reduced forearm compliance in hypertension is
independent of blood pressure, but may reflect adaptive changes in the
walls of the large arteries. Avolio et al. (1983) studied the effects
of aging on changing arterial compliance while studying a northern
Chinese urban community, and concluded that aging and not concomitant
atherosclerosis is the dominant factor associated with reduced
arterial compliance. In the literature review (Avolio et al., 1983),
it was mentioned that the arterial pulse wave velocity is directly
related to arterial wall stiffness, and since the pulse wave velocity
increases with age, arterial wall stiffness also increases, and
aortic pulse wave velocity between the aortic arch and femoral artery,
between the femoral artery and dorsalis pedis, and between the brachial and radial arteries. Randall et al. (1984) were curious about the effect of systemic compliance in the genesis of essential hypertension, but ultimately concluded that changes in arterial
compliance alone cannot explain isolated systolic hypertension.
Reduction of compliance was found to increase in systolic pressure and
decrease in diastolic pressure, but there was no significant change in the mean pressure; however, cardiac output was reduced. It was
pointed out that decreased compliance mainly caused changes in the low frequency range of the input impedance. Fitchett (1984) considered
the forearm compliance as a possible useful indicator of the effect of physiological and pharmacological interventions on the distensible
properties of arteries.
Measurement of pulse ~ velocity and pulse wave transit time and
their physiological significance
For a number of years, the pulse wave velocity has been studied extensively, and there are many studies related to both pulse wave velocity and pulse transit time in arm arteries. About sixty years
ago, Fulton and McSwiney (1925) measured the pulse wave velocity in the brachia! and radial arteries, and the pulse wave velocity was
ago, the pulse wave velocity was monitored along an arm artery to detect changes in mean blood pressure, but not to the absolute pressure (Gribben et al., 1976). Three years later, Obrist et
al. (1979) related pulse transit time to systolic pressure (and also to myocardial sympathetic excitation), but failed to relate the pulse transit time to diastolic pressure. Two years later, Geddes et
al, ( 1981) showed pulse transit time as an indicator of arterial diastolic blood pressure. A decrease in pulse arrival and transit
time with an increase in diastolic blood pressure was found. They also reported a nonlinear relationship be tween pulse transit time and
diastolic pressure, and a linear relationship between pulse wave velocity and diastolic pressure.
Apart from blood pressure, the pulse wave velocity was also
·studied for different purposes. The direct measurement of brachial to
radial pulse wave velocity was used to calculate volume distensibility of forearm arteries, which eliminated arterial blood pressure as a variable as it strongly affects arterial distensibility (Smulyan et al., 1983). Comparison of normal subjects, to diabetic patients showed a significant increase in pulse wave velocity in the lower
limbs, but no significant difference in pulse wave velocity in the upper limbs (Scarpello et al., 1980).
In the 1i tera tu re review, Scarpello et al. ( 1980) mentioned that
the pulse wave velocity of the pressure and flow waves produced during ventricular ej ec ti on is a sensitive indicator of the physical
velocity may be used to determine changes in the condition of the
arteries which occur as a result of vascular disease. The literature
reviewed by Avolio et al. (1983) also reported that the pulse wave
velocity is directly related to arterial wall stiffness and to wall
thickness. Also it was noted that the characteristic impedance of an
artery is directly related to regional arterial pulse wave velocity.
It was concluded that the pulse wave velocity is directly related to
change in arterial compliance, and a high correlation of pulse wave
velocity with high prevalence of hypertension was found. The
relationship of pulse wave velocity with age and arterial compliance
was used to strongly argue against atherosclerosis as an important
factor influencing arterial distensibility while the pulse wave
velocity gives valuable information on arterial distensibility. Even
though the pulse wave velocity can be measured noninvasively, there
exists a drawback in that for accurate noninvasive determination it
must be measured over a long length of the arterial system. Thus, the
pulse wave velocity gives information on the properties of the whole
vascular segment, whereas characteristic impedance gives information
on the proper ties at the point of measurement.
Models of arm arteries
Many investigators have included the brachial and radial arteries
in their models of the entire arterial tree (Noordergraf et al., 1963,
hemodynamic parameters such as pressure, flow, compliance, pulse wave
velocity etc., in the brachial and radial arteries (as mentioned
earlier). There are very few attempts to model only the brachial and
radial arteries and to interpret various hemodynamic parameters. One
such attempt was done by Wesseling (1973). A simplified, lumped,
linear analogue-computer model was constructed of the arm arteries
using simultaneously recorded pulsewaves from the brachia! (input
signals) and radial (comparison signals) arteries. A parameter
estimation technique was used to obtain various hemodynamic parameters
such as the arterial internal radius, arterial compliance and the
magnitude of the amplification effect of the pulsewave with reasonably
good results. However, values for peripheral resistance were
consistently underestimated, as their model lacked viscous damping.
Simon et al. "( 1983) cons true ted a first-order arterial model of the
brachial artery, and estimated fairly accurate values of forearm
arterial compliance and resistance based on measured values of
pressure, diameter, flow velocity and volumetric blood flow.
In the above two models, nonlinear! ties are avoided. None of
these models have interpreted pressure and flow waveforms using
Fourier analysis, nor have they used the basic equations of fluid
dynamics such as the continuity equation and momentum equations.
These principles were used by many people to develop equations
governing blood flow in other arteries of the body (for example,
hemodynamic parameters such as pressure, velocity, flow, compliance
and resistance. One such model has been prepared very recently (Clark
et al., 1985), where the upper extremity arterial flow simulation
representing main arteries from heart to digits has been modeled.
Another model was also prepared which involves both upper extremities
in the two arm model. A finite-difference scheme was used to solve
the equations, and pressure and flow waveforms of normal and stenosed
arteries of the arm are presented in three dimensional plots. In the
present study, an arm arterial model has been prepared, which is
different from that of Clark et al.'s (1985). Here, the finite
element method is used, and the model is able to give pressure and
flow waves at numerous intermediate points. The model may be helpful
in studying the effect of mild and severe stenoses on pressure and
flow values, and it can be used to study the effects of changing
compliances and resistances on flow and pressure and in analyzing
pressure and flow waveforms of patients having different heart
diseases. Study of a simple model like this may give a better insight
into the similar behavior of flow characteristics in more complicated
MATHEMATICAL MODEL AND METHODOLOGY
Governing Equations
It has been shown by Raines et al. (1974) that the
one-dimensional unsteady flow equations for incompressible fluids can
be used to satisfactorily describe pulsa tile flow in flexible tubes.
The continuity equation is
(1)
where Q is the flow rate, A the lumen area, x the longitudinal
coordinate along the vessel, and tis time.
The momentum equation is
axa (Q2/ A) = _ ~ ~ p ax
+
nD p ( 2)where ' is the shearing stress at the vessel wall.
The sys tern is completed by specifying an equation of state
re la ting the lumen area and the pressure. For this present study,
this equation was assumed to be of the form
A(p ,x) (3)
where A0 is the lumen area at pressure p0 , and the coefficients of the
a a
polynomial c0 and c1 can be represented as follows: ca =--1
0 2
p ao and ca =--1
1 2 4
where ao is the wave speed in the tube.
Stenosis
The simulation of a stenosis in an artery is based on the
following relationship established by Young and Tsai (1973):
and
where t,p is the pressure drop across the stenosis. The
parameters A0 , D and A1,
o
1 , are the areas and diameters of theunobstructed and obstructed arterial lumen, respectively, and L is the
length of the stenosis. The viscous coefficient K , the turbulence v
coefficient Kt and the inertial coefficient Ku are experimental
quantities and were originally determined to give the best fit of the
data for the model. These coefficients generally depend on the
stenosis geometry and the frequency parameter et = (D/2)j;i;, where
D is the lumen diameter, ') is the kinematic viscosity and w is the
fundamental frequency (or heart frequency) of the pulsa tile flow.
In the present model, Kt and Ku were assigned the values 1. 5 and
1.2. A detailed discussion of various hemodynamic factors pertaining
Boundary Conditions
A pressure waveform for the normal brachial artery from Mason et
al. (1964) was used as the proximal boundary condition for the model
for the control case. Similarly, for the case of hypertension, a
pressure waveform from Simon et al. (1983) was used, while for the
case of AS (valvular aortic stenosis), AI (pure aortic regurgitation)
and AS/AI (combined valvular aortic stenosis and regurgitation),
pressure waveforms from Mason et al. (1964), were used as the proximal
boundary condition for the model. A pressure waveform is chosen for
the proximal boundary condition considering Porenta's (1982) argument
that the pressure waveform is probably less affected than the flow
waveform by changes in the flow situations downstream from the
proximal end of the brachial artery.
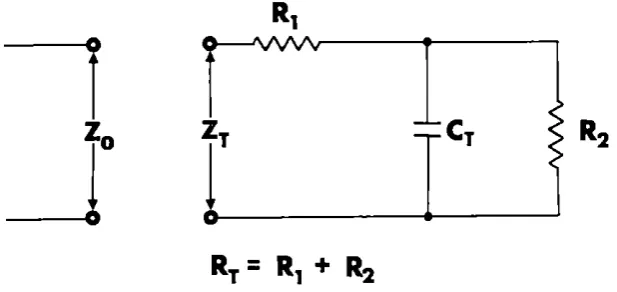
The distal boundary condition at the end of the arterial section
was determined on the basis of Raines et al. 's (1974) study. It was
decided to truncate the artery at the point before the distal bed
begins, and to replace the distal bed by a lumped resistance. This
makes the model much simpler by excluding details of small arteries,
arterioles and capillaries in the model. In order to account for the
distensibility of the distal bed, the model is terminated at the
truncation by a lumped compliance CT placed be tween two lumped
resistances R1 and R2• The network formed by this system of lumped end condition is analogous to an electrical network (as shown in
impedance in the arterial model) of this electrical circuit is given
by
(5)
where the sum of the two resistances R1 and R2 is taken to be the terminal resistance RT" Also, w is the heart frequency and j 2 = -1.
I
_J
FIGURE 1. Electric analog of the distal boundary condition
The same principle is adopted in the present model, and the peripheral
beds of the ulnar branch and the arterial tree distal from the radial
artery are each accounted for by a lumped model.
Tube Taper
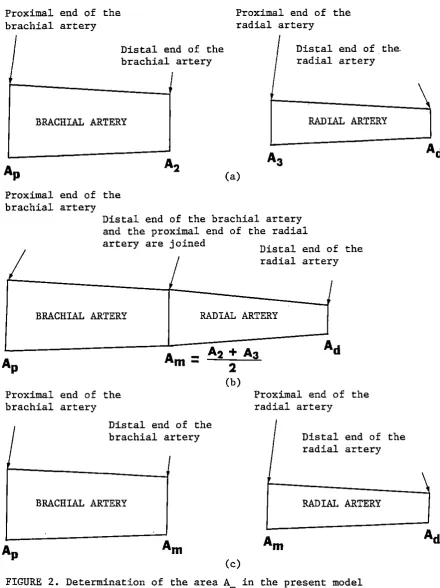
[image:32.563.74.383.296.442.2]and radial arteries, and the cross-sectional areas (AP, A2, A3, Ad) for the corresponding values of radius were calculated (Figure 2(a)). The
area A at the junction of the brachial and radial arteries (Figure m
2(b)) was found by taking the mean of the areas A2 and A3 (Figure 1 (a)). Finally, the data for the brachial artery contained AP as the
area of the proximal end and A as the area at the distal end, while m
the data for the radial artery contained A as the area of the
m
proximal end and Ad as the area of the distal end (Figure 2(c)). For
the en tire model, linear taper was used.
Finite-element Simula ti on
The finite element method was used to ob ta in a solution of the
model equations and to calculate pressures and flows. For the normal
case, the brachial artery was divided in to nine elements, and the
radial artery was divided into ten elements. The ulnar branch had
only one element. There was no element either be tween the brachial
artery and the ulnar branch or be tween the ulnar branch and the radial
artery. For the entire model, twenty elements and twenty-one nodes
were used. Wherever the s tenosis was introduced in the artery,
the length of the stenosis was included in the total length of
the arterial section, and subsequently the length of the elements
Proximal end of the brachial artery
Distal end of the brachial artery
BRACHIAL ARTERY
Proximal end of the brachial artery
Proximal end of the radial artery
'
(a)
Distal end of the. radial artery
RADIAL ARTERY
Distal end of the brachial artery and the proximal end of the radial
I
artery are joined Distal end of the radial artery•
IBRACHIAL ARTERY
RADIAL ARTERY
Proximal end of the brachial artery
I Distal end of the brachial artery
BRACHIAL ARTERY
(c)
Proximal end of the radial artery
Distal end of the radial artery
RADIAL ARTERY
FIGURE 2. Determination of the area A in the present model m
[image:34.563.52.493.78.667.2]elements and nodes were reduced, but the total length of the
arterial sec ti on was maintained constant. The detailed analysis for
simulation of the model equations by the finite element method is
PHYSIOLOGICAL MODEL
The principles and assumptions of Raines et al. (1974) and
Porenta (1982) (models of the human femoral artery) were considered in
the development of the model of the human arm. Only the major arteries
such as brachial, radial and ulnar were modeled, while the small
arteries emanating from the brachia! and radial arteries were neglected.
Although both radial and ulnar arteries are approximately equal in
diameter, and carry almost an equal amount of blood flow, the radial
artery was taken as a continuation of the brachia! artery, and the
ulnar artery was lumped. The reason for doing this is that the radial
artery is clinically more important than the ulnar artery, since
pulses are measured on the radial artery, and pressure is frequently
measured on the radial artery. The idea of lumping the ulnar artery
is not as sound as considering bifurcation of the radial and ulnar
branches and studying flow situations in both the branches equally.
However, lumping of the ulnar artery makes the model relatively
simple. Also, the details of the pulse propagation are sought only
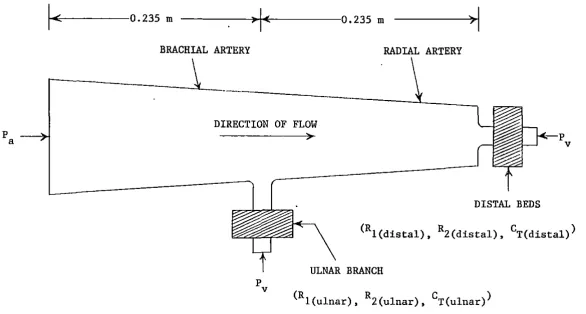
along the brachial and radial arteries. Figure 3 represents the
schema tic of the model geometry,
Arterial Dimensions and Flow Distributions
p
a
DIRECTION OF FLOW
DISTAL BEDS
p v
(Rl(distal), RZ(distal), CT(distal))
ULNAR BRANCH
(R
!(ulnar), 2(ulnar), T(ulnar)
R C )FIGURE 3. A schematic of the arteries in the human arm (P and p are the arterial
a vand venous pressures, respectively, and (R1, R2, CT) is a parameter
triplet characterizing the corresponding peripheral bed.)
[image:37.783.108.694.70.383.2]areas. The flow distribution was handled by following the assumptions
made by Raines et al. (1974) for the femoral artery. Since the
diameters of the radial and ulnar arteries are almost equal and almost
half the diameter of the brachia! artery, it was assumed that the flow
in the brachial artery divides equally in the ulnar and radial
arteries. Hence, a good approximation is to assume that the ulnar
peripheral resistance RT(ulnar) and the distal peripheral resistance
RT(distal) are equal, i.e.,
R
T(ulnar) =R
T(distal) (6)The mean blood flow through the ·brachia! artery has been taken as
98 ml/min (Simon et al., 1983) and the mean pressure in the brachia!
artery has been considered as 95 mm Hg (Kroeker and Wood, 1955, 1956).
Thus, the total peripheral resistance R of the arm is considered to be
R = 95 mm Hg
98 ml/min = 58.163 mm Hg-sec/ml
10 5
= 0.773xl0 N-s/m (7)
Also, considering the flow distribution in the arteries, one can
write the following equation:
1 1
R=R
T(ulnar)
+ __
_:l;__ _ _RT( distal)
Using ( 6) , ( 7) and ( 8) , one finds :
11 5
RT(ulnar) = RT(distal) = 2R = 0.1546xl0 Ns/m
As discussed by Raines et al. (1974), the peripheral
( 8)
resistance RT at each branch and termination must be divided into two
resistances R1 and R2• The measurements of McDonald and Attinger as
discussed by Raines et al. (1974) indicated that the optimum value
of R1/RT
=0.2 is the value which minimizes the modulus of the
reflection coefficient K at the value I KI
=O. 2. This was the case
for the femoral artery. In a similar manner, it was necessary to find
a suitable ratio for the present model. In order to do this, it was
first necessary to find the value of the compliance of the artery and
hence to find the linear compliance term co' the nonlinear compliance
term c1 and the terminal lumped compliance CT.
First, one needs to find a 0, and it can be estimated from the
Moens-Korteweg equation,
(10)
From Westerhof et al. (1969) and Avolio (1980), values of Young's
modulus E, arterial wall .thickness h0 and radius r 0 were taken, and
converted into required units for the final form (the average values
of h0 and r0 are used here). The value of the density p of the blood
used here is 1050 kg/m 3, which was also used by Porenta (1982). ·The
values obtained were as follows:
5 2
E
=8xl0 N/m ,
4 3P
=O.lOSOxlO kg/m ,
-2
d0
=
2r0
=
0.517xl0
m
h0
=o.os2sx10-2 m
ro
=0.2585xl0-2 m
of a0 was equal to 8. 8 m/ s which was very close to the value 8. 7 m/ s
listed by McDonald (1974). Thus, the coefficients of the polynomial
in the equation ( 3) can be cal cu lated as follows:
ca = 1 -5 2
10 4x (8.8) 2 = 1.23 x 10 m /N 0 0 .1050 x
2
x 105 2 -10 m4/N2
ca = (Ca) = (1.23 1 0 ) =l.5lxl0
So that one has the linear and nonlinear compliance terms as
a a
CO = CO - 2Clp0
= [l.23xl0-5 - 2(1.5lxlO-lO) (95xl32.9)]
= 0.8487xl0-5 m2/sN
c
1 =2C~
= 2(1.5lxlO-lO)
=0.3020xl0-9 m4/sN2
A method outlined in Raines et al. (1974) was followed to
determine the tube compliance (the arterial volumetric compliance)
C b of the artery. The value of C b is used to find the value of tu e tu e
the lumped compliance C lumped for each branch of the arterial model. The
compliances are related as
c lumped = c total - c tube
where Ctotal is the total arterial volumetric compliance of the
arterial model. The value of Ctotal for the brachia! artery is taken
from Simon et al. (1983), and is equal to 0.123xlO-lO m5/N. In order
length of the artery, using the following assumptions. (1) The
volumetric compliance is measured at constant pressure. In other
words, one value of the volume is measured at one value of the
pressure, and the second value of the volume is measured at the second
value of the pressure, etc. (2) The nonlinearity term in the equation
of state (equation (3)) is neglected here for two reasons: (i) To
reduce the complexity of the calculations and (ii) It is very small
compared to the other terms.
Thus, equation (3) can be reduced to the form,
a
A= A0 [1
+
c0 (p-p0)JIntegrating over the length 1 of the artery, one has
1 1
[A
dx = [ A0 [l+
c~
(p-p 0)]dxAs the pressure is kept constant during measurement, one can take the
pressure term outside of the integral, so that
1
v
= (1+
c~
(p-p0)J
[
A0 dxv
= (1+
c~
(p-p0)Jv
0v
=v
0+
c~
v
0 (p-p0)
dV 0
+
ac0
v
0 (1-0)dp =
dV a
dp = co
Vo
= ctubeh 10-6
m3
w ere
v
0
= 6.6602 x (see Appendix A)Thus, Ctube = C0 a V0 = (l.23xl0 ) (6.6602xl0-6 )
-5
C tube = 8.1920xl0-ll m5/N and
c
lumped =c
total- c
tube=l.22xl0-10 - 8.1920xl0-ll
C
= 4.0080xlO-lO
lumped
The terminal lumped compliance for each branch is
c
C = lumped = 0.20040 x 10-lO m5/N
T 2
(12)
To minimize the effects of reflections on waves, an optimum value
of the ratio R/RT was found which minimizes the value of [
K [ •The
equations used by Raines were simplified, and the values of all the
parameters in those equations were found for the present model.
A
Fortran program was written for a PDP-11/23 computer to solve these
equations. Initially, the program was run by using values from the
model of Raines et al. (1974), and the variation of the modulus and
the phase of the reflection coefficient
Kat the tibial beds with the
ratio R/RT were found. The plots of [
K[versus R/RT and phase
angle
8versus R/RT were plotted using a plotter (Figures 4 and
5).When these plots were compared with the plots given in Raines
et al. (1974), they were found to be identical. The calculated
values of the hemodynamic parameters of the brachia! and radial
arteries were introduced in the same program (Appendix_B), and the
results of the plots were observed (Figures
6and 7). It was found
that the optimum value of R
1/RT=O. l for the minimum value of [
K[and
hence, the ratio R
1/RT=O.l was considered for the arm model.
The detailed analysis for finding
RT
Subs ti tu ting R
1= R
1 ~and R2 = RT (
1this ratio is as follows:
Rl
- -) in to equation (
5)one gets,
RT
j(l - R1/RT)
2
R~
CT
w
FIGURE 5. Phase of the reflection coefficient at the distal bed as a function of R1/RT for Raines et al.'s (1974) model
FIGURE 6. Magnitude of the reflection coefficient at the distal bed as a function of R/Rr for the present model of the brachial and radial arteries
1.0
~
4I
0.8
fl
0.4'
-0.2
0.0
0.0 0.2 0.4 0.6 0.8 1.0
Rl/RT
l.l
6I
0.8
--(6r
0. 40.2
0. 0 ..___~ _ __.__ _ _._ _ _..._ _ ___.
0.0 0.2 0.4 0.6 0.8 1.0
RI/RT
30.0
I
5l/'l 0.0
w
w
oc
\.!) w 0
~
~ -30.0 w J:
t-w ..J \.!) z a: -60.0
-90.0
0.0 0. 2 0.4 0.6 0.8 1.0
Rl/RT
30.0 I 7
~ 0.0 Ill w w oc \.!) w 0
~ -30.0 w
J:
t-w
..J l!l z
a: -60.0
-90. 0 ..___....___..._ _ _._ _ ___._ _ ____.
Equation
(8)of Raines et al.
(1974)is,
z
0(x) = ((4T/QD + j Lu(x) w)/j Cu(x) w)l/Zwhere
z
0
(x) = local characteristic impedance of the vessel at the
termination
Thus,
T
= shear stress
L (x) = inertance per unit length
uC (x) =compliance per unit length
u(Z
0(x)) 2 = (4T/QD
+
j L (x) w)/j C (x) w) u u (14)Now, the equation for the Poiseuille flow of Raines et al.
(1974)is
1fTD
- - = p 81f µQ
P A
T
=
8 µQ= __
8'-'µ"'Q'---_ AD {1f/4)D2 DSubstituting the above values in equation
(14),one has
=
(ZO(X))2
z
0 (x) =
The equation for
128 µ/1fD4
+
j L (x) w u= ---~----j C (x) w
u
j
c
u
w (128 µ/ 1f04+
j Lu
(x)=
jc
w (j C (x) w)u
u
- c
u u
L w2+
j (128µ/1fD4 )c
u
w- c
u
w 2L
u
128 µj = - -
c
1f
n
4 Cu
wu
(L
u u
/C - j 128 µ; 1f04 C w)l/2u
the reflection coefficients of
w)
Raines et al.
(ls)
(16)
where the magnitude of K is
K = (Real(K) 2 + Imaginary(K) 2) 1
1
2 The phase angle of K is·e
= tan -1 Imaginary(K) Real (K)In order to solve equations (17), (18) and (19), it was
(17)
(18)
(19)
necessary to find the unknown values in the equations (14) and (16).
The value of the blood viscosityµ is taken from Raines et al. (1974),
and the value of the diameter D at the distal end of the radial artery
is taken from Westerhof et al. (1969). Including the values obtained
in the previous discussion, the required values of CT' RT' D and µ are
as follows:
CT= 0.2004xl0-l0 m5/N
~
= 0.1546xl011 Ns/m 5D
= 0.0028m
µ = 0.45xl0-2 Ns/m2
For the normal case, the time period is 0.77.
Thus,
w
= 2 ~ x 1/0.77 rad/secInertance Lu = P/A0 = 0.1050xl04/0.06335xl0-4 = 0.16575xl09 kg/m5 In order to find the value of C (which was needed in equation ( 16)), u
a
cu
= A(p0,x) (c
0 )= (0.06335xl0-4 ) (l.23xl0-S)
(C~
is already found.)C
u = 7.792lxl0-4 m4/N ( 20)While writing the program, the complex quantities were handled by
treating the real and imaginary parts separately, and then combining
them together to find K.
Thus, by using the obtained ratio R1/RT = 0.1, we get R !(ulnar) -- 0 1 (R • T(ulnar) ) = 0.1 (0.1546xl011 )
10 5
= 0.1546xl0 N-s/m
R 2(ulnar) = 0. 9 (RT(ulnar» = 0.9 (0.1546xl0 ) 11
11 5 = 0.139lxl0 N-s/m Similarly,
Rl(distal) = 0.1 (RT( distal» 0.1546xl0= 10 N-s/m 5
R2(distal) = 0.9 (RT( distal» = 0.139lxl011 N-s/m5
( 21)
(22)
( 23)
(24)
The heart rate was calculated from the value of the time period
for the normal pressure waveform.of the brachia! artery from Mason et
al. (1964):
Heart rate= (!/time period) = (l/0.77 sec) (60 sec/min) (beats)
= 78 beats/min
TABLE 1. Model parameters for the control case
Parameter description
heart rate blood density blood viscosity pulse wave velocity equation of state
linear compJ.iance term nonlinear compliance term ulnar branch
first resistance second resistance terminal compliance distal end
first resistance second resistance terminal compliance
Symbol
R 1( ulnar) R 2(ulnar)
c
T(ulnar)Rl(distal) R2(dis tal) CT(distal)
Value
0.78 102 0.105 104 0.45 10-2 o. 88 10 1
0. 8487 10-s 0.3020 10-9
0.1546 10 10 0.1391 10 11 0.2004 10-10
0.1546 10 10 0.1391 10 11 0.2004 10-10
Uni ts beats/min 3 kg/m Ns/m 2 m/s 5 Ns/m 5 Ns/m
m5 /N
5
Ns/m 5 Ns/m
[image:48.566.60.493.244.571.2]In order to apply the proximal boundary condition, the first 7
Fourier coefficients for the sine and cosine terms have been found
from the normal pressure waveform of the brachial artery taken from
Mason et al. (1964). The values have been listed in Table 2, and
the corresponding pressure waveform plotted using those coefficients
is shown in Figure 8. The obtained pressure waveform is in good
agreement with the original pressure waveform taken from Mason et
al.
(1964).
TABLE 2. Fourier coefficients for the proximal pressure wave
for the control case (time period
=0. 77 seconds)
Harmonics
Cosine coefficients
Sine coefficients
(N/m 2)
(N/m 2)
0
0.1015 105
o.o
l
-0.9154 102
0.2251 104
2
-0.9154 103
0.1457 104
3
-o.
7785 103
-0.5809 102
4
-0.4535 103
0. 2554 102
5
-0.2247 103
-0.2067 103
6
-0.4539 102
-0.1373 103
[image:49.564.56.432.341.545.2]FIGURE 9. The pressure waveform obtained using the Fourier
coefficients in Table 3 (for the case of hypertension)
FIGURE 10. The pressure waveform obtained using the Fourier coefficients in Table 4 (for the case of AS
(valvular aortic stenosis))
FIGURE 11. The pressure waveform obtained using the Fourier coefficients in Table 5 (for the case of AI (pure aortic regurgitation))
FIGURE 12. The pressure waveform obtained using the Fourier coefficients in Table 6 (for the case of AS/ AI