ISSN: 2278-3075,Volume-8 Issue-11, September 2019
Abstract: Water supply at DI Molek (Irrigation area of Molek, Kepanjen Regency-Indonesia) is deficit on the low and dry discharge seasonal year. To solve this problem, there is needed to reallocate water supply for getting the maximum benefit. This study intends to optimize the irrigation water supply at DI Molek. Water supply for irrigation in this area is not enough during dry season. It is needed a pattern of water supply allocation to get the maximum net benefit for allocating water supply in this season. The Dynamic Programming is used to carry out this problem. Result shows that the benefit of water supply allocation at DI Molek would be increase 6.37% for low discharge seasonal year and 10.86% for dry discharge seasonal year..
Keywords : optimization, irrigation water supply, DI Molek, Dynamic Programming
I. INTRODUCTION
The various application modeling have been applied to carry out the optimization of cropping pattern including the linear and nonlinear optimization models as well as the
simulation models[1]-[4]; chance-constrained linear
programming models and deterministic linear programming [5], the approach of interactive fuzzy multi-objective optimization [6], the approach of goal program [7], the approach and application of multi-objective fractional goal
programming [8], and the model of genetic algorithm [9]
The selected planned adaptation handling in the
agricultural sectors includes the adjustment of crop variety, planting dates, and crop water-re-allocation [10]. If the crop water requirement is not too enough, the crop yield will be reduced. However, the crop water requirement and the yield reduction are varied for the different crop [11]. Therefore, one of the most important crop yield factors is to provide the crop water requirement. If the water supply is decreasing, the crop yield will be reduced as well [12].
Revised Manuscript Received on September2, 2019.
Lily Montarcih Limantara*, Department of Water Resources, Faculty of Engineering, University of Brawijaya, Indonesia Indonesia. Email: [email protected].
Sari Narulita, Department of Water Resources, Faculty of Engineering, University of Brawijaya, Malang, Indonesia. Email: [email protected]
Although the farmers aim to use the maximum water
for irrigating their crop, even in the case of no
limitation for water resources, it does not seem logic.
However, under such conditions, it is required to be
efficient in water use and to be carried out the
optimization in the field [13]-[14].
The irrigation area of Molek (DI Molek) has the area of 3,983 ha which is surrounded at 3 districts that are Kepanjen, Kromengan, and Sumber Pucung. Di Molek has the main channel with some structure of division, tapping, and division-tapping. The discharge that has to be flowed to every irrigation structure, has to be accurately analyzed so it can be produced the maximum result and has ability to get the optimal profit. At DI Molek, for planning in 2009/2010, the irrigation water supply is deficit mainly for the second cropping season such as on the period of low and dry discharge seasonal year. This research intends to re-study for solving the water deficit. One of the models which will be used in this study is Dynamic Programming. Optimization model is generally formed by combining the system behavior due to the objective function of the system itself [15]-[18].Dynamic Programming is an approach for optimizing the decision process in multi-stages. There are two types of Dynamic Programming that are deterministic and stochastic. This study uses the kind of stochastic one. Stochastic program handles the situation which part or the whole parameters of the problem are expressed in random variables. The situation is indeed seen as the reality in everywhere included in hydrosystem which it is difficult to determine the parameters exactly. Sensitivity analysis can be used for studying the effect of the parameters value change and the probability on the optimal solution [17][19][20]. This case is very suitable with the irrigation network system which has some division structures that are related among them. 3
This study intends to make efficient the water allocationin at DI Molek as optimal as possible, so that it can fullfill the irrigation water demand on rainy as well as dry season in one period cropping season that is fitted to the approach of cropping pattern regarding to the cropping plan. Optimal condition in this study is meaned that the water supply can irrigate the available area so that can produce the maximum benefit which is in this study is expressed in the product yield.
Optimization of Water Allocation at Irrigation
Area of Molek-Kepanjen Regency of Indonesia
Using Dynamic Programming
Dynamic Programming
The problem that is studied consists of irrigation water supplyin DI Molek, the pattern of water distribution in each division and tapping structure, and division-tapping structure by using Dynamic Programming, so that can be obtained the maximum benefit and the optimal irrigation area.
II. MATERIALANDMETHOD
A. The Elements on the Model of Dynamic Programming
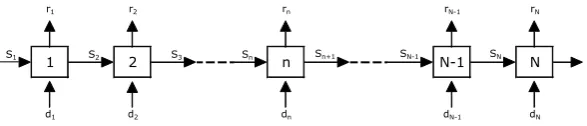
S1 S2 S3 Sn
rn rN-1 rN
SN
N
d2 dn dN-1 dN
n Sn+1 SN-1
N-1 1
d1 r1
2
[image:2.595.152.446.116.179.2]r2
Fig. 1 Diagram of Dynamic Programing
The scheme of Dynamic Programming Model is presented as in the Fig. 1., However, the elements of Dynamic Programming consist of as follow regarding to the Fig. 1 [17]:
1.Stage (n). Stage is a part of problems which the decision is
decided. If a problem can be divided into N sub-problem, so there are N stages in the Dynamic Programming formulation. Stage in this studyconsists of the location among the structure of division, tapping, division-tapping on the main channel of Molek
2.Decision Variable (dn).Decision variable is a decision that
is decided on every stage of the formulation. Decision variable in this study consists of the ocation discharge or the discharge need in every irrigation structure and the net benefit of the case. Decision which is decided in every stage will be transformed into the next decision on the next stage.
3.State Variable (Sn). State variable presents the state of a
system that is related to the stageof n. The function of the state variable is relating the stages consecutively. Therefore if every stage is separately optimized, it can produce the feasible solution for all of the problems. Then, the optimal decisions can be determined for the rest stage without controlling as the reason of the next decision due to the decision before. For the stage of n, the state variable is in the
back (Sn) and it is mentioned as the input state. However the
state variable in front of it (Sn+1) is mentioned as the output
variable. The state variable in this study consists of water suply that is continuously in the intake of Blobo Weir.
4.Stage Return (rn). Stage return is defined as the scalar size
of decision that is decided in every stage. The stage return is a
function that consists of the input state variable (Sn) and
output state variable (Sn+1), and dn (decision), so the function
can be formulated as follow.
rn = r(Sn, Sn+1, dn) (1)
Stage return in this study consists of the benefit. The benefit is the function of discharge on the seasonal discharge condition.
5.State Transition or Stage Transformation (tn). State
transformation or state transition is a single value that presents
the relation among the input state (Sn) -output state (Sn+1)
variables. However, dn (decision) presents the equation as
follow:
Sn+1 = tn(Sn,dn) (2)
In this study, stage transformation consists of the change of water supply until the water distribution in each irrigation structure A-Z on the main channel of Molek. The steps of analysis on the water allocation optimization by using Dynamic Programming with forward recursive are as follow:
1. To determine the activity as the stage that is allocation of
discharge for each structure of the tapping, division, and division-tapping on the main channel of Molek regarding to the benefit of the whole optimization process of water distribution.
2. To make the table which consist of the unsure as follow:
a. Inflow and outflow discharge (after water supply is
allocated) to the whole structure of division, tapping, and division-tapping A-Z on DI Molek. In this study, the
inflow and outflow discharge beginning from 0 m3/s, 0.02
m3/s, 0.04 m3/s, etc. until 5.88 m3/s for low discharge
seasonal year and until 4.16 m3/s for dry discharge
seasonal year. However, this value is as the maximum water supply in the period of second cropping season for low discharge seasonal year and dry discharge seasonal
year with the grid of 0.02 m3/s.
b. The benefit of the allocated discharge is based on the
benefit of irrigation as the function of discharge on each structure of division, tapping, and division-tapping on DI Molek.
c. On the stage (n) of tapping structure (BS), A is started
with only one state of maximal inflow discharge because for the less state than maximal inflow discharge, the maximum benefit is the same as the benefit on the maximum inflow discharge on the stage (n). The division structure (BB) X that is ended by only one state minimal inflow discharge, remembering it has produced the whole maximal benefit for the whole stages.
d. The benefit of each stage for each discharge is as the
return of the whole stages.
3. Then, go back and return to the first stage that is
transformed into the next stage until the last stage. However, it can produce the maximum benefit.
4. The maximal benefit on the last stage is as the whole total
policy
ISSN: 2278-3075,Volume-8 Issue-11, September 2019
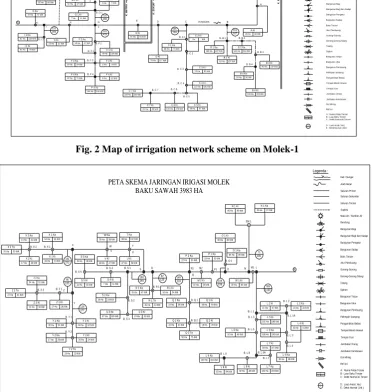
[image:3.595.110.483.123.516.2]Fig. 2 and 3 present the map of irrigation network scheme on the DI Molek
Fig. 2 Map of irrigation network scheme on Molek-1
Fig. 3 Map of irrigation network scheme on Molek-2
B. The Basic Concept of Dynamic Programming
The Dynamic Programming that is used in this study is stochastic one. Stochastic Dynamic Programing is as the dynamic programming with a probability distribution for determining in the decision stages consecutively [21]. This study uses Dynamic Programing due to the consideration as follow:
1. On the Dynamic Programming case, there is no standard
mathematic formulation, so the selected equation or function can be fitted to the each situation.
2. The optimization is on each structure of division,
tapping, and division-tapping which is in each structure there is cropped with the variety of crop so the variables are random
C. Irrigation water need
Vegetation or crop needs water in order to be able to be grown and well produced. However, the water is come from the irrigation water or rain. However, the Irrigation water is an amount of water that is usually taken from the reservoir or
river and flowing through the irrigation system network to maintain the water balance in the irrigation area [22]. Indeed, the water that evaporates through the vegetation leaves (usually mentioned as transpiration) is influenced by the climate condition as well as very related with the factor of crop that consists of the crop type, the crop variety, and the growing age of crop [22]. However, the crop water need is an amount of water that is loss due to the process of evapotranspiration. The crop water need is formulated as follow [22]
ET = k . ETo (3) Where:
ET = water need for crop/ potential evaporation (mm/day) k = coefficient of crop, depended on the type, variety, and the age of crop
ETo = potential evapotranspiration (mm/day)
Irrigation water demand has to be fitted with the inflow discharge [23]-[24].
C 1 Ka
115 Ha G 2 Ki
F 3 Ka
F 4 Ka 7 Ha
47 Ha I 1 Ka
52 Ha 81 Ha a 14 Ha 78 lt/dt 122 lt/dt I 1 Ki
B. I 1
19 Ha 21 lt/dt H Ki 200 98 lt/dt K Ka K 47 Ha I 71 lt/dt 65 Ha G 3 Ki
133 H 31 Ha
216 lt/dt 144 Ha
F 4 Te 71 lt/dt
B. F 4 F 4 Ki 8 Ha 12 lt/dt
C 7 Ki 21 Ha 32 lt/dt C 7 Ka 100 Ha150 lt/dt
B. C 7 319
B. F 1
29 lt/dt B. F 3 B. F 2 27 lt/dt F 2 Ka 18 Ha
F 3 Ki F 1 Ki
4 Ha 79 Ha
6 lt/dt 119 lt/dt 479 B. G 1 G 1 Ki
11 lt/dt 47 lt/dt B. G 2 F G 338 225 G 1 Ka 5 Ha 7 lt/dt
34 Ha 51 lt/dt E Ki
49 Ha D Ki 78 Ha117 lt/dt
E D
G 3 Ka 117 Ha176 lt/dt B. G 3
SUPLESI PALAAN K . BR AN T AS
B 3 Ki
C 3 Ki 91 Ha
C 6 Ki C 5 Ki 173 lt/dt 58 Ha 87 lt/dt
110 Ha B. C 6
B. C 5 B. C 4 B. C 3
165 lt/dt 80 lt/dt
C 4 Ki 53 Ha
B 4 Ka 24 Ha
B 4 Ki 103 Ha155 lt/dt 36 lt/dt 237 lt/dt 74 lt/dt
B. C 2 B. C 1 759
Ha
158 Ha lt/dt C 2 Ki
B 1 Ka 506
C IS MOLEK
A Ki 611
B 2 Ka B. B 2
137 lt/dt B 1 Ki 91 Ha
144 Ha B. B 1
917
B. B 4 216 lt/dt B. B 3
30 lt/dt 20 Ha B A 137 lt/dt 5961 3974 B. BLOBO K . SU KUN K . M E T RO
A : Nama Petak Tersier B : Luas Baku Tersier C : Debit Normal di Tersier C
D E BA
D : Luas Areal ( Ha ) E : Debit Normal ( l/dt ) Got Miring Jembatan Kendaraan Rel lori Jembatan Orang Tempat Mandi Hewan Tempat Cuci Bangunan Ukur Bangunan Pembuang Pengambilan Bebas Pelimpah Samping Bangunan Terjun Talang Siphon Bangunan Bagi dan Sadap
Boks Tersier Gorong-Gorong Silang Alur Pembuang Gorong-Gorong Bangunan Pengatur Bangunan Sadap Mata Air / Sumber Air Bangunan Bagi Bendung Arah Aliran Saluran Primer Saluran Sekunder Saluran Tersier Legenda :
Kali / Sungai
Suplesi
PETA SKEMA JARINGAN IRIGASI MOLEK BAKU SAWAH 3983 HA
P 1 Ka
Q 1 Ki
Q 2 Ki
16 Ha 34 Ha 25 Ha
22 Ha B. S 5
18 lt/dt 12 Ha 17 Ha 26 lt/dt
B. Y 2 Y 2 Ka 17 Ha 26 lt/dt
Y 2 Te 15 Ha 23 lt/dt Y 1 Ka 36 Ha 54 lt/dt
B. Y 1 Z 2 Te
30 lt/dt 20 Ha
27 Ha X 2 Te
36 Ha
34 Ha
41 lt/dt Z 2 Ki
B. Z 2 51 lt/dt X 2 Ki 17 Ha
Z 2 Ka 26 lt/dt
90
Z
Z 1 Ki B. Z 1
Y 135 54 lt/dt X 1 Ki
141 211 B. X 1 54 Ha B. X 2 X 2 Ka 14 Ha 21 lt/dt 81 lt/dt
X 1 Ka X
118
35 lt/dt 100 lt/dt S 3 Ka
Y 2 Ki 24 lt/dt Y 1 Ki
52 lt/dt 177
67 Ha B. S 3 23 Ha
S 3 Ki
Q 2 Ka 22 Ha
75 lt/dt 50 Ha
B. Q 2
Q 2 Te 33 lt/dt 19 Ha 35 Ha
47 lt/dt U V
27 lt/dt
S 4 Ki S 5 Ki
33 lt/dt S 2 Ka 16 Ha 24 lt/dt
7 Ha 38 lt/dt S 5 Ka
B. S 4 18 Ha
V Ki
240
B. S 2 11 lt/dt
R 1 Ka 31 Ha U Ki B. S 1 37 Ha 160 S 56 lt/dt 58 lt/dt 39 Ha W
W Ka T Ka
98 Ha147 lt/dt T
224
35 lt/dt Q 1 Ka
149 123
R 1 Te 53 lt/dt B. R 1
23 Ha R 1 Ki 16 Ha 24 lt/dt 82 R
M 2 Ki
B. Q 1 16 Ha 35 Ha 24 lt/dt 33 lt/dt Q P2 P 2 Ka 22 Ha
M2 23 Ha
31 Ha 47 lt/dt 21 Ha 31 lt/dt
B. L 7 L 7 Ka 102 Ha 98 Ha 100 Ha 132 Ha
63 Ha L 9 Ki
94 lt/dt 32 Ha 48 lt/dt L 8 Ki L 6 Ka 32 Ha
L 9 Ka 103 Ha154 lt/dt
B. L 9 29 lt/dt
48 lt/dt
B. L 8 B. L 6A B. L 1 B. L 5
B. L 6
153 lt/dt L 4 Ki
B. L 3 150 lt/dt
L 4 Ka 65 Ha 147 lt/dt L 7 Ki
98 lt/dt B. L 4 198 lt/dt L 3 Ka L 5 Ki
10 Ha B. L 1A
15 lt/dt 1183 789 71 104 53 lt/dt 156
B. O 1 O P1 35 lt/dt
64 Ha 96 lt/dt
M 1 Ki 30 Ha 45 lt/dt
M1 N 106 L 60 lt/dt 40 Ha
O 1 Ki
O 1 Ka 46 Ha 69 lt/dt
N 1 Ki 25 Ha
BN 1 37 lt/dt N 1 Ka
L 2 Ka L 2 Ki B. L 2
a
A : Nama Petak Tersier B : Luas Baku Tersier C : Debit Normal di Tersier C
D E BA
D : Luas Areal ( Ha ) E : Debit Normal ( l/dt ) Got Miring Jembatan Kendaraan
Rel lori Jembatan Orang Tempat Mandi Hewan Tempat Cuci Bangunan Ukur Bangunan Pembuang Pengambilan Bebas Pelimpah Samping Bangunan Terjun Talang Siphon Bangunan Bagi dan Sadap
Boks Tersier Gorong-Gorong Silang Alur Pembuang Gorong-Gorong Bangunan Pengatur Bangunan Sadap Mata Air / Sumber Air
Bangunan Bagi Bendung Arah Aliran Saluran Primer Saluran Sekunder Saluran Tersier Legenda :
Kali / Sungai
Suplesi
Dynamic Programming
The factors that influence the water demand in intakestructure of water irrigation are as follow: 1) Irrigation area; 2) Planned cropping pattern; 3) Potential evaporation; 4) Coefficient of crop; 5) Technique of area preparation; 6) Percolation; 7) Effective rainfall; and 8) Efficiency of irrigation
III. RESULTSANDDISCUSSION
The example of optimization analysis on the water allocation by using Dynamic Programming on the low discharge seasonal year is as follow:
1. On stage-1 in Division Structure (BB) A with the outflow
of 0 m3/s, the water supply is 5.88 m3/s and it is produced
the irrigation benefit as the discharge function in amount of Rp 468,770,000.00, the outflow discharge is 0.02
m3/s, for the water supply is 5.86 m3/s and the produced
irrigation benefit as the discharge function of Rp 468,770,000,00; etc. Until the outflow discharge is 5.88
m3/s.
2. From the whole outflow discharge and water supply, it
will be produced the maximum benefit of stage-1 on the tapping structure (BS) A
3. The maximal benefit on the stage-1 is transformed into
the next stage that is the for Division Structure (BB) B.
4. On the stage-2, the water supply is 0 m3/s that produces
the benefit the same as the benefit on the stage-1 by adding with the benefit of irrigation as the discharge function on the Division Structure (BB) B that produces the maximal benefit on the last stage. For example:
Water supply 0.02 m3/s
Maximal benefit = 468,770,000 + 704,164,801.65 = 1,172,934,801.65
Water supply 0.04 m3/s
Maximal benefit = 468,770,000 + 1,408,329,603.30 = 1,877,099,603.30
etc., until the water supply is 5.88 m3/s
5. From the whole maximal benefit in the last stage for one
state, there is selected the maximal benefit and maximal inflow discharge on the last stage that is related with the maximal benefit,
6. If all of the cell on the table of optimization has been
filled, it has to be returned to the same procedure (beginning from the step 2) for the next step until the last step.
Based on the whole optimization result by using Dynamic Programming on the DI Molek, if there is carried out the return tracking, it is obtained the optimal lane as the discharge allocation. The optimal lane on the strucutres of division, tapping, division-tapping A-Z for low discharge
seasonal year is as follow: 0.66 m3/s3 – 0.76 m3/s- 0.64 m3/s-
0.10 m3/s- 0.06 m3/s- 0.4 m3/s- 0.28 m3/s- 0.02 m3/s- 0.18 m3/s-
0.06 m3/s- 1.00 m3/s- 0.04 m3/s- 0.10 m3/s- 0.14 m3/s- 0.04
m3/s- 0.04 m3/s- 0.04 m3/s- 0.20 m3/s- 0.12 m3/s- 0.22 m3/s-
0.14 m3/s- 0.06 m3/s- 0.04 m3/s- 0.06 m3/s- 0.20 m3/s- 0.16
m3/s- 0.12 m3/s and for dry discharge seasonal year is as
follow: 0.02 m3/s- 0.86 m3/s- 0.74 m3/s- 0.10 m3/s- 0.04 m3/s-
0.44 m3/s- 0.30 m3/s- 0.02 m3/s- 0.18 m3/s- 0.06 m3/s– 0.68
m3/s- 0.02 m3/s- 0.04 m3/s- 0.06 m3/s- 0.02 m3/s- 0.02 m3/s-
0.02 m3/s- 0.08 m3/s- 0.06 m3/s- 0.08 m3/s- 0.06 m3/s- 0.02
m3/s- 0.02 m3/s- 0.02 m3/s- 0.08 m3/s- 0.06 m3/s- 0.06 m3/s.
Based on the optimization of water allocation by using Dynamic Programming, it shows that the discharge that can
be flowed into the Division Structure-A for low discharge seasonal year (Q dependable of 75%) is in amount of 0.66
m3/s and the maximal irrigation area that is irrigated by the
Division Structure-A is 20 ha. It can be reached when the
discharge is in amount of 0.04 m3/s. It means that the benefit
has reached the maximal condition on the discharge of 0.04
m3/s, so for the more discharge will produce the same benefit
that is produced when the maximal area on the discharge of
0.04 m3/s. Therefore, there is surplus of water supply on the
low discharge seasonal year (Q dependable of 75%) in
amount of 0.62 m3/s in this study. The surplus water can be
used for irrigating the area under it that is still in the serviced area of Blobo Weir.
On the low discharge seasonal year, the maximal
discharge is 1.00 m3/s and on the dry discharge seasonal year,
the maximal discharge is 0.68 m3/s that produces the total
benefit on the low discharge seasonal year is in amount of Rp 9,402,511,895.42 and on the dry discharge seasonal year is in amount of Rp 10,233,921,094.61.
For the comparison, the total maximal benefit for paddy and second crop (palawija) on the low discharge seasonal year is as follow: for the existing condition is in amount of Rp .43,370,749,500/00 and after optimization is in amount of Rp 46,319,655,792,55. The total benefit on the dry discharge seasonal year: for existing condition is in amount of Rp 43,370,749,500.00 and after optimization is in amount of Rp 48,657,194,114.61.
IV. CONCLUSION
Based on the analysis as above, it can be concluded as follow:
1. The planned cropping pattern that is still fullfilled by the
dependable discharge so there is obtained the less or the same irrigation wáter demand as the irrigation wáter supply for paddy/ second crop/ sugar reed-paddy/ second crop/ sugar reed-paddy/ second crop/ suger reed. For the period of rainy season, dry season-1 (MK 1) and dry season 2 (MK 2) on the enough discharge seasonal year (Q dependable of 26%), normal seasonal year (Q dependable of 51%), and rainy season (MH), dry season-1 (MK 1) on the low discharge seasonal year (Q dependable of 75%) and dry discharge seasonal year (Q dependable 97%, the irrigation wáter demand has to be able to be fullfilled by the wáter supply. However, for the period of dry season-2 (MK 2) on the low discharge seasonal year (Q dependable of 75%) and dry discharge seasonal year (Q dependable of 97%), due to the irrigation wáter demand has not been fullfilled, so it is carried out the optimization with Dynamic Programming so it is obtained the maximal irrigation wáter demand for
the low discharge seasonal year in amount of 1.00 m3/s
and for the dry discharge seasonal year in amount of 0.68
m3/s, however, the average of irrigation wáter demand for
the low discharge seasonal year is 0.19 m3/s and for the
ISSN: 2278-3075,Volume-8 Issue-11, September 2019
2. Result of Dynamic Programming analysis presents the
optimal irrigation water allocation that has to be flowed into each Division Structure (BB), Tapping Structure (BS), and Tapping-Division Structure (NNS) for the low and dry discharge seasonal year each as in the Table I and II below.
Tabble I: Water supply for Division Structure on the low discharge seasonal year
Type of division structure
Water suooly (m3/s)
BS.A 0.66
BB,B 0.76
BB.C 0.64
BS,D 0.10
BS.E 0.06
BBS.F 0.40
BBS.G 0.28
BS.H 0.02
BB.I 0.18
BS.K 0.06
BB.L 1.00
BS.M1 0.04
BB.N 0.10
BB.O 0.14
BS.P1 0.04
BS.M2 0.04
BBS.P2 0.04
BBS,Q 0.20
BB.R 0.12
BB.S 0.22
BS.T 0.14
BS.U 0.06
BS.V 0.04
BS.W 0.06
BB.X 0.20
BB.Y 0.16
[image:5.595.57.283.150.446.2]BB.Z 0.12
Table II: Water supply for Division Structure on the dry discharge seasonalyear
Type of Division structure
Water supply (m3/s)
BS.A 0.02
BB.B 0.86
BB.C 0.74
BS.D 0.10
BS.E 0.04
BBS.F 0.44
BBS.G 0.30
BS.H 0.20
BB.I 0.18
BS.K 0.06
BB.L 0.68
BS.M1 0.02
BB.N 0.04
BB.O 0.06
BS.P1 0.02
MS.M2 0.02
BBS.P2 0.02
BBS.Q 0.08
BB.R 0.06
BB.S 0.08
BS.T 0.06
BS.U 0.02
BS.V 0.02
BS.W 0.02
BB.X 0.08
BB.Y 0.06
BB.Z 0.06
3. The maximal area that can be irrigated on each of the
structure of division, tapping, tapping-devision based on the discharge constraint after optimization by using dynamic programming is 100% with the total combination area as follow: 1,899 ha for paddy and 2,035 ha for second crop on the low discharge seasonal year. However, on the dry discharge seasonal year is 1,167 ha for paddy and 2,767 ha for second crop (three times cropping in one year).
4. By using Dynamic Programming, the benefit of DI
Molek on the low discharge seasonal year is Rp 46,319,655,792.55 and on the dry discharge seasonal year is Rp 48,657,194,114.61. However, there is the increasing of benefit in amount of 6.37% on the low discharge seasonal year and 10.86% on the dry discharge seasonal year.
REFERENCES
1. M. Haquari, M.N. Azaiez, M.N., “Optimal cropping patterns under water deficits”, European Journal of Operational Research, 130: 133–146, 2011
2. D.K. Singh, C.S. Jaiswalb, K.S. Reddya, R.M. Singha, R.M., and D.M. Bhandarkar, “Optimal cropping pattern in a canal command area”, Agricultural Water Management, 50: 1–8, 2001
3. A. Montazar and A. Rahimikob, “Optimal water productivity of irrigation networks in arid and semi-arid regions”, Irrigation and Drainage, 57: 411–423, 2008.
4. B. Kaur, R.S> Sidhu, and V. Kamal, “Optimal crop plans for sustainable water use in Punjab”. Agricultural Economics Research Review, 23: 273–284, 2010
5. L.N. Sethi, S.N. Panda, and M.K. Nayak, “Optimal crop planning and water resources allocation in a coastal groundwater basin, Orissa, India”, Agricultural Water Management, 83: 209–220, 2006
6. H. Zhou, P. Hui, and Z. Chi, “An interactive fuzzy multi-objective optimization approach for crop planning and water resources allocation. In: Bio-Inspired Computational Intelligence and Applications”, Lecture Notes in Computer Science, 4688: 335–346, Springer, Berlin-He, 2007. 7. N. Vivekananda, K. Viswanathan, and G. Sanjeev, “Optimization of cropping pattern using goal programming approach”, OPSEARCH, 46: 259–274, 2009
8. A.M.A. Abdulkader, A.I.A> Amoud, and F.S. Awad, “Optimization of the cropping pattern in Saudi Arabia”, Agric.Econ-Czech, 58, 2012(2), page 56-60, 2012
9. M. Karamouz, B. Zahraie, R. Kerachian, and A. Eslami, “Crop pattern and conjunctive use management: A case study”. Irrigation and Drainage, 59: 161–173, 2010.
10. IPCC, Climate change 2007: Synthesis Repot. In: Pachauri R. K Reisinger A. (eds.): Contribution of Working Groups I, II, and III to the Forth Assessment Report of the Intergovernmental Panel on Climate Change. IPCC, Geneva, Switzerland, 2007
11. T.M. Sarai, M. Parsinejad, and H. Babazadeh, “Efficacy of partial root drying technique for optimizing soybean crop production in semi-arid regions”, Journal of Irrigation and Drainage 61(1) 8088, 2012 12. N. Faghihi, H. Babazadeh, H. Sedghi, and F. Pazira, E., “Optimization
of irrigation planning and cropping pattern under deficit irrigation condition using genetic algorithm, Indian” Journal of Fundamental and Applied Life Sciences, Vol. 5 (S3), pp. 566-577, 2015
13. P. Moutonnet, ”Yield response factors of field crops to deficit irrigation”, Irrigation and Drainage, Paper No 22, FAO, Rome, Italy, 2002
14. L. Gurovich and P. Oyarce, “Optimization cropping pattern using chance constraint linear programming for Koga Irrigation Dam, Ethiopia” Irrigat Drainage Sys Eng, 4:135. doi:10.4172/2168-9768.1000135, 2015.\
Dynamic Programming
16. H. Budieny, F. Nurrochmad, and Darwanto, “Analisis Optimasi Pengelolaan Sumberdaya Air Waduk Sermo”, Media Teknik, No 1 Tahun XXIV Edisi Februari , hal 51-57, 2001
17. L.M. Limantara, “Optimization of improvement and management on Sumber Brantas watershed, East Java, Indonesia”. Journal of Basic and Applied Scientific Research, Vol 1(3) page 231-235, 2011
18. B. Satyagraha, M. Bisri, L.M. Limantara, and U. Andawayanti, “Model of water economic value optimization based on the land use change”, Journal of Water and Land Development, 36 (I-III): 143-152, 2018
19. W. Soetopo and L.M. Limantara, “Optimization of multiplication sinus model for irrigation area of Metro upstream river, East Java, Indonesia”. International Journal of Academic Research, Vol 1(3) page 65-70, 2010
20. P.T. Juwono, L.M. Limantara, W. Soetopo, and A. Nopebrian, “Optimization of irrigation cropping pattern”, International Journal of Geomate, Vol. 15 (50): 197-204, 2017
21. P. Subagyo, M. Asri, and T.H. Handoko, Dasar-Dasar Operation Research.Yogyakarta: BPFE, 1981.
22. Suhardjono. Kebutuhan Air Tanaman. Malang: Institut Teknologi Nasional. 1994
23. L.M. Limantara, M. Bisri, and R. Fajrianto, “Optimization of water usage at irrigation area of pakis-malang rehency-indonesia by using linear programming”, International Journal of Engineering and Technology, Vol. 7{4}: 6432-6436, 2018
24. R. Shreedhar, Chandrashekarayya, G. Hiremath, dan G. G. Shetty. “Öptimization of cropping pattern using linear programmg for Mrkandeya Command Area”, International Journal of Scientific and Engineering Research, Vol. 6(9): 1311-1326, Sep, 2015
AUTHORSPROFILE
Lily Montarcih Limantara, Lecturer on the Department of Water Resources, Faculty of Engineering, University of Brawijaya, Jl. Mt Haryono No 167 Malang, Indonesia Email: [email protected]