International Journal of Innovative Technology and Exploring Engineering (IJITEE) ISSN: 2278-3075, Volume-8 Issue-7, May, 2019
Abstract: (Please read carefully abstract of the template). The precise and prompt spatial categorization of the soil varieties and the forecast of crop yield rooted in the spatial big data have emerged as significant factors for the realistic purposes. In this regard, the spatially explicit crop-type information may be fruitfully utilized so as to evaluate the crop areas for a host of monitoring and decision-making applications like the crop insurance, land rental, supply-chain logistics, and the financial market forecasting. The underlying motive behind the current investigation is to effectively describe a modified support vector machine (MSVM) technique to effectively classify the soil type. The recommended crop and crop yield forecast is solely dependent on the soil type. In this regard, it is highly essential for the effective farm management to have appropriate output forecast in accordance with the amalgamation of several factors having a corresponding impact. In the document, three key functions like the big data decrease, soil categorization, and the crop recommendation including output forecast are performed. As a matter of fact, the crop changes from one farm to another on the basis of the planting dates, diversity, soil environment and the crop organization. With the result, it becomes indispensable to have an effective determination on the category of soil to be used. In the paper, the input is represented by the big data. The category of soil is ascertained by means of the procedure of the map reduce framework. The map reduction, in turn, is effectively attained with the help of the kernel principle component analysis (KPCA). Incidentally, the map reduction involves two key procedures such as the mapper and reducer. While the soil category is decided in the mapper side, the investigating procedure occurs in reducer side. Further, the innovative technique takes due consideration of the recommendation and output forecast of the crop, by elegantly employing an Optimal Artificial Neural Network classifier (OANN). In the document, the crop is recommended and the output forecast is carried out for the future years.
Index Terms: Soil, Crop Yield prediction, spatial big data, MSVM, KPCA, OANN and Map reduction.
I. INTRODUCTION
The ongoing challenges in the universal public health supervision mainly involve the effective assessment of the risk put forward by the contagious disease outbursts with better awareness of their usual geographic range. As there is an ever-zooming growth in the dimension of the spatial epidemiology data, it has become the need of the hour to effectively employ fruitful intelligence in the related data. In this regard, the spatial epidemiology data has emerged as the cornerstone of big data and health analytics issues in the domain of the digital epidemiology [1]. The Big Data, in
Revised Manuscript Received on May 10 , 2019
Aakunuri Manjula, Research Scholar in CSE, JNTUH Hyderabad, Telangana State, India
Dr. G. Narsimha, Professor and Head of the Department of CSE, JNTUH College of Engineering Sulthanpur, Telangana State, India.
quintessence, is characterized by parameters such as the volume, velocity, and the variety of data. Further, it has become a Herculean Task to effectively process the big data by means of the time-honored data processing methods and devices. Of late, the big data analytics has been stylishly doing the rounds in several spheres like the healthcare, business practices, scientific exploration, natural resource administration, share marketing, social networking, community organization and climate modeling [5]. However, there are several roadblocks in the process such as those encountered in the data acquisition, storage, search, sharing, transfer, analysis, and visualization. However, the conventional techniques find a Waterloo in smoothly managing the Big Data [2]. Moreover, the dimension, diversity, and modernization rate of certain spatial datasets known as the SBD are far beyond the reach of the underwhelming spatial computing methods [3]. In a large number of instances, the overlay assessment turns out to be a prolonged process in view of the fact that it entails effective management of colossal quantity of the spatial data [4]. Further, it is very difficult to represent the spatial big data without reference to value proposition and user experience, which are largely based on the computational platform, use-case, and dataset at hand. The spatial data, in essence, characterize the discrete illustrations of uninterrupted incidents occurring on the surface of the earth. In this regard, the raster, vector, and the network are the three vital models which characterize the spatial data. One of the examples of the raster data are the satellite images [6]. It is to be noted that precise classification of crop categories is a must for the scientific as well as practical purposes. Moreover, the crop-type categorization has become one of the essential conditions for carrying out the forecast of crop output. Habitually, the corn is sown well-ahead of the time when soybean is sown, and the grass typically begins its growing season in the spring which is prior to a majority of the crops [7]. The entire soil samples were categorized based on the soil orders and soil groups, and soil spectral curves of the identical group were averaged as the spectral reflectance of the matching soil group [8]. Various investigations have been carried on the crop productivity and soil water balance with the help of the crop growth models by effectively deploying several constraints from diverse climate models. In the meanwhile, climate variability has emerged as one of the increasingly vital attributes having a vast impact on the year-wise crop production, even in the hi-tech agricultural domains turning out superior yield [9]. The soil profile traits required for the crop simulations have been gathered from the Natural Resources Conservation Service.
An Effective Soil Classification and Prediction
of Crop Yield Using Spatial Big Data
Plainly speaking, the soil in the Crossville was represented by a silt loam soil of 1.8 m depth, in Tift by a loamy sand of 2.0 m depth and in Alachua by a sandy soil of 2.5 m depth [10].
In fact, a large chunk of the soil properties are protracted and expensive to estimate, in addition to habitual variations over a period of time. Hence, the swift and precise forecast of soil properties has become the need of the hour so as to successfully deal with the deficiency of the estimated soil property data [11]. Further, the output forecast rooted in the blend of several traits having a sway over it has emerged as significant requisite for effective farm management. In this regard, cotton assumes significance as a very noteworthy crop, more particularly for a country like Greece. In fact, there has been a zooming necessity for the superior estimates of output yield and overall biomass production. The crop administration habitually centers round the overall experience of the cultivator for the field managed by him [12]. Further, the crops have emerged as the most pervasive anthropogenic biome throughout the length and breadth of the cosmos, lavishly contributing their significant mite towards the universal cycles of carbon, water, and nutrients [13]. It is possible to effectively remove a portion of the crop residues from the land, without in any way leading to soil degradation and exhaustion of organic matter or causing any decrease in the fertility of the soil. It has to be borne in mind that the crop residue removal has to be cautiously carried out taking due cognizance of the minimum level of crop residue which has to be kept undisturbed on the land so as to preserve the soil quality, soil organic matter and scale down the risk of erosion [14]. Even though the crop models have originally designed exclusively for the homogeneous field scenarios, they continue to be extensively employed in various domains such as the farm, region, nation, continent and the world. Further, sweeping executions of crop models are progressively employed for the purpose of the crop growth modeling and universal policy issues where the agriculture contributes its significant part, including climate variations [15]. Several crop models offer fruitful techniques so as to effectively forecast the future impacts on crop yields. In this regard a host of crop simulation methods like the CERES-Maize (Crop Environment Resource Synthesis), CERES-Wheat, SWAP (soil–water– atmosphere–plant), and the InFoCrop are extensively employed with a view to assess the probable impacts of the climate changeability on the crop production, more particularly to estimate the crop yield-climate sensitivity in the backdrop of diverse climate situations [9].
II. LITERATURESURVEY
The precise yield evaluation and the optimized nitrogen management which are all the more necessary in the domain of the agriculture are, of late, extensively employed in devising the decision support devices for the modern farming techniques so as to significantly scale up the yield production and nitrogen management, simultaneously decreasing the working expenses and adverse impact on the ecosystem. Nevertheless, the RS based methods entail the effective processing of the colossal quantum of the remotely sensed data from diverse platforms. With the result, zooming significance is, of late given to the machine learning (ML)
techniques thanks to their sterling skills to effectively carry out the processing of gigantic number of inputs and successfully tackling of the nonlinear functions.
Chlingaryan et al. [16] charismatically carried out the assessment of several investigations carried out by enthusiastic experimenters during the course of one and a half decades related to the machine learning based methods dedicated for the precise crop yield forecast and nitrogen status evaluation. They established the fact that the speedy advances in the sensing methodologies and ML methods were competent to offer the cost-conscious and all-inclusive solutions for the superior crop and eco state evaluation and decision making. Further, the enhanced targeted application of the sensor platforms and ML methods, the combination of diverse sensor modalities and specialist knowledge, and the design of the hybrid systems integrating several ML and signal processing methods were to be the contributing factors of the precision agriculture (PA) which constituted the key testing segment of their investigation.
International Journal of Innovative Technology and Exploring Engineering (IJITEE) ISSN: 2278-3075, Volume-8 Issue-7, May, 2019
Further, they carried out an assessment of the optimum number of features required for the purpose of optimizing the outcomes from their tentative data set. The novel technique was fruitfully used to evaluate the winter wheat yield in the Shandong province, which represented one of the key winter-wheat-growing areas in China. They came out in flying colors by effectively forecasting the yield well ahead of the harvest i.e. Approximately six weeks before the harvest with an incredibly superior accuracy, furnishing an average accuracy to the tune of 95.64%, with an average error of forecast of 0.236 t/ha and correlation coefficient of 0.801 founded on a nine feature model.
The enhanced crop output is habitually achieved by means of adding the biochar to soils. Still, test outcomes fluctuate generally and are based on the investigational set-up, soil attributes and states, while contributory techniques have not been able to offer the required elucidation. Credit goes to Jeffery et al. [19] for effectively assessing the association between the biochar and crop productivity. The consequential outcomes illustrated by and large a minute, though statistically important, advantage of the biochar application to soils on the crop productivity, yielding an impressive mean increase of 10%. Still, the mean outcomes for each and every assessment carried out within the meta-analysis covered an extensive gamut. The maximum (positive) effects in respect of the soil assessments were observed in the acidic and neutral pH soils, and in soils with a coarse or medium texture. It was evident that two key systems for the yield enhancement might have been subjected to a liming impact and an enhanced water holding capacity of the soil, together with the superior crop nutrient accessibility. The maximum positive outcome was observed in the biochar applications at a rate of 100 t ha−1 (39%). Of the biochar feed stocks taken into account and with regard to the crop productivity, poultry litter showcased the most robust (noteworthy) positive impact to the tune of 28%, vis-à-vis the biosolids, the only feedstock achieving a statistically important negative impact to the tune of −28%. Nevertheless, many an auxiliary data set was imperfect and the whole range of pertinent soil types, together with the ecological and managerial stipulations had not been tested. In addition, only interim investigations restricted to time duration of 1 to 2 years were available at that time. They drew attention to the urgent necessity for a strategic investigation survey so as to entail exposition of techniques , distinguished by ecological and administration factors and also for carry out relevant investigations extending to elongated time durations.
Milne et al. [20] were instrumental in assessing the on past yields by means of three types of the k-means clustering together with geo-statistical smoothing. They assessed and compared the results with the yield response to added nitrogen. They were able to gather the data on the wheat yield for three years on 2187 1010 m squares in a 29-ha field in the English midlands. They introduced two methods to group the squares by a ‘hard’ meaning method. In the first technique, they employed their resemblances similarities which were adapted with their spatial covariance function. In the second approach, they effectively made use of their differences which were customized by means of their variogram. In the third technique, they evaluated their
They envisaged novel data, models and knowledge products which were well-equipped with the skills of giving momentum to the innovation procedure which was highly essential for the effective realization of the sustainable local, regional and global food security. They were also successful in working out preferred attributes for the models, and enlightened on certain probable advances envisaged by them for the model components and their integration. Antle et al. [22] admirably advocated an innovative performance
stratagem which was capable of connecting a
“pre-competitive” space for model expansion to a “competitive space” for the knowledge product progress and by means of the private-public partnerships for the novel data infrastructure. The specified model improvements largely relied on additional investigation and appraisal of the modern techniques, the progress and exploration of the modular model segments and amalgamation, and associations of model amalgamation platforms to new-fangled data management and visualization devices.
III. PROBLEMDEFINITION
Normally, the crop development technologies encounter several challenges which put roadblocks in the path of achieving the precise preliminary parameters at the spatial scale, especially during the time when the accessibility is restricted to field scale data only. However, nowadays, there is increasing enthusiasm in integrating the sophisticated technology and agriculture with the intention of incredibly increasing the production of crop yield. In phase with the swift progress of the novel sophisticated technology, it is only natural to expect the crop techniques and predictive devices to emerge as the vital component of the precision agriculture. The following is a general review of a few of the related challenges.
i. The enhanced targeted application of the sensor platforms and ML methods, the combination of diverse sensor modalities and specialist knowledge, and the improvement of hybrid systems duly integrating several ML and signal processing approaches may emerge as the significant module of the precision agriculture (PA) which has become a key issue in crop yield [16].
ii. In the spatial big data challenges, an effort is made to carry out the inference on colossal quantum of measurements which are closely linked to the specific locations and time instances in which those measurements are performed. The consequential evaluation challenges are exceedingly different from the traditional data mining ones, thereby throwing open extremely dissimilar scalability issues and the performance requisites [2].
iii. The Model testing (YIELDSTAT) has indicated a number normalized mean bias error to the tune of 3.02% across the deficiencies in the model, locating the yield-diminishing attributed which have not yet taken into account. On the whole, the technique has established its fitness-for-purpose for replicating the
spatial yields, in the backdrop of unspecified future climate scenarios [17].
iv. It so happens that several kinds of crops grow jointly in a tiny area. Nevertheless, the crop yield is only linked to the NDVI data extracted from the related crop planting regions. Hence, detection of the crop planting region also adds to the vexed issues in the region of the crop yield.
v. The changes in the pixel values of the NDVI images during the identical time duration between the succeeding years and the statistical inter annual change of wheat yield to guide the SNN model have created grave issues in the vital segment of the estimation model expansion and accomplishment [18].
vi. The assessment of the climate science, with special focus on the storage, appraisal and visualization of the data and information has cropped as key issue in the domain of the big data [22].
IV. PROPOSEDMETHODOLOGY
International Journal of Innovative Technology and Exploring Engineering (IJITEE) ISSN: 2278-3075, Volume-8 Issue-7, May, 2019
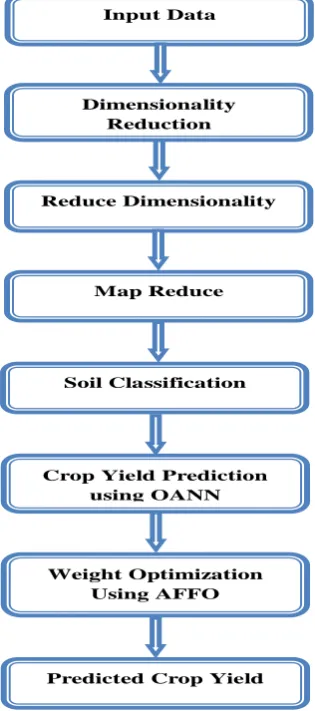
The overall flow diagram of the performed technique gets illustrated in the following Fig.1.
The main stages of the recommended technique is,
The Big data decrease
The Soil categorization
The Crop yield forecast
Big Data Reduction
At first, the input spatial data is subjected to the dimensionality decrease technique. For the purpose of incredibly decreasing the dimension, the novel method elegantly employs the kernel based PCA (KPCA) technique, which is well-explained in the following section..
Kernel Principal Component Analysis (KPCA)
The Kernel Principal Component Analysis (KPCA), in essence, represents an extension of the Principal Component Analysis (PCA) methods with the kernel techniques. With the effective deployment of the kernel, originally linear functions of the PCA are carried out for reproducing the kernel Hilbert space. The modus-operandi of the KPCA is beautifully pictured below.
Input Data
Dimensionality Reduction
Map Reduce Reduce Dimensionality
Soil Classification
Crop Yield Prediction using OANN
Weight Optimization Using AFFO
[image:5.595.90.248.349.705.2]Predicted Crop Yield
Fig 1: Proposed Soil Classification and Prediction of Crop Yield First, generate the kernel matrix, depending on the
input data.
Then, evaluate the kernel principal component value
By means of the above procedure, the input big data is decreased and the condensed soil data is furnished as the input for the map reduces structure.
Map Reduce Structure
This represents an effective processing and carries out the analysis of big data on a large number of servers. It is parallel and the distributed mega data processing paradigm has been comprehensively investigated and generally accepted as the big data application, of late. The Map Reducer incredibly showcases the qualities of added dominance, elasticity and cost-consciousness, thanks to the prominent features of the cloud computing. The map reduces structure, in turn, embraces two distinct phases such as the Mapper and reducer phases. In the mapper phase, the input data is taken in and segregated into the M map and the training procedure is also carried out separately in the reducer phase, the projected testing procedure is efficiently performed.
Soil categorization
For the purpose of the soil categorization, the novel method effectively employs the modified support vector machine algorithm (MSVM). In this section, two kernel functions like the linear and the quadratic kernel functions are integrated for the purpose of realizing superior performance ratios. By means of the deft blend of the two outcomes, the average overcome is calculated and effectively employed to locate the hyper plane. The MSVM procedure encompasses two key phases like the Training and Testing phases. In the former i.e. the training phase, near the boundaries or hyper plan data are highly essential. In the latter is the testing phase, the training score value is duly taken into account. Depending on that, the input soil data is duly categorized. The anticipated average of the kernel function
avg
k(
A
,
B
)
is furnished by means of the following Equation (1).
c
b
a
b
a
c
b
a
B
A
avg
k T 22
1
2
1
)
,
(
(1)Where a,b represents the inner products and c denotes the stable value.
From the categorization output, the planned method effectively categorizes the kind of the soil. Thereafter, the consequential soil kind is furnished to the crop yield forecast phase.
Crop recommendation and yield forecast
In reality, the precise data on the tendency of historical yield of crop is a significant modeling input, which effectively support the agriculturalists and the governmental agencies in their decision making endeavors aimed at setting up appropriate policies. In the document, an earnest effort is made to bring to light an innovative technique for the purpose of effective crop yield forecast with the assistance of the classifier. In this technique, the suggestion and forecast are carried out by means of the Optimal Artificial Neural Network classifier (OANN). For the purpose, the long-established neural network is duly adapted by means of the optimization approach. In the neural network the weight values get effectively customized by employing the Adaptive fruit fly optimization algorithm (AFFO). The comprehensive account of each and every technique enriches the contents of the following section.
Optimal Artificial Neural Network classifier (OANN)
The artificial neural network (ANN), in quintessence, represents the computational model dedicated for the purpose of storing and regaining the attained knowledge. It deservedly boasts of the dense interrelated computing units which constitute the easy techniques for the complex neurons in the biological systems. The information is duly gained in the course of the learning process and is effectively saved and amassed in the weights of the inter-nodal connections. The sterling quality of the neural networks is concentrated on their innate skills to efficiently characterize the complex input/output associations. The neural network habitually contains the inputs, which are multiplied by weights, and thereafter evaluates a mathematical function which decides the activation of the neuron. A different function carries out the task of calculating the output of the artificial neuron. The configuration of the artificial neural network is elegantly exhibited in Fig.2.
Fig.2 Structure of ANN
If the weight of an artificial neuron is high, the input which is multiplied by it becomes further stronger accordingly. Based on the weights, the calculation of the neuron will not be identical but it will be different. However, by way of adapting the weights of an artificial neuron, it is possible to achieve the desired output for the specified inputs. But it is very difficult to physically arrive at the needed weights, if the ANN is flooded with a gigantic number of neurons. Still, a ray of hope is offered by certain smart algorithms endowed with the skills of effectively adapting the weights of the ANN
for the purpose of achieving the preferred output from the network and an ideal candidate in this regard it the adaptive fruit fly optimization technique, which is colorfully depicted below.
• Adaptive fruit fly optimization algorithm (AFFO) The Fruit fly algorithm, in short, represents a technique which is enthused by the foraging conduct of the fruit flies and is deemed to be a new-fangled technique aimed at the global optimization. It owes its origin to the investigation on the food hunting tendencies of the fruit fly swarm. The Fruit fly, in turn, characterizes an excellent food hunter endowed with sharp osphresis and vision. Initially, it locates the food source by observing an extensive variety of fragrances dancing in the vicinity and moves quickly in the direction of the location concerned. While it comes near the food, it is likely to locate the food or alternatively it may move toward the specified location influenced by its fragile vision. The food sources are duly characterized by the optima and the method of foraging is reproduced by way of the iteratively searching for the optima in the fruit fly. Now, the time-honored fruit fly algorithm is suitably customized with the help of the oppositional technique. In the opposition based learning, the current agent and its opposite agent are concurrently taken into account for the purpose of realizing a superior approximation for the existing agent solution. It is taken for granted that an opposite agent solution boasts of a superior chance to come near the global optimal solution rather than random agent solution. The modus-operandi of the adaptive fruit fly optimization algorithm is elegantly elucidated in the following section.
Step 1: Initialization
The key parameters of the planned AFFO are represented by the total evolution number and random weight value. In the novel approach, the fruit fly corresponds to the random weight value. Initialize the random location of weight value (WX_axis, WY_axis).
Step 2: Opposition based learning (OBL)
With an eye on augmenting the conventional fruit fly algorithm, the oppositional method is brought in. In the opposition based learning (OBL), the current agent and its opposite agent are concurrently taken into account for the purpose of achieving a superior approximation for the current agent solution. It is taken for granted that an opposite agent solution boasts of a superior chance to be nearer the global optimal solution rather than the random agent solution. The opposite weight positions ( ) are efficiently represented by the components of .as per the following Equation (2).
D
n n
n
n
ow
ow
ow
OW
1,
2,...
(2)Where
OW
n
Low
n
Up
n
W
n with
n n
n
Low
Up
OW
,
represents the position ofn
thweight value
OW
min the D thdimension of the oppositional weights.
w1
w2
wn
I1
I2
In
O
Inputs Weights Outpu
International Journal of Innovative Technology and Exploring Engineering (IJITEE) ISSN: 2278-3075, Volume-8 Issue-7, May, 2019 Step 3: Investigation by means of the arbitrary path and
weight value selection. Here,
W
n characterizes the n thlocation of the weight value.
Tn n
n
x
y
WX
WY
W
,
,
e
RandomValu
axis
WX
m
WX
e
RandomValu
axis
WY
m
WY
(3)
Step 4: Best position choice of the recommended weight value is attained by means of the Equation (4) given below.
MSE
n
BW
)
(
Min
BW
nfunction
value
weight
best
(4)
Step 5: Estimate the most excellent weight value by means of the following Equation (5).
(MSE)
min
selection]
Excellent
weight
[Excellent
(5)Step 6: Maintains the best weight value and x, y coordinate, the fruit fly swarm tends to employ the visualization to make a movement in that direction as illustrated in the following Equation (6).
MSE
value
weight
selected
min
)
(
WX
-axis
WX
Excellenti
ndex
)
(
WY
-axis
WY
Excellenti
ndex
(6)Step 7: Enter the consecutive optimization to repeat the implementation of stages 3-6. Subsequently assess if the new weight value is superior to the past weight value. If yes, carry out the task 7. Thus, by effectively exploiting the AFFO technique, the weight values are optimally shortlisted. When the optimal weight values are ascertained, they are duly deployed the neural network. The evaluation of the suggested bias function for the input layer is illustrated in the Equation (7) given below.
1 0 3 3 2 21
...
...
h
n
n n
i
w
I
w
I
w
I
I
w
Bias
(7) Estimate the activation function with the assistance of Equation (8) given below.
Biase
Bias
Active
1
1
(8)Calculate the learning error as exhibited in the following Equation (9). 2 1 0
)
(
2
1
' n h n nActual
Obtained
Output
(9) In accordance with the procedure detailed above, the innovative optimal artificial neural network effectively suggests the crop in addition to forecasting the yield of the crop. The test outcomes of the new-fangled technique are best illustrated in the ensuing section.
V. RESULT ANDDISCUSSION
Here, an all-inclusive account of the outcomes ushered in by the novel Soil categorization in the spatial data mining which is elegantly executed in the working platform of the JAVA by
the Map-reduce structure with the Hadoop. The following section gives a bird’s eye-view of test results and the performance of the novel technique.
5.1. Evaluation Metrics
The evaluation tools such as the Sensitivity, Specificity, Accuracy, Precision, recall, and F-measure are effectively employed to assess the efficiency in performance of the epoch-making technique. Further, the benchmark count values like the True Positive (TP), True Negative (TN), False Positive (FP) and False Negative (FN) are also elegantly employed in the technique.
Sensitivity
The Sensitivity is defined as the ratio of a number of true positives to the sum of true positive and false negative which is effectively exhibited in the following Equation (8). 100 FN of No TP of No TP Noof y
Sensitivit (8)
Specificity
The Specificity is defined as the ratio of a number of true negatives to the sum of true negatives and false positives, as exhibited in Equation (9) given hereunder.
100 FP of No TN of No TN of No y
Specificit (9)
Accuracy
The Accuracy is effectively estimated by means of the measures of sensitivity and specificity and is demonstrated by means of the following Equation (10).
100 FN FP TN TP TN TP
Accuracy (10)
Precision
By the term ‘Precision’ what is meant it the closeness of two or more dimensions to one another. It is duly defined as the ratio of the true positive to the sum of true positive and false positive and it is illustrated by means of the following Section (11).
100
Pr
FP
TP
TP
ecision
(11)Recall
100
Re
FN
TP
TP
call
(12)F-Measure
The F-Measure encompasses the harmonic mean of the combinations of the precision and recall and is calculated as exhibited in the ensuing Equation (12).
recall
precision
recall
ecision
Fmeasure
2
*
Pr
*
(13)5.2. Performance analysis
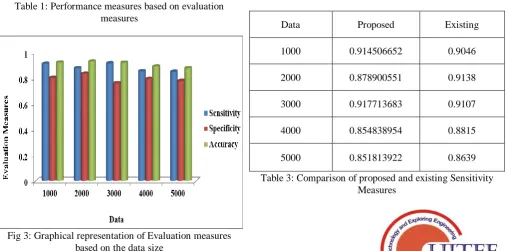
In the following section, the performance assessment of the novel technique is colorfully picture. Now, the Table.1 effectively exhibits the performance appraisal of the ground-breaking technique. In this regard, various parameters such as the sensitivity, specificity, accuracy, precision, and Recall and f-measure value are employed to assess the performance. Given below is the performance assessment of the novel technique in the backdrop of varying values of the data size.
Data Sensitivity Specificity Accuracy
1000 0.914506652 0.80397843 0.924636486
2000 0.878900551 0.837750722 0.932042531
3000 0.917713683 0.762665741 0.922885688
4000 0.854838954 0.796487393 0.892582003
5000 0.851813922 0.780735729 0.879679342
[image:8.595.44.552.58.786.2]Table 1: Performance measures based on evaluation measures
Fig 3: Graphical representation of Evaluation measures based on the data size
Data Precision Recall F-measure
1000 0.982548 0.910600635 0.953204972
2000 0.967349645 0.877690721 0.921438536
3000 0.98814705 0.913011674 0.95003102
4000 0.954499366 0.84064301 0.897518045
5000 0.985553225 0.865504804 0.911854233
[image:8.595.185.542.62.506.2]Table 2: Performance analysis by varying on dataset
Fig 4: Graphical representation of our proposed research
5.3. Comparison analysis of performance metrics
The accuracy value emerges as the leading attribute in the soil categorization technique. In this regard, it is highly essential for the technique to yield superior accuracy value so as to offer the most excellent procedure. Fig.4 exhibits the comparative assessment of accuracy value achieved by the categorization process. Here, the existing categorization scheme is furnished as the conservative neural network and KNN classifier.
Data Proposed Existing
1000 0.914506652 0.9046
2000 0.878900551 0.9138
3000 0.917713683 0.9107
4000 0.854838954 0.8815
5000 0.851813922 0.8639
[image:8.595.49.557.538.788.2]International Journal of Innovative Technology and Exploring Engineering (IJITEE) ISSN: 2278-3075, Volume-8 Issue-7, May, 2019
Fig 4: Graphical representation of Proposed and Existing Sensitivity Measures
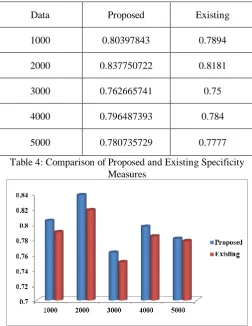
Data Proposed Existing
1000 0.80397843 0.7894
2000 0.837750722 0.8181
3000 0.762665741 0.75
4000 0.796487393 0.784
[image:9.595.41.294.231.558.2]5000 0.780735729 0.7777
Table 4: Comparison of Proposed and Existing Specificity Measures
Fig 5: Comparison of Proposed and Existing Specificity Measures
Data Proposed Existing
1000 0.924636486 0.9046
2000 0.932042531 0.9138
3000 0.922885688 0.9107
4000 0.892582003 0.8815
5000 0.879679342 0.8639
Table 5: Comparison of Proposed and Existing Accuracy Measures
Fig 6: Comparison of Proposed and Existing Accuracy Measures
VI. CONCLUSION
It is well-established that the optimal models have the wherewithal to effectively set up healthy associations between the crop yield and soil classification. The underlying motive of the current investigation is dedicated to the forecasting of the crop yield and classifications of soil which is carried out by our masterpiece mechanism viz. the
modified support vector machine (MSVM) algorithm and optimal artificial neural networks (ANN). The yield forecast is capable of offering fruitful data for prescribing management practices and realizing the sustainable profits in the backdrop of oscillating scenarios. As the crop attributes are competent to directly reveal the crop yield scenarios, the Spatial Big data and neural network in the crop protection assumes zooming significance with vast potentials. The crop yield is elegantly attained with the help of the Optimal Artificial Neural Network classifier (OANN) and the kinds of soils realized by means of the modified
support vector machine (MSVM) technique. In the neural
network the weight values are effectively adapted by effectively utilizing the Adaptive fruit fly optimization algorithm (AFFO). The Neural network habitually offers a dominant structure to the spatial big data. The suitable selection and employment of the optimization and neural network has become the need of the hour to achieve the maximum possible advantages of the related techniques. With the deft deployment of the optimal classifier, the novel technique suggests the crop and forecasts the crop yield for the upcoming years. The paper has come out successful in presenting a general assessment of the investigations carried out by the inquisitive investigators in the domain of the crop yield and classification of soil using the special big data.
REFERENCES
1. Lopez, Daphne, M. Gunasekaran, B. Senthil Murugan, Harpreet Kaur, and Kaja M.Abbas, "Spatial big data analytics of influenza epidemic in Vellore, India, " In 2014IEEE international conference on big data (Big Data), pp. 19-24, 2014.
3. Wang, Lizhe, Ke Lu, Peng Liu, Rajiv Ranjan, and Lajiao Chen, "IK-SVD: dictionary learning for spatial big data via incremental atom update," Computing in Science & Engineering, Vol. 16, No. 4, pp. 41-52, 2014.
4. Wang, Yong, Zhenling Liu, Hongyan Liao, and Chengjun Li, & quot; Improving the performance of GIS polygon overlay computation with MapReduce for spatial big data processing," Cluster Computing, Vol. 18, No. 2, pp. 507-516, 2015.
5. Manogaran, Gunasekaran, and Daphne Lopez, "Spatial cumulative sum algorithm with big data analytics for climate change detection," Computers & Electrical Engineering, Vol. 65, pp. 207-221, 2018. 6. Evans, Michael R., Dev Oliver, KwangSoo Yang, Xun Zhou, Reem Y. Ali,
and Shashi Shekhar, "Enabling spatial big data via CyberGIS: Challenges and opportunities." In Cyber GIS for Geospatial Discovery and Innovation, pp. 143-170, Dordrecht, 2019.
7. Cai, Yaping, Kaiyu Guan, Jian Peng, Shaowen Wang, Christopher Seifert, Brian Wardlow, and Zhan Li, "A high-performance and in-season classification system of field-level crop types using time-series Landsat data and a machine learning approach," Remote Sensing of Environment, Vol.210, pp. 35-47, 2018.
8. Shi, Zhou, QianLong Wang, Jie Peng, WenJun Ji, Huan Jun Liu, Xi Li, and RaphaelA. Viscarra Rossel, "Development of a national VNIR soil-spectral library for soilclassification and prediction of organic matter concentrations,& quot; Science China Earth Sciences, Vol. 57, No. 7, pp. 1671-1680, 2014.
9. Kang, Yinhong, Shahbaz Khan, and Xiaoyi Ma, "Climate change impacts on crop yield, crop water productivity and food security–A review, " Progress in Natural Science, Vol. 19, No. 12, pp. 1665-1674, 2009. 10.Baigorria, Guillermo A., James W. Jones, and James J. O’Brien, "Potential predictability of crop yield using an ensemble climate forecast by a regional circulation model," Agricultural and Forest Meteorology, Vol. 148, No. 8-9, pp. 1353-1361, 2008.
11.Cerdan, Olivier, G. Govers, Y. Le Bissonnais, Kristof Van Oost, Jean Poesen, Nicolas Saby, Alban Gobin et al, "Rates and spatial variations of soil erosion in Europe: a study based on erosion plot data," Geomorphology, Vol. 122, No. 1-2, pp. 167-177, 2010. 12.Papageorgiou, Elpiniki I., Athanasios T. Markinos, and Theofanis A.
Gemtos, "Fuzzy cognitive map based approach for predicting yield in cotton crop production as a basis for decision support system in precision agriculture application," Applied Soft Computing, Vol. 11, No. 4, pp. 3643-3657, 2011.
13.Singh, Devendra, "Generation and evaluation of gross primary productivity using Landsat data through blending with MODIS data," International Journal of Applied Earth Observation and Geoinformation, Vol. 13, No. 1, pp. 59-69, 2011.
14.Scarlat, Nicolae, Milan Martinov, and Jean-François Dallemand, "Assessment ofthe availability of agricultural crop residues in the European Union: potential and limitations for bioenergy use," Waste management, Vol. 30, No. 10, pp. 1889-1897, 2010.
15.Juraj Balkovic, Marijn van der Velde, Erwin Schmid, Rastislav Skalsky, Nikolay Khabarov, Michael Obersteiner, Bernhard Stürmer, Wei Xiong, " Pan-European crop modelling with EPIC: Implementation, up-scaling and regional crop yield validation" , Agricultural Systems, Vol. 120, pp. 61–75, 2013.
16.Chlingaryan, Anna, Salah Sukkarieh, and Brett Whelan, " Machine learningapproaches for crop yield prediction and nitrogen status estimation in precision agriculture: A review," Computers and Electronics in Agriculture, Vol. 151, pp. 61-69, 2018.
17.Mirschel, Wilfried, Ralf Wieland, Karl-Otto Wenkel, Claas Nendel, and Christian Guddat, "YIELDSTAT–a spatial yield model for agricultural crops," European journal of agronomy , Vol. 52, pp. 33-46, 2014.
18.Bose, Pritam, Nikola K. Kasabov, Lorenzo Bruzzone, and Reggio N. Hartono, "Spiking neural networks for crop yield estimation based on spatiotemporal analysis of image time series," IEEE Transactions on Geoscience and Remote Sensing , Vol. 54, No. 11, pp. 6563-6573, 2016. 19.Jeffery, Simon, Frank GA Verheijen, Marijn van der Velde, and Ana
Catarina Bastos, "A quantitative review of the effects of biochar application to soils on crop productivity using meta-analysis," Agriculture, ecosystems & environment , Vol. 144, No. 1, pp. 175-187, 2011.
20.Milne, A. E., R. Webster, D. Ginsburg, and D. Kindred, "Spatial multivariate classification of an arable field into compact management zones based on past crop yields," Computers and electronics in agriculture, Vol. 80, pp. 17-30, 2012.
21.Skakun, Sergii, Belen Franch, Eric Vermote, Jean-Claude Roger, Inbal Becker- Reshef, Christopher Justice, and Nataliia Kussul, "Early season large-area winter crop mapping using MODIS NDVI data, growing degree days information and a Gaussian mixture model," Remote Sensing of Environment, Vol. 195, pp. 244- 58, 2017.