An Empirical Study on the Impacts of Urban Form,
Architectural Elements, Microclimate and Natural
Environment On Microscopic Surface Temperature
Yunnam Jeong, Gunwon Lee
Abstract This study is an examination of the impacts of urban
form, architectural elements, microclimate, and the surrounding natural environment on the microscopic surface temperature of buildings, a major cause of urban heat island effect in summer. It applies urban form and tissue, major elements of the built en-vironment, and green areas, a key component of the natural envi-ronment, as basic factors and microclimate as an interest varia-ble. For this purpose, the surrounding temperatures of selected buildings in Seoul within a 500m radius of the 23 Automated Weather Stations (AWS), measurement points selected by the Meteorological Office, in August of 2017 were analyzed. The study employed hierarchical regression analysis using ordinary least squares (OLS). The results show that urban form and tissue mostly demonstrate a relationship with the microscopic surface temperature of buildings, as opposed to building form variables. It is also found that microclimatic elements such as temperature, wind speed, and humidity are relevant to microscopic surface temperature. This study is meaningful in that it sheds new light on the role of urban planning in reducing the urban heat island effect.
Keywords: Urban design, Hierarchical regression analysis, Urban heat island, Microscopic surface temperature, Urban form and tissue, Building form and envelope
1. INTRODUCTION
In the decades following the two world wars, rapid eco-nomic growth and soaring automobile use led to skyrocket-ing consumption of fossil fuels. Freon gas applied as a re-frigerant also became commonplace, which resulted in a decline in ozone concentration within the atmospheric ozone layer. Aggravated global warming and changes in the over-all climate are the result of the above problems. There is a near-consensus that cities, the primary habitat for most hu-mans, are a major contributor to this phenomenon, and thus addressing urban issues must be a component of the funda-mental solution.
Modern cities with inefficient structures have been generat-ing environmental impacts, such as excessive energy con-sumption and emission of greenhouse gases and various other pollutants. A surge in horizontal movement driven by urban sprawl and leapfrog development, increased use of energy for vertical movement resulting from overcrowded cities and the development of high-rise buildings, and exces-sive energy use for the maintenance and development of commercial or industrial usages are some examples.
Revised Manuscript Received on May 06, 2019 Gunwon Lee, Korea University, Korea
Yunnam Jeong, Hoseo niversity, Korea
In particular, overcrowded buildings in cities and artificial heat emitted by them have caused congestion of artificial heat. This brings about the urban heat island effect and ele-vated use of cooling energy, which in turn has been exacer-bating environmental problems in cities.
2. Literature review
2.1. Literature review
This study focuses on the microscopic surface temperatures of buildings, which are impacted by the physical environ-ment of cities and buildings, such as urban form and tissue and architectural elements. Since it affects overall urban temperature and the energy consumption of buildings by influencing indoor and outdoor environment in the form of radiant heat, the microscopic surface temperature of a build-ing is a significant factor.
Elements affecting microscopic surface temperature can be grouped into three categories: urban form and tissue; build-ing form and envelope; and natural factors. Studies concern-ing this issue are characterized as follows.
Iain Douglas Stewart (2000) investigated the effect of urban forms on microclimate and of microclimate on the urban heat island effect along an automobile route in Regina, the provincial capital of Saskatchewan, Canada. As for research on the effect on temperature of artificial heat resulting from land use, Taha, H. (1997) analyzed the increase in tempera-ture due to artificial heat in the central area of major cities. Barry, R.G. and R.J. Chorley (1968) investigated various changes in temperature within a forested area in the temper-ate zone in order to examine the temperature-reduction ef-fect of vegetation. Landsberg, H. (1981) also investigated the cooling effect of areas with large parks or high vegeta-tion density. Meier, A.K. (1991) analyzed the cooling effect of green areas in hot climates, while Rosenfeld A.H. et al. (1998) examined the effects of roadside trees and other shade trees on urban heat island mitigation.
Second, research that focused on the effect of building form and cover condition on temperature, notably the study by
Weng et al. (2004, 2011), has been reported. They analyzed the changes in microclimate in relation to land use and land cover, NDVI, and type of vegetation in the city of Indian-apolis. Laurence Pattacini (2012) analyzed the effect of ur-ban form, in particular the type of buildings, on microcli-mate through a CFD analysis case study by the URSULA project focusing on the Wicker Riverside area of Sheffield in the UK. Claire Smith and Geoff Levermore (2008) re-vealed a significant effect for urban space and the design of buildings on microclimate through a literature review. Michele Lazzarini (2011) analyzed the effect of various form elements of buildings on the surface temperature of buildings by converting satellite images of cities and build-ings into a map of the surface temperature of buildbuild-ings in Madrid, Spain. Haiyong
Ding and Wenzhong Shi (2013) divided satellite images of Beijing into the
Table 1: Literature review
Type Author Dependent variables Independent variables
Urban Elements
Julie Ann Futcher & Gerald Mills
(2012)
Building types, urban form (block structures,
block arrangements) Cooling time, Heating time
Reid Ewing & Fang Rong
(2013)
Elements of urban form (density, accessibility,
centrality) Microclimate, Residential choice
Iain Douglas Stewart
(2000) Urban forms, land use Temperature of artificial heat
Taha, H.
(1997) Temperature of artificial heat, land use
Microclimate (Urban Heat Island effect)
Barry, R.G. & R.J. Chorley
(1968)
Building material, building shapes Thermal capacity
Thermal capacity Air flow
Landsberg, H.
(1981) Vegetation density, scale of park
Cooling effect of areas (Local temperature)
Meier, A.K.
(1991) Green area (vegetation)
Cooling effect of areas (Local temperature)
Rosenfeld A.H. et al.
(1998) Shade of roadside tree Urban Heat Island
Building form &
Cover condition
Weng et al.
(2004) Land use, land cover Microclimate
Weng et al.
(2011) Land use, land cover, NDVI, type of vegetation Microclimate Laurence Pattacini
(2012) Building form, building type Microclimate
Claire Smith & Geoff Levermore
(2008)
Design of urban space, design of buildings Microclimate
Michele Lazzarini (2011) Form elements of buildings Surface temperature of buildings
Haiyong Ding & Wenzhong Shi
(2013)
Land use, land cover
Urban Heat Island, Surface temperature of
build-ings
Weizhong Su et al.
(2010) Land use, land cover Urban heat island
Vegeta-tion &
Shade
T.J. Chandler & S. Gregory
(1976)
Type of parks Urban heat island
F.G Hannel
(1976) Time Urban heat island
Yunnam Jeong et al.
(2015) land cover, land use
Microclimate
(Wind speed, Local temperature, Surface tem-perature)
Gunwon Lee & Yunnam Jeong
(2017)
Urban form, land use, building form, building
use, vegetation Microclimate
Urban form, land use, building form, building
categories of land use and land cover and analyzed the effect of these variables on urban heat island effect and land sur-face temperature. Weizhong Su et al. (2010) analyzed the effect of changes in land use and land cover on urban heat islands in Nanjing, China.
Lastly, research has been reported that focused on natural elements, including season, time of day, wind speed, altitude, and weather. T.J. Chandlerand S. Gregory (1976) measured and compared temperatures of parks in London by time of day. F.G Hannel (1976) found that a heat island occurred only in the daytime in Quinto, Ecuador.
The above studies are meaningful in that they examined the relation between the physical conditions of cities and build-ing temperatures, thereby presentbuild-ing implications in terms of designing the temperature and environment of cities, de-spite having the following three limitations.
First, they failed to generalize any theories, since they mainly relied on observation or tests on a small number of sites.
Second, they did not generate an integrated model reflecting urban form and tissue, building form and envelope, micro-climate and natural environment, and microscopic surface temperature, consequently not performing analysis with any variables controlled. They simply drew a vague relation be-tween physical elements of cities and buildings and micro-scopic surface temperature.
Third, in the same context as the above two points, they show limitations in their research method. They are unable to compare the degree of the impact on microscopic surface temperature of the variables, such as urban form and tissue, building form and envelope, microclimate, and natural envi-ronment.
This study aims to establish a comprehensive model by complementing the limits found in the preceding research and applying a wide range of statistical data while utilizing a more accurate statistical method.
2.2. Hypotheses
Based on the literature review, this study suggests the fol-lowing hypotheses:
First, some elements found to affect the surrounding tem-peratures of buildings in previous research are meaningless according to the statistical model applied in this study. Second, building form elements found to affect the energy consumption of buildings in previous research have a rela-tion to the microscopic surface temperature of buildings and to the surrounding areas as well.
Third, urban form and tissue, microclimate, and the sur-rounding natural environment, which have been neglected in previous research compared to other variables, have a huge impact on microscopic surface temperature.
3. Analysis structure
3.1. Analysis model
OLS (ordinary least squares), a method utilized in this re-search, is a traditional linear model. Hierarchical regression analysis, an analysis technique chosen for the study and based on OLS, groups or blocks various independent vari-ables and applies them in multiple regression analysis in order to compare the degree of impact each independent variable has on the dependent variables. Each previous
model should be nested in the next model. A comparison of adjusted R2 whenever each independent group or block is input can generate a model with more explanatory power and determine the effect of the input of each independent variable in explaining the condition.
Based on this, the following equation was devised.
Here,
microscopic surface temperature of point k surrounding urban form and tissue of point k
form and mass of buildings at point k
envelope and façade elements of buildings at point k surrounding microclimate and natural environment at point k
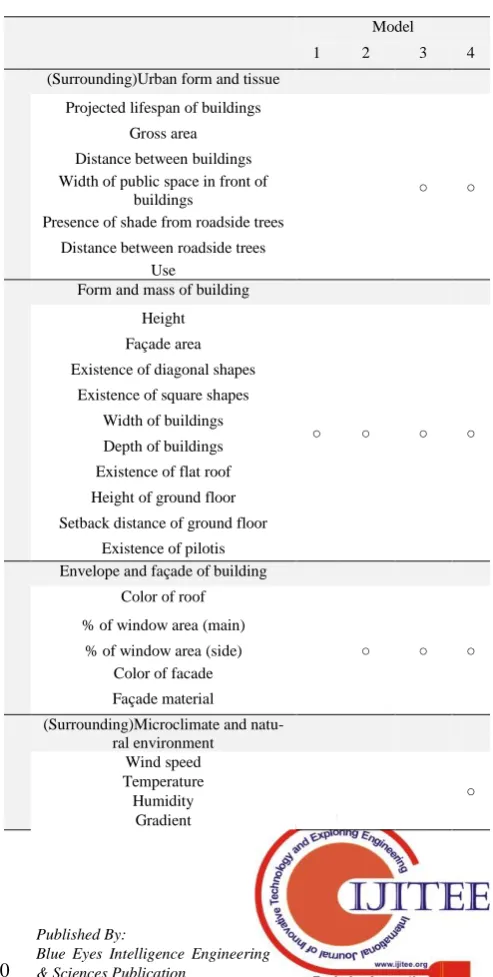
[image:3.595.303.550.340.829.2]According to the aforementioned operation of hierarchical regression analysis, group variables were input into the re-spective models to determine the effect and significance of each group variable.
Table 2: Composition of group variables by model
Model
1 2 3 4
(Surrounding)Urban form and tissue
Projected lifespan of buildings
○ ○
Gross area
Distance between buildings Width of public space in front of
buildings
Presence of shade from roadside trees
Distance between roadside trees Use
Form and mass of building
Height
○ ○ ○ ○
Façade area
Existence of diagonal shapes
Existence of square shapes
Width of buildings
Depth of buildings
Existence of flat roof
Height of ground floor
Setback distance of ground floor
Existence of pilotis Envelope and façade of building
Color of roof
○ ○ ○
% of window area (main)
% of window area (side) Color of facade
Façade material
(Surrounding)Microclimate and natu-ral environment
Wind speed
○ Temperature
Amount of solar radiation
3.2. Variables analyzed
The following variables were applied to verify the above hypotheses.
First, variables related to urban form that have been estab-lished in existing research as influencing microscopic sur-face temperature were employed. The age and density of buildings, distance between buildings, width of public space in front of buildings, presence of shade from roadside trees, distance between roadside trees, and the usages of buildings are some examples.
Second, variables related to building form, particularly those in close relation with the mass and façades of buildings, which have been identified in previous research as affecting the energy consumption of buildings were applied. The height and façade area of buildings, existence of diagonal surfaces in buildings, existence of a four-sided shape for the building plan, width and depth of buildings, flat roofs, and shape of lower levels (height of ground floor, setback dis-tance of ground floor, and presence of pilotis) are examples. As for the elements related to façade, color of the façade, proportion of window area (major orientation and side ori-entation), color of roofs, and façade materials were chosen. Lastly, for variables related to microclimate and ambient natural environment, wind speed, temperature, humidity, gradient, and amount of radiation were employed.
3.3. Analysis target and data
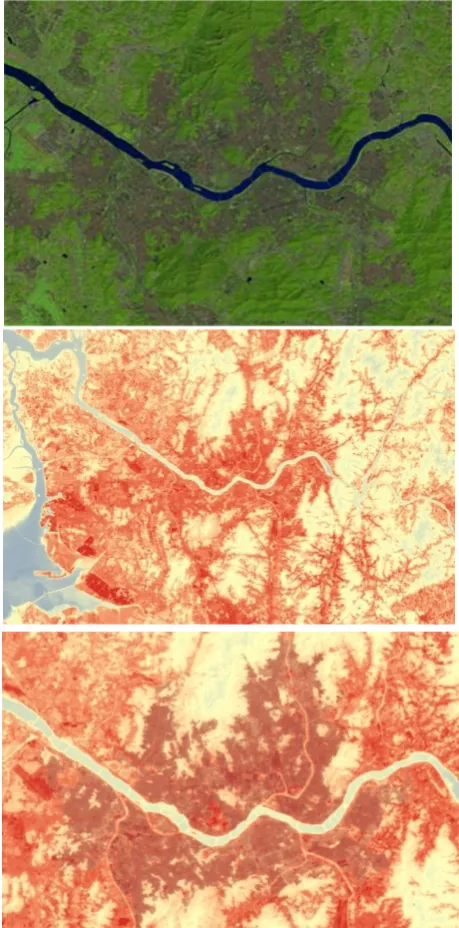
[image:4.595.313.543.186.651.2]This study utilized data on the buildings and 7,560 sur-rounding points within a 500m radius of the 23 AWS meas-urement points selected by the Korean Meteorological Ad-ministration. It applied this 500m radius because studies by Wilmers (1991) and Yunnam et al. (2015) have demon-strated that temperatures are maintained at a similar level within such a boundary. The target areas are shown in Fig-ure 1 below.
Fig. 1: Target areas within a 500m radius of the 23 AWS
Official data regarding the variables of the target areas was provided by the Seoul Government. Building information taken from Architectural administration information system managed by the Ministry of Land, Infrastructure and
Trans-port and microclimate data from AWS provided by the Korean Meteorological Administration were utilized.
For the microscopic surface temperature of buildings, a dependent variable, Landsat 8 satellite image data for the central portion of the Korean Peninsula obtained from the United States Geological Survey (USGC) were converted into thermal imagery.
Thermal images generated by combining the No. 10 and No. 11 bands has a spatial resolution of 100 m×100 m, and, according to the operational definition, microscopic surface temperature, a de-pendent variable in this study, is the temperature of target points within this area. The process in which information on buildings is combined with thermal imagery is shown Figure 2.
Fig. 2: Procedure for combining the surface temperature values extracted from Landsat 8 satellite image data with building location data
[image:4.595.52.288.503.701.2]Table 3: Descriptive statistics for continuous variable
Variables Ave. S.D. Min. M
ax.
Distance between Buildings
(Side) 2.2 2.9 0.0
148 .0
Width of Public Space
in front of Buildings 18.2 44.6 0.0 120
.0
Distance between Roadside
Trees 0.2 1.2 1.0
16. 0
Width of Buildings 11.6 5.1 1.0 114 .0
Depth of Buildings 12.1 4.5 1.0 87. 0 Height of Ground Floor 3.7 0.6 2.0 8.0
Setback Distance of
Ground Floor 0.7 2.1 0.0
55. 0
% of Window Areas
(Main Direction) 0.4 0.2 0.0 1.0
% of Window Areas
(Side Direction) 0.1 0.2 0.0 1.0
Wind Speed 2.2 0.4 0.8 3.4
Temperature 29.8 0.4 29.0 30.
7
Humidity 67.7 2.8 61.4 73.
2
Gradient 2.1 2.1 0.1 19.
8
Amount of Solar Radiation 498,235.2 2,690.9 480,005.8 508, 337. 8 Projected Lifespan of
Buildings 85.0 10.4 0.0
110 .0
Gross Area 503.5 2,377.2 10.0 180
,44 9.0
Height 10.2 5.2 1.5 97.
8
Façade Area 503.4 455.1 55.0 12, 525 .7
Microscopic surface
temperature 28.2 0.8 23.6
[image:5.595.310.546.248.433.2]31. 8
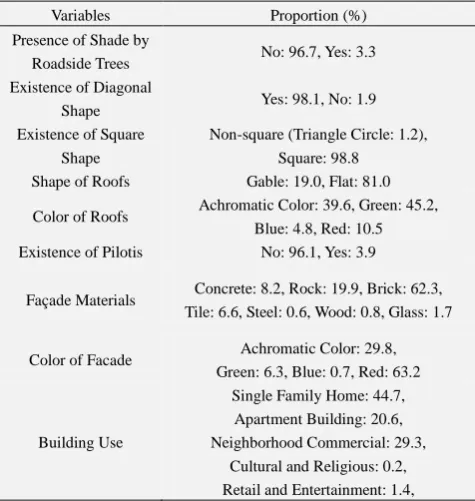
Table 4: Descriptive statistics for dummy variable
Variables Proportion (%)
Presence of Shade by
Roadside Trees No: 96.7, Yes: 3.3 Existence of Diagonal
Shape Yes: 98.1, No: 1.9
Existence of Square Shape
Non-square (Triangle Circle: 1.2), Square: 98.8
Shape of Roofs Gable: 19.0, Flat: 81.0
Color of Roofs Achromatic Color: 39.6, Green: 45.2, Blue: 4.8, Red: 10.5 Existence of Pilotis No: 96.1, Yes: 3.9
Façade Materials Concrete: 8.2, Rock: 19.9, Brick: 62.3, Tile: 6.6, Steel: 0.6, Wood: 0.8, Glass: 1.7
Color of Facade Achromatic Color: 29.8, Green: 6.3, Blue: 0.7, Red: 63.2
Building Use
Single Family Home: 44.7, Apartment Building: 20.6, Neighborhood Commercial: 29.3,
Cultural and Religious: 0.2, Retail and Entertainment: 1.4,
Welfare: 1.0, Office: 2.2, Factory etc.: 0.6
4.
Analysis results
4.1. Comparison of models
A test to review the suitability of OLS as a research method was carried out prior to examining the explanatory power of models. Three hypotheses were examined: normality, inde-pendency among independent variables, and homoscedastic-ity of error.
First, normal distribution of dependent variables was exam-ined. The histogram of microscopic surface temperature shows a bell shape focused on the average value in Figure3.
Fig. 3: Histogram of the buildings surface temperature In addition. skewness and kurtosis tests were also imple-mented, with respective result of 1.1 and 1.4 ( < 2.0), which indicates it is a normal distribution. To allow stricter analy-sis, a Shapiro-Wilk test was carried out as well. The p-value of the result was 0.2 ( > 0.05), which could not dismiss the null hypothesis. Therefore, it was seen to present a normal distribution. As a result of these tests, it was confirmed that the dependent variables for the study show a normal distri-bution. Table 5: Result of VIF test
Variable VIF
Basic condition of buildings
Projected lifespan of buildings 1.89
Gross area 2.08
Public space
Distance between buildings 1.08 Width of public space in front of
buildings 1.07
Vegetation and shade
Presence of shade from roadside
trees 3.70
Distance between roadside trees 3.67
Building use (standard: single family
home)
Apartment building 1.02
Neighborhood commercial 1.86
Cultural and religious 1.05
Retail and entertainment 1.22
Public welfare 1.10
[image:5.595.50.288.531.782.2]Factory, etc. 1.14
Building form
Height 2.6
Façade area 1.11
Existence of diagonal shapes 1.06
Shape of plan
Existence of square shapes 1.04
Width of buildings 2.16
Depth of buildings 1.81
Shape of roof Existence of flat roof 2.00
Shape of lower level
Height of ground floor 1.19
Setback distance of ground floor 1.17
Existence of pilotis 1.11
Color of roof (standard: grey)
Green 1.22
Blue 1.21
Red 1.71
Area of windows
% of window area (main) 1.32
% of window area (side) 1.09
Color of facade (standard: achromatic color)
Green 1.33
Blue 1.30
Red 3.75
Façade material (standard:
concrete)
Rock 3.56
Brick 5.95
Tile 1.88
Steel 1.12
Wood 1.15
Glass 1.17
Wind speed 1.14
Temperature 1.19
Humidity 1.36
Gradient 1.19
Amount of solar radiation 1.13
Average of VIF 1.74
[image:6.595.309.545.50.262.2]Second, independency among the independent variables was examined. To this end, a variance inflation factor (VIF) test was performed to review the multicollinearity of independ-ent variables. The test was carried out using model 4, which applied the largest number of independent variables. The result shows that the average VIF is 1.74, and the variable with the greatest VIF (6.0 < 10) is the façade material bricks. The VIFs of most variables range from 1 to 2, which means a multicollinearity problem does not exist. In other words, independency among independent variables is confirmed.
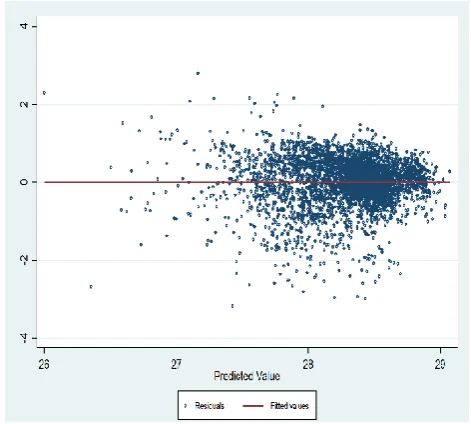
Fig. 4: Scatter plot of residuals
Third, homoscedasticity of error was examined. For this, the independency of residuals resulting from OLS analysis was reviewed. A scatter diagram reflecting the predictive value and residual value of y was drawn, which is shown Figure4. The diagram, a circular form, does not demonstrate any un-usual patterns or patterns with a particular direction. The relevance predictive line of the residuals is ‘0’, which means it has no relevance. These results indicate that the error of the model has independency, thereby showing homoscedas-ticity. The three analysis results above indicate that OLS is a suitable method for this study.
[image:6.595.309.545.525.654.2]Lastly, the R2s of the four models, which applied independ-ent variables for the study, were compared. Degree of f ree-dom was also compared to increase the explanatory power of each model. The model with the best explanatory power was chosen through this process. As shown in the table be-low, Model 4 is the most suitable for the analysis of the data in the study.
Table 6: Comparison of models.
Model
1 2 3 4
Adj. R2 0.034 0.046 0.278 0.700
Number of Input
Inde-pendent Variables 10 24 37 42
1Degree of Freedom 14 5 2
2Degree of Freedom 430 419 417
∆Adj. R2
0.012 0.232 0.422
F 27.86** 16.33** 16.77** 26.71**
< 0.1: †, < 0.05: *, < 0.01: **
4.2. Analysis of results
The results of the analysis of Model 4, which was proved to be the best method through the comparison of the models, are as follows.
First, the relations of the urban form variables and the mi-croscopic surface
floor area of buildings are not meaningful when microcli-mate and ambient natural environment variables are con-trolled, which reveals the significance of the control of these variables. For the aspect of the distance between buildings and the width of public space in front of buildings, it is de-termined that greater width and distance result in a higher surrounding temperature for buildings. This can be ex-plained by the fact that wider space leads to a greater amount of radiation, which is offset by an increase in venti-lation. The degree of impact of these two variables on the surrounding temperature of buildings increases when micro-climate and natural environment variables are controlled, which indicates that these variables are pertinent to
micro-climate and natural environment variables. However, further study is needed in this regard. Meanwhile, both vegetation and shade show a meaningful relation with microscopic sur-face temperature. The presence of shade from roadside trees considerably reduces the ambient temperature of buildings. In the same context, an increase in the distance between roadside trees leads to higher surrounding temperatures. As for the use of buildings, it is found that retail and entertain-ment buildings considerably increase the surrounding tem-peratures compared to single-family houses. In particular, the increase in temperature around factories is remarkable, which can be explained by artificial heat, a similar result to the findings of previous research.
Table 7: Result of Regression
Section Variable
Model1 Model2 Model3 Model4
Coefficient (standard error) Coefficient (standard error) Coefficient (standard error) Coefficient (standard error)
Urban form and tissue
Basic condition of build-ings
Projected lifespan of build-ings
-0.007**
(0.001)
-0.001 (0.001)
Gross area -0.067
**
(0.011)
0.004 (0.013)
Public space
Distance between build-ings
-0.010**
(0.003)
-0.018**
(0.005)
Width of public space in front of buildings
-0.001** (< 0.001)
-0.003** (< 0.001)
Vegetation and shade
Presence of shade from roadside trees
-0.095 (0.100)
-0.319**
(0.095)
Distance between roadside trees 0.019 (0.016) 0.061** (0.017) Use (standard: single family
home)
Apartment building -0.183†
(0.114)
0.115 (0.140)
Neighborhood commercial 0.100
**
(0.025)
0.015 (0.026)
Cultural and religious 0.499
**
(0.199)
0.271 (0.206)
Retail and entertainment 0.286
**
(0.085)
0.260**
(0.108)
Public welfare 0.035
(0.093)
0.112 (0.110)
Office 0.073
(0.078)
0.056 (0.101)
Factory, etc. 0.167
(0.128)
0.485** (0.185)
Form and mass of building
Building form
Height -0.021
** (0.002) -0.020** (0.002) -0.012** (0.003) -0.013* (0.003)
Façade area < -0.001 (< 0.001) < -0.001† (< 0.001) < 0.000 (< 0.001) < -0.001 (< 0.001) Existence of diagonal
shapes 0.003 (0.070) 0.005 (0.069) 0.008 (0.067) 0.282** (0.114)
Shape of plan
Existence of square shapes -0.085 (0.085) -0.050 (0.085) 0.014 (0.086) 0.151 (0.102)
Width of buildings -0.005
* (0.002) -0.006** (0.002) 0.001 (0.003) -0.006* (0.003)
Depth of buildings -0.007
** (0.002) -0.006** (0.002) 0.004 (0.003) -0.002 (0.003)
Shape of roof Existence of flat roof 0.122
Shape of lower level
Height of ground floor -0.045
** (0.016) -0.061** (0.016) -0.059** (0.016) -0.087** (0.019) Setback distance of ground
floor -0.016** (0.005) -0.019** (0.005) -0.014** (0.005) -0.014* (0.007)
Existence of pilotis -0.123
** (0.049) -0.100* (0.049) -0.044** (0.018) 0.019** (0.006) Envelope and façade of
build-ing
Color of roof (standard: grey)
Green -0.020
(0.043)
-0.030 (0.043)
0.031 (0.048)
Blue -0.129
(0.128)
-0.145 (0.126)
-0.151 (0.168)
Red -0.098
** (0.037) -0.080* (0.037) -0.040 (0.040)
Area of windows
% of window area (main) 0.114
* (0.052) -0.033 (0.053) 0.125* (0.056)
% of window area (side) -0.220
** (0.049) -0.226** (0.048) 0.255** (0.055)
Color of facade (standard: achromatic)
Green -0.124
** (0.020) 0.473** (0.003) -0.050* (0.021)
Blue -0.082†
(0.047)
-0.200** (0.004)
0.001 (0.052)
Red -0.014
(0.039) -0.200** (0.004) 0.005 (0.040) Façade material (standard: concrete)
Rock 0.009
(0.041)
0.032 (0.043)
0.080† (0.047)
Brick 0.152
** (0.044) 0.133** (0.046) 0.159** (0.050)
Tile 0.144
** (0.049) 0.053 (0.050) 0.202** (0.061)
Steel 0.312
* (0.130) 0.284* (0.134) -0.092 (0.182)
Wood -0.001
(0.110)
-0.159 (0.110)
0.211† (0.122)
Glass 0.234
** (0.088) 0.246** (0.093) 0.010 (0.119) Surrounding microclimate and natural environment
Wind speed -0.284
**
(0.034)
Temperature 0.399
**
(0.048)
Humidity 0.041
**
(0.004)
Gradient -0.107
**
(0.007)
Amount of solar radiation < 0.001
**
(< 0.001)
Constant 28.709
** (0.111) 28.681** (0.117) 43.419** (2.212) 5.140 (4.234)
< 0.1: †, < 0.05: *, < 0.01: **
Second, the effects of building form variables on the micro-scopic surface temperature of buildings were analyzed. Height, which bears a considerable relation with the overall shape of buildings, contributes to an increase in microscopic surface temperature, while façade area, unlike in the case of the energy consumption of buildings, does not indicate any relevance to their microscopic surface temperature. This can be explained by a diagonal shape in buildings increasing the amount of radiation. It was also determined that the width of buildings is a more meaningful variable than the shape of the building plan, with greater width resulting in higher sur-rounding temperature. Variables related to lower levels show interesting results. All variables indicate a significant relation with microscopic surface temperature. Greater height and setback distance of the ground floor lead to lower
microscopic surface temperature. The existence of pilotis diminished the microscopic surface temperature of buildings. Variables related to the lower levels of buildings show great significance with the ventilation performance of urban space. As for façade, contrary to common belief, buildings with a façade or roof in chromatic colors have only a slight impact on temperature compared to those with achromatic colors. This is the opposite result compared to their effect on the energy consumption of buildings. These variables are mean-ingful when microclimate and surrounding natural environ-ment variables are not controlled. Albedo as influenced by façade and the color of the
while the variables of microclimate and the surrounding natural environment also play an important role in this re-gard. Further study on the interrelation between these two elements or their mediation effect is needed. It was also de-termined that a greater area of windows facing in both a main and side orientation lead to a higher microscopic sur-face temperature, while façade materials such as rock, brick, steel, and wood contribute to an increase in microscopic surface temperature compared to concrete.
Lastly, the relations of microclimate and variables in the surrounding natural environment with the microscopic sur-face temperature of buildings were examined. Higher wind speeds and gradients resulted in lower microscopic surface temperature, while higher temperature, humidity, and amount of radiation led to higher microscopic surface tem-perature for buildings.
4.3. Verification of hypotheses
According to the results of the analysis, the hypotheses es-tablished in Section 2 were verified as follows.
First, some elements that were found to influence micro-scopic surface temperature in previous research turned out to be meaningless in this statistical model. Particularly, fa-çade variables such as the color of the fafa-çade or roof showed similar results to previous research when variables of micro-climate and the surrounding environment were not
con-trolled. However, with these elements controlled, the results changed.
Second, some elements found to influence the energy con-sumption of buildings in previous research do not have an impact on microscopic surface temperature. Buildings’ age, total floor area, and shape of building plan, all meaningful variables in the energy consumption of buildings, do not have any relevance for microscopic surface temperature. These variables have a meaningful relation with surrounding temperature before microclimate and surrounding environ-ment are controlled. However, with these eleenviron-ments con-trolled, the results change. This finding indicates that further investigation on the intricate relation between these vari-ables and microclimate and the surrounding environment variables is needed.
[image:9.595.83.506.393.684.2]Third, urban form and tissue, natural elements which have been relatively neglected in previous research, have the greatest effect on microscopic surface temperature. The in-crement of R2 when urban form and tissue variables are applied (Model 3), and microclimate and the surrounding environment variables (Model 4) are 23.2% and 42.2%, re-spectively. This figure is far higher than the 3.4% and 1.2% found when the building plan (Model 1) and façade ele-ments of buildings (Model 2) are applied. This result shows that microclimate and the surrounding environment are the most important variables, followed by urban form and tissue variables. These variables should not be neglected in the research on surrounding temperature.
Fig. 5: Result summary
5.
Conclusion
As a result of this study, the following implications can be drawn. First, variables of microclimate and the surrounding environment should be considered in research on the micro-scopic surface temperature of buildings. In particular, the
impact of façade elements, such as the color of the façade or roof, on surrounding temperatures decreases when elements of microclimate and the surrounding environment are con-trolled. This result indicates
environment variables are not controlled is warranted, and these variables should be taken into consideration in future research.
Second, the energy consumption of buildings and their mi-croscopic surface temperature show a different relation with certain variables.
Given the fact that microscopic surface temperature affects the energy consumption of buildings, it can be concluded that these two variables have an intricate relationship. As a result, the effects of urban form and tissue, microclimate and surrounding environment variables should be considered in research on microscopic surface temperature. It also appears that the significance of building form and façade elements changes significantly when urban form and tissue, micro-climate, and the surrounding environment are controlled. This result indicates that building form and façade elements, which are expected to influence microscopic surface tem-perature, are also affected by urban form, microclimate, and the surrounding environment, consequently creating an in-teraction effect. It could be that these variables play the role of mediator in the process of a building’s elements affecting microscopic surface temperature. In this regard, further re-search on these variables should be pursued, and there is a need to develop a research model on the interaction effect or mediator effect of these variables.
Finally, the significance of ventilation performance in urban areas should be recognized. The results of this research indi-cate that the building form variables that have a close rela-tion with microscopic surface temperature when variables of urban form and tissue, microclimate, and surrounding envi-ronment are controlled are those related to the form of the lower levels. Given the fact that these variables are closely related to ventilation performance in urban areas, it can be suggested that ventilation performance is significantly rele-vant to surrounding temperature. Among urban form and tissue variables, width of urban space and wind speed also reduce microscopic surface temperature, supporting a simi-lar result. In this light, further research on ways to enhance ventilation is needed.
This study has implications in that it used official data in a comprehensive manner despite dealing with simple and di-rect relations among the variables, which creates a need for further research.
In addition, this study is meaningful in that it provides a basis for the management of climatic environment in urban area, including the urban heat island effect. Considering the fact that urban climatic environment has a fundamental im-pact on human activities within cities, it is expected that an expansion of the research initiated in this study will contrib-ute to the development of a sustainable city model.
Acknowledgement
This research was supported by a grant (code 17CTAP-C133102-01) from Land, Infrastructure and Transport Tech-nologies Promotion Program funded by Ministry of Land, Infrastructure and Transport.
REFERENCES
1. Alan K. Meier. (1990/91), Strategic Landscaping and Air-Conditioning Savings: A Literature Review, Energy and Buildings, 15(3-4), pp.479-486.
2. Arthur, H. R., Hashem, A., & Joseph, J. R. et al. (1998), Cool Commu-nities: Strategies for Heat Island mitigation and smong Reduction, En-ergy and Buildings, 28(1), 51-62.
3. Baruch, G. (1998), Urban Design Effects on the Urban Climate. In Climate Considerations in Building and Urban Design, John Wiley & Sons, Inc.: Denver, USA, 32-58.
4. Chandler, T. J., & S. Gregory. (1976), The Climate of the British Isles, London & New York, Longman Group.
5. Claire Smith, & Geoff Levermore. (2008), Designing urban spaces and buildings to improve sustainability and quality of life in a warmer world, Energy Policy, 36(12), pp.4558-4562.
6. Dana Raydan et al. (2006). Environmental Design of Urban Buildings: An Integrated Approach. Mat Santamouris ed. Earthscan: London, UK. 7. Danny, S. P., & Stephen, F. B. Jr. (1997), Roof Solar Reflectance and Cooling Energy Use: Field Research Results from Florida, Energy and Buildings, 25(2), 105-115.
8. F. G. Hannel. (1976), Some Features of the Heat Island in an Equatorial City, Geografiska Annaler, 58(A), pp.95-109.
9. Gerald, M. (1997), The Radiative Effects of Building Groups on Single Structures, Energy and Buildings, 25(1), 51-61.
10. Gideon, S. Golany. (1996), Urban Design Morphology and Thermal Performance. Atmospheric Environment, 30(3), 455-465.
11. H. Taha. (1997), Urban Climates and Heat Islands: Albedo, Evapotran-spiration, and anthropogenic Heat, Energy and Buildings, 25(2), pp.99-103.
12. Haiyong Ding, & Wenzhong Shi. (2013), Land-use/land-cover change and its influence on surface temperature: a case study in Beijing City, International Journal of Remote Sensing, 34(15), pp.5503-5517. 13. Helmut E. Landsberg. (1981), The Urban Climte, Academic Press. 14. Iain Douglas Stewart. (2000), Influence of meteorological conditions
on the intensity and form of the urban heat island effect in Regina, The Canadian Geographer, 44(3), pp.271-285.
15. Ingegard, E. (1994), Urban-Suburban-Rural Air Temperature Differ-ences related to Street Geometry, Physical Geography, 15(1), 1-20. 16. J. R., Simpson, & E. G., McPherson. (1997), The Effects of Roof
Al-bedo Modification on Cooling Loads of Scale Model residence in Tuscon, Arizona, Energy and Buildings, 25(2), 127-137.
17. Jeong, Y. N., Lee, G. W. (2018), The effects of urban and building form, microclimate, and natural environment on microscopic surface temperature: based on statistical analysis, International Journal of ICT-aided Architecture and Civil Engineering, 5(1), pp.49-56
18. Jeong, Y. N., Lee, G. W., & Kim, S. Y. (2015), Analysis of the Rela-tion of Local Temperature to the Natural Environment, Land Use and Land Coverage of Neighborhoods, Journal of Asian Architecture and Building Engineering, 14(1), 33-40.
19. Julie Ann Futcher, & Gerald Mills. (2012), The role of urban form as an energy management parameter, Energy Policy, 53, pp.218-228. 20. Laurence Pattacini. (2012), Climate and urban form, Urban Design
International, 17(2), pp.106-114.
21. Lee, G. W., & Jeong, Y. N. (2017), Impact of Urban and Building Form and Microclimate on the Energy Consumption of Buildings: Based on Statistical Analysis, Journal of Asian Architecture and Build-ing EngineerBuild-ing, 16(3), 565-572.
22. M., Santamouris. (2011), Heat-island effect. In Energy and climate in the urban built environment, M., Santamouris., Routledge: New York, USA, 48-68.
23. Michele Lazzarini, Fabio Del Frate, & Giulio Ceriola. (2011), Auto-matic Generation of Building Temperature Maps from Hyperspectral Data, IEEE Geoscience and Remote Sensing Letters, 8(2), pp.303-307. 24. P.J., Littlefair, M., Santamouris, & S., Alvarez et al. (2000), Urban
climate In Environmental site layout planning: solar access, microcli-mate and passive cooling in urban areas, BRE: London, UK, 4-6. 25. Qihao Weng, Dengsheng Lu, & Jacquelyn Schubring. (2004),
Estima-tion of land surface temperature-vegetaEstima-tion abundance relaEstima-tionship for urban heat island studies, Remote Sensing of Environment, 89(4), pp.467-483.
26. Qihao Weng, Umamaheshwaran Rajasekar, & Xuefei Hu. (2011), Modeling Urban Heat Islands and Their Relationship With Impervious Surface and Vegetation Abundance by Using ASTER Images, IEEE Transactions on Geoscience and Remote Sensing, 49(10), pp.4080-4089.
27. Reid Ewing, & Fang Rong. (2010), The Impact of Urban Form on U.S. Residential Energy Use, Housing Policy Debate, 19(1), pp.1-30.
28. Roger, G. B., & Richard, J. C. (2003), Boundary layer climates. In Atmosphere, Weather and
29. Roger G. Barry, & Richard J. Chorley, (2009). Atmosphere, Weather and Climate (9th Edition), Routledge.
30. Weizhong Su, Chaolin Gu, & Guishan Yang. (2010), Assessing the Impact of Land Use/Land Cover on Urban Heat Island Pattern in Nan-jing City, China. Journal of Urban Planning and Development, 136(4), pp.365-372.