International Journal of Innovative Technology and Exploring Engineering (IJITEE) ISSN: 2278-3075, Volume-8, Issue-6S4, April 2019
Abstract—An artificial satellite is a human made structure, which is put into space around any planetary body to gather data and impart the equivalent information to ground stations. There is a huge requirement of several types of satellite sensors which are to be mounted on spacecraft or Satellite payloads. To accommodate sensors on Spacecraft, mounting structural elements are needed to support them. This project is mainly focused on the study of those mounting configurations with modeling and analysis of support structure used to mount Sensor in aerospace application. Different configuration of support structure modeled based on the frequency (100 Hz). These models were analyzed to optimize the mass. Work involves modal analysis of the structure made of aluminum and composite material (CFRP). The configuration of mounting structure for sensors is based on various constraints like interface requirements, functional requirement of sensor, stiffness, strength and most importantly the mass. Various configurations of the support structure have to be studied using modeling and analysis software keeping in view the stiffness requirement with minimum mass. For efficient design, composite materials are considered. Normal modal analysis will be carried out to understand the dynamic characteristics of the Mounting structure and the supporting structure was modeled using Al-7075 and CFRP (Composite) materials and the results are compared in the present study.
Index Terms—FEM, CAD, ANSYS, SENSOR, Weight optimization, Space technology.
I. INTRODUCTION
It is the space technology which emerged gradually and now stands as an intellectual achievement of mankind’s success. In our daily life we come across communication, interaction, data transmission and weather forecasting, media broadcasting, live stream and many things are gifts of satellite and space technology. Invariably we use this technology to make our life simpler. Satellite technology is one such mission, perhaps most prominent one. An artificial
Revised Manuscript Received on April 12, 2019.
Ghaleppa B, Department of Mechanical Engineering (VTU) Global
academy of technology Bangalore, India. (E-mail:
AkshayKumar R, Department of Mechanical Engineering (VTU)
Global academy of technology Bangalore, India. (E-mail:
AvulaSaiTharun, Department of Mechanical Engineering (VTU) Global academy of technology Bangalore, India.
Manjunath B R, Department of Mechanical Engineering (VTU) Global academy of technology Bangalore, India.
Gourav S, Department of Mechanical Engineering (VTU) Global academy of technology Bangalore, India.
Narasimha Murthy T S, Department of Mechanical Engineering (VTU) Global academy of technology Bangalore, India.
Suman M S, Department of Mechanical Engineering (VTU) Global academy of technology Bangalore, India.
[image:1.595.340.486.411.503.2]satellite is manmade object, which is placed into orbit around any planetary body to collect information and to communicate the same to ground stations, some of the most famous missions of Indian space research are Chandrayaan 1, Mars orbiter mission spacecraft and many (refer fig.1).The complex manufacturing and testing, inspection is carried out to make satellites. Sensors, actuators, electromechanical, embedded systems are used. There are several types of sensors are required to be mounted on a spacecraft. To accommodate these sensors on Spacecraft, mounting structures are needed to support them appropriately. The present work focused on the configuration and design of such mounting support structure for a typical sensor.
Figure 1 Mars Orbiter Mission Spacecraft, [1] The configuration of mounting structure for sensors is based on various constraints like interface requirements, functional requirement of sensor, stiffness, strength and mass. The objective of the present work is to configure and design of an optimized mounting structure with given constraints of stiffness and strength. Various configurations of the support structure have to be studied using modeling and analysis software keeping in view the stiffness requirement with minimum mass.
II. METHODOLOGY
A. The Support structure is to be configured to meet the following conditions:
1. Stiffness 2. Stability and
3. Weight optimized component.
Experiment on Weight Efficient Support
Structure by using Dynamic Opinionto
Accommodate a Typical Sensor on Spacecraft
On Spacecraft
B. Criteria used:
In order to achieve the above criteria, certain steps have to be followed. The very first step is material selection. A suitable material has to be selected in order to meet the above criteria. In fact, material selection process it is the important one because stiffness and weight optimization depends on the mechanical and physical properties of the selected material After choosing a suitable material, the CAD modeling of mounting structure has to be carried out using the modeling software and it should be studied parametricallyi.e.by using different thickness for configuration The next step is to analyze CAD model using FEM with the help of software available for finite element analysis.
III. GUIDELINES IN SELECTING MATERIALS It is important to consider the context within which specific materials will be used. This chapter therefore begins with the criteria used to design the space structures.
Material Selection
In Space structures, material selection is based on high specific stiffness and specific strength. The design is said to be good if the mass is optimized for the given performance.
Specific strength Specific strength = σ/ρ
where, σ is strength, ρ is density.
The strength of the material is the resistance to failure by permanent deformation. Specific strength is strength to the density.
Objective is to minimize the mass of the given specimen i.e. to minimize mass.
[image:2.595.82.265.506.590.2]We know that m = ALρ where, m = mass of given specimen, A = cross-section area of specimen, L = length of the specimen, ρ = density, t = thickness of the specimen. Refer Fig.2
Figure 2 Strength of the material
A. Properties of materials used in spacecraft
The aerospace industry is one such industry where the precision is much higher compared to other manufacturing
industry, hence the material with high stiffness and strength are selected, and usually many properties are taken into account.
B. Dynamic Analysis
The time varying load with dynamic response to a structure is determined by dynamic analysis.
C. Composite Materials
The composite material are defined as two or more materials which are combined on a macroscopic scale to create a new material.
The advantage of composite materials is that they show significant characters, highly strength to wait ratio, which is most important property as our project is concerned.
D. Carbon Fiber Reinforced Plastic
It is an extremely strong and light fiber-reinforced polymer which contains carbon fibers. In CFRP the reinforcement is carbon fiber which provides the strength.
The properties of CFRP depend on the layouts of carbon-fiber and the proportion of the carbon fibers relative to the polymer.
E. Selected Composite Materials
UD M18/M55J/90GSM BD M18/43090/100GSM where, UD - Unidirectional BD - Bidirectional
M55J - High modulus carbon fiber 43090 - Ultra high modulus carbon fiber GSM-Fabric density i.e. gram per square meter
M18 is a high performance, self-BD M18/43090/100 GSM
(Table 1)
a) Elastic Properties of materials Material Elt(N/m2) Ett(N/m2) μlt Density*
BD43090* 14.7E+10 14.7E+10 0.03 1660 *(kg/m3) and Thickness = 0.080mm.
(Table 2)
b) Strength values of materials
Material Xt Xc Yt Nc(N/m2)
BD43090* 34.6E+7 20.5E+7 34.6E+7 20.5E+7 *Xt ,Xc , andYt having unit (N/m2)
IV. DESIGN SPECIFICATION
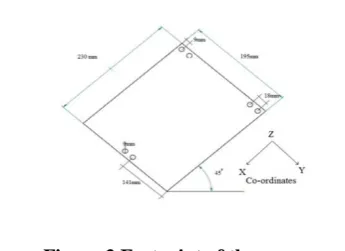
[image:2.595.337.510.562.687.2]Design specification and specification of support structure configured by using foot print of the sensor, which is a given value of requirement. Designed by using CATIA V5.
Figure 3 Footprint of the sensor
International Journal of Innovative Technology and Exploring Engineering (IJITEE) ISSN: 2278-3075, Volume-8, Issue-6S4, April 2019
Sensor Requirements (Table 3)
Sm CG* MI * CG
5.3 X=90.3 mm Mxx = 32576.3 kg – mm2
- Y=75.4 mm Myy = 39753.9 kg –mm2
- Z=66.85 mm Mzz = 56540.3 kg – mm2
Sensor Requirements
[image:3.595.55.270.110.582.2]A. Isometric view of Wedge and I Configuration using CATIA V5
Figure 4Catia V5 Wedge configuration
[image:3.595.337.516.196.308.2]Figure 5Catia V5 I Configuration
Figure 6The detailed view of I – configuration
Figure 7The detailed view of Wedge configuration Let us know the main requirement of the support structure,
1.Frequency – Requirement (100 Hz):While performing modal analysis, the frequency of support structure must be higher than the main structure, where it is going to be mounted. Suppose the main deck where we fix our support structure operating at certain Frequency say 70 Hz, then the support structure’s frequency must be greater than 70 Hz, the reason is to arrest the resonance effect and the frequency must be above 100 Hz is calculated by, If input frequency is
[image:3.595.360.491.539.582.2]X then the output frequency must be
2
times of X (1.4142 times 70 Hz is 98.99Hz)Figure 8 Transmissibility VS frequency where,
= Harmonic frequency of excitation force and =
Natural frequency of the system X = Steady state relative amplitude Y = Harmonic vibration amplitude of body
= Frequency ratio
2.Calculation of Interface width
Given data:Force at each interface should be 600 N for safer design. Modeled a configuration in CATIA and its mass was found to be 3.21 kg, by using this data and considering mass of the sensor as the point load acting on the support structure, interface force was calculated.
Figure 9 Cantilever Beam with point load and UDL
Cantilever Beam with point load and UDL
where where
Fa
= Force at A, Ma = Moment at AFa
= ma = (3.21+5.3) 30 9.81 Therefore, [image:3.595.75.261.600.719.2]On Spacecraft M
a
=Fa
0.169 = 2504.493 0.169 Therefore,M
a
= 423.259 N-mForce at interface
=
Fi = = 1693.036 N
Here the force at each interface is found to be greater than 600N.
Taking force at each interface = 600N as the given data we calculated the interface distance.
600 =
X = 0.07054 m therefore, X=70.54 mm,
Hence the distance between interfaces should be 70
mm.
V. DYNAMIC ANALYSIS
A) Dynamic analysis of I-Configuration with sensor mass
The dynamic analysis is performed with sensor mass. The sensor mass (i.e. 5.3 kg) is modeled as a lumped mass and connected to the support structure using rigid element. In subsequent sections, the various configurations with sensor mass has been studied and presented.
I-Configuration without flanges Case 1:
[image:4.595.301.554.55.95.2]Width, W=90mm, Thickness, T=5mm, Interface distance, Id =70mm, Mass=2.0769 kg
Figure 10 I-Configuration without flanges In the beginning I-Configuration analysis started with basic design with web and fixing end. Its achieved first mode of frequency is 17.334 Hz. With application of boundary conditions, the mass obtained is 2.0769 kg.
(Table 4)
Mode No 5 6 7 8
FREQ(Hz) 209.02 321.22 440.05 495.90
After adding sensor mass on one side of the web there is decrease in percentage of frequency. Frequency requirement is 100 Hz (which is not satisfactory with the obtained results.) Hence it was decided to carry out further modification i.e., addition of flanges (above and below) for the above configuration.And the similar I configuration is carried with different shapes and adding flanges and removing them along with varying interface points. Here interface points equivalent to the strength of the structure, which is joined to spacecraft. For Examples: Wedge shape, I -configuration, with Flanges, without flanges, finally the also we need to consider the frequency requirement of 100Hz. Keeping point of the results obtained, we found below configuration suitable for further studies.
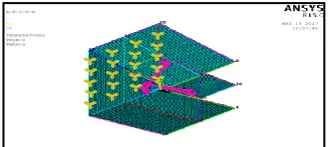
[image:4.595.311.543.281.540.2]Modal analysis for I configuration and Wedge configuration.
[image:4.595.62.227.554.663.2]Figure 11 I configuration
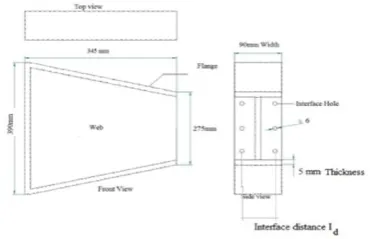
Figure 12 Wedge configurationWedge Configuration with flanges and mid flange along with 4 columns of
interface (W=320mm)
Case 2:
Width, W=320mm, Thickness, T=5mm, Interface distance, Id =100mm, Mass=7.25kg
Figure 13 Wedge Configuration with flanges and mid flange along with 4 columns of interface (W=320mm) 1 6 3 5 8 2 4 7 X Y Z 1 X Y Z 1 2 4 4 7 7 8 8 2 3 1 1 5 5 6 6 3 X Y Z 1 1 2 3 4 5 6 7 8 9 10 11 12 13 14 15 16 17 18 19 20 21 22 23 24 25 X Y Z 1 X Y Z
MAR 23 2017 12:24:40 A-E-L-K-N U ROT CE 1 3 6 4 9 7 12 10 3 12 10 8 5 2 11 35 36 34 X Y Z 1 X Y Z 1 3 12 12 10 10 1 1 3 3 6 6 4 4 1 10 9 9 7 7 12 2 11 11 8 8 5 5 2 35 36 36 33 33 34 34 35 X Y Z 1 1 2 3 4 5 6 7 8 9 10 11 12 13 14 15 16 17 18 19 20 21 22 23 24 25 26 27 28 29 30 31 32 33 34 35 36 3738 3940 4142 43 X Y Z 1 X Y Z MAY 15 2017
[image:4.595.345.512.637.710.2]International Journal of Innovative Technology and Exploring Engineering (IJITEE) ISSN: 2278-3075, Volume-8, Issue-6S4, April 2019
After applying modifications to the previous cases, through analysis the obtained first mode of frequency after applying boundary conditions and the sensor mass of 5.3 kg was 88.957 Hz. The mass obtained is 7.25 kg. Thus, the configuration with mid flange is more beneficial in increase of stiffness.
Here, the obtained first mode of frequency as 88.957Hz, as this configuration is attaining the greater frequency compared to all other configurations after applying sensor mass, hence this configuration is held on.
(Table 5)
Mode No 5 6 7 8
FREQ(Hz) 127.80 159.82 169.95 191.25
B) Reason for selection of wedge as final configuration
Since the highest frequency obtained in I-Configuration is 85 Hz for 7 kg and for wedge configuration is 89 Hz for 7.25 kg. Therefore, there is a need to select one final configuration for further analysis. Hence by taking frequency/mass value (normalizing), wedge configuration is being obtained greater value compared to I configuration. Hence wedge configuration having 4 columns of interface with 320mm width, uniform thickness 5mm, with interface distance 100 mm is selected.
Weight optimization based on parametric study
As the wedge configuration of 320 mm width with 4 columns of interface having interface distance 100mmand 5mm uniform thickness is showing highest frequency with comparable decrease in mass.
The weight optimization for this configuration has done by varying the thickness of flanges, web and fixing end.
a) The geometric optimization by varying the thickness of fixing end.
(Table 6)
Flange Thickness(mm) 3 3 3
Web Thickness (mm) 5 5 5
Fixing end thickness (mm) 5 4 6
Frequency (Hz) 82.3 72.34 92.75
Mass(kg) 5.69 5.35 6.05
Thus it is seen from the table that instead of using the uniform thickness of 5mm for the support structure, a support structure with variation in thickness can be used i.e. thickness of flanges is 3mm, thickness of web is 5mm and thickness of fixing end is 6mm which is helping in getting the higher frequency of 92.75Hz with a mass of 6.05kg. Also, it is observed that weight optimization has occurred with the increase of frequency. So, decrease in mass = 7.25 - 6.05 = 1.2kg.
C) Finite element analysis of finalized configuration made of CFRP composites
We observed that flange thickness = 3mm, web thickness = 5 mm, fixing end thickness = 6 mm resulting in the highest frequency (92.7 HZ), so this combination is considered for further analysis in composites.
Data given for Composite analysis Thickness of each layer = 0 .080mm Young’s modulus = 14.7e+10 N /m2
Poisson’s ratio = 0.03
Rigidity modulus, g = 4.0e+09 N/m2 Density = 1660 kg/m3
a) Wedge Configuration with flanges and mid flange along with 4 columns of interface (W=320mm)
Analysis is done by PATRAN and NASTRAN.
Width=320mm, Interface distance, Id =100mm, Uniform
Thickness =5mm
(Table 7)
Mode No 5 6 7 8
FREQ(Hz) 128.72 157.65 175.15 185.92
b) Wedge Configuration with flanges and mid flange along with 4 columns of interface (W=320mm)
Analysis is done by PATRAN and NASTRAN.
Width=320mm, Interface distance, Id =100mm, Uniform
[image:5.595.61.556.410.577.2]Thickness =5mm
Figure 14 Wedge Configuration with flanges and mid flange along with 4 columns of interface (W=320mm)
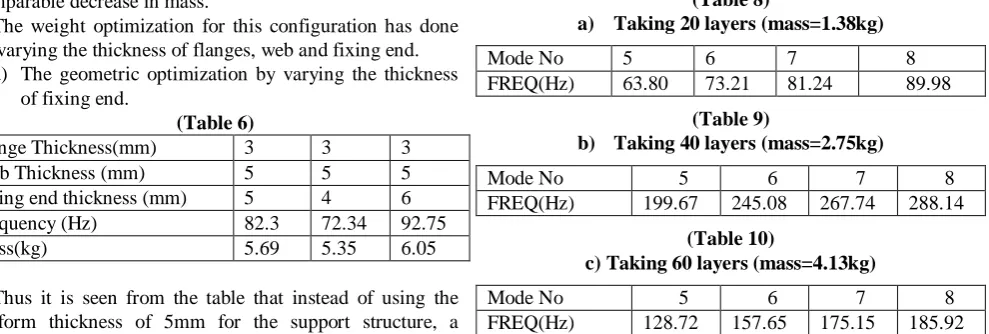
Composite analysis varying number of layers
(Table 8)
a) Taking 20 layers (mass=1.38kg)
Mode No 5 6 7 8
FREQ(Hz) 63.80 73.21 81.24 89.98
(Table 9)
b) Taking 40 layers (mass=2.75kg)
Mode No 5 6 7 8
FREQ(Hz) 199.67 245.08 267.74 288.14
(Table 10)
c) Taking 60 layers (mass=4.13kg)
Mode No 5 6 7 8
FREQ(Hz) 128.72 157.65 175.15 185.92
Here, it is observed that in the layer wise composite material analysis the frequency is increasing as the number of layers is increased. Therefore, for a uniform thickness of 5mm, 60 layers of composites is enough to attain the necessity frequency of 118.42 Hz with mass of 4.13 kg. Therefore, the mass reduction from aluminum to composite structure of uniform thickness (5mm) is 7.25-4.13=3.12 kg.
c) Wedge Configuration with flanges and mid flange along with 4 columns of interface (W=320mm) with different number of layers.
On Spacecraft Number of layers for flanges = 36 layers, Thickness =
2.88mm, Number of layers for web = 60 layers, Thickness = 4.8mm, Number of layers for fixing end, Thickness = 72 layers = 5.76mm
(Table 11)
Mode No 5 6 7 8
FREQ(Hz) 172.02 174.92 210.6 247.23
Wedge Configuration with flanges and mid flange along with 4columns of interface (W=320mm) with different number of layers Here, due to the variation in thickness the composite layers are added proportionately. for 5mm thickness 60 layers of composite is sufficient in attaining the required frequency of 100Hz. Likewise, for 3mm thickness 36 layers and for 6mm thickness 72 layers are added. Thus 125.36 Hz frequency with a mass of 3.441 kg is obtained as shown in table 49. Also, it is noticed that there is increase in frequency with the reduction of mass compared to section Therefore, reduction in mass = 6.05 - 3.441 = 2 kg.
VI. CONCLUSION
In the present work, configuration, design and analysis of support structure to accommodate a sensor have been carried out. The design of structure is based on the stiffness with minimum mass. Further, the parameters considered for the study of support structure are:
• Material selection for the support structure • Thickness of the support structure
• Interface width variation
Various configurations have been studied to achieve required frequency with minimum mass.
In this process to determine the natural frequency of the support structure, where in parametric study, we have achieved one set of parameters which satisfies stiffness requirement of the support structure.
Initially we chose two different configurations to work on namely I-Configuration and Wedge Configuration.
During the case study, initially we started by considering the thickness of the flanges uniformly taken as 5 mm, and we kept this as constant and varied the interface width from 25mm, 50mm, 75mm and 100mm.Then we kept the interface width as constant, and varied thickness as 5mm, 10mm, 15mm, and 20mm.
As the wedge configuration made of aluminum with 320 mm width and 5mm uniform thickness is showing highest frequency with comparable less in mass, further weight optimization has been carried out.outdone by varying the thickness. The final thickness of Flange thickness is 3mm, Web thickness is 5mm and Fixing end thickness is 6 mm is recognized as best, which shows significantly good frequency. i.e. 92Hz with 6.05 kg. Highest frequency 92.7 Hz is obtained.
The modal analysis of finalized wedge configuration made of CFRP composite material also carried out. To decide the number of layers to achieve the required frequency, the parametric study has been done. The achieved frequency for given number of layers is shown as:
• Taking 20 layers (mass=1.38kg) = 25.67 Hz • Taking 40 layers (mass=2.75kg) = 68.32 Hz • Taking 60layers (mass=4.13kg) = 118.42 Hz
It can be seen that the configuration with 60 layers having the highest frequency i.e., 118.42 Hz which is more than the required frequency. Further, for the mass optimization different number of layers for flange, web and fixing end has been studied. Based on layer optimization study the configuration with flange = 36 layers, web = 60 layers and fixing end = 72 layers has been finalized. This configuration having the maximum frequency (i.e., 125.36 Hz) with minimum mass (3.441 kg).
Composite materials give high strength to weight ratio, as this being the stiffness-based design our main criteria of selecting material is by its strength. The above analysis is being done for Metallic and Composites, we have got satisfactory result for laminated composite material bi-direction fibers condition.
REFERENCE
1.
https://www.isro.gov.in/Spacecraft/mars-orbiter-mission-spacecraft
2. Design of low mass dimensionally stable composite base
structure for a spacecraftK.K. Sairajana, , , P.S. Nairb Composites Part B: Engineering, 2011 - Elsevier
3. Design of composite laminates for optimum frequency
responseRenginKayikci, Fazil O. Sonmez Journal of sound and vibration, 2012 - Elsevier
4. Topological design of structures under dynamic periodic
loadsBaoshouLiua, XiaodongHuanga, b,ChangfuHuanga,
GuangyongSuna, XiaoleiYanc, GuangyaoLia Engineering Structures, 2017 - Elsevier.
5. Lightweight design of composite laminated structures with
frequency constraintQimao Liu,JuhaPaavola In:
COMPOSITE STRUCTURES, No. 25 December 2015, 2015, p. 1-1. Research output: Scientific - peer-review › Article
6. Mass Matrix Templates: General Description and 1D
ExamplesCarlos A. Felippa Email author QiongGuoK. C. Park Archives of Computational Methods in Engineering January 2015, Volume 22, Issue 1, pp 1–65
![Figure 1 Mars Orbiter Mission Spacecraft, [1]](https://thumb-us.123doks.com/thumbv2/123dok_us/8207091.262348/1.595.340.486.411.503/figure-mars-orbiter-mission-spacecraft.webp)