Bragg Grating Diffraction light at Different
Wavelength and Incident Light
Gurpreet Kaur, Vinay Bhatia, P. N. Hrisheekesha, R. S. Kaler
Abstract: The diffraction grating is an important device that makes use of the diffraction of light to produce spectra. Diffraction is also fundamental in other applications such as x-ray diffraction studies of crystals and holography. We proposed a design of Bragg grating waveguide to investigate the behavior of diffraction of light at different incident angle and wavelengths. Using finite difference time domain (FDTD) photonics simulation software the performance of proposed waveguide is observed in term of output power, electric field, diffraction efficiency (DE) and signal to noise ratio (SNR). It is found that the proposed waveguide provides better diffracted light with electric field distribution with 1.969 v/m, Diffraction efficiency 8%, and SNR (25.5 dB) at 1.55µm wavelength and 00 degrees of incident angle.
Index Terms: optical fiber, Medical application, Bragg Grating Waveguide
I. INTRODUCTION
Optical fiber has recently found extensive use in the telecommunication industry [1-3].Fiber optic technology is ideal for this application when compared to their electronic equivalent because fiber optic system allows low noise, high bandwidth, high data transmission with low loss. It is also relatively simple to design systems which are immune to electromagnetic interference [4-7]. Apart from the telecommunication application, for the last few years extensive researchand development has been done on optical based fiber sensor in many sensing applications. Optical sensors are an attractive approach for making a chemical measurement, (i.e. Pouvoir Hydrogene (pH) detection, gas monitoring, case study for spectroscopic etc.), physical measurement (i.e. strain, temperature, corrosion, humidity, etc.) and biomedical measurement (i.e. Blood flow, glucose content, etc.). Several techniques have been investigated to calculate the diffraction efficiency. Wang et al. [8] analyzed the interaction period on diffraction of the blazed transmission gratings with a modified extended scalar theory. The lights reflect from the neighboring structures can be refracted by the grating facets and form two extra fields on the bottom facet of blazed transmission gratings. The TE and TM polarization were used to check the effect of period interaction.
Revised Manuscript Received on July 02, 2019.
Gurpreet Kaur, Vinay Bhatia, P. N. Hrisheekesha, CGC, Landran, Mohali, Punjab, India.
R. S. Kaler, Thaper University, Punjab, India.
Ibarra et al. [9] analysed the behaviour of the diffraction efficiency as a function of the thickness of the relief holographic grating. It was recorded on a phase emulsion
composed of rosin and bromophenol blue dye. It has been observed that the emulsion thickness is directly proportional to the quantity of rosin.
Also, with material concentration 30:1 is achieved best diffraction efficiency 0.47% and thickness 10.48 µm. Yao et al. [10] proposed far-field pattern-based approach to making a perfect mosaic of two sub-aperture gratings. Twyman–Green interferometer is used to guarantee the planar parallelism of the two sub-aperture gratings and obtained the in-plane rotational error. Harimoto [11] calculated and simulated the far-field patterns produced by mosaic gratings and set up an alignment tolerance criterion, which provided the possibility to align gratings based on analyzing the far-field patterns. In literature, several approaches have been reported i.e. matrix transfer method, RAMAN spectroscopy, circular polarization spectroscopy and adaptive overlap add equalization to calculate the diffracted light and/or diffraction efficiency, but these approaches are complex and expensive. Moreover, the system performance has not been checked in the term of different wavelength, the angle of incident and signal to noise ratio at different regions of Bragg grating. In this work, we have extended the previous work by observing the effect of diffraction efficiency for Bragg grating at different wavelength and different angle of incident. The problem is quantitatively and qualitatively studied and the results have been presented using FDTD photonic simulation software.
II. SYSTEM SETUP
A diffraction grating is a collection of reflecting (or transmitting) elements separated by a distance comparable to the wavelength of light. It may be thought as a collection of diffracting elements, such as a pattern of transparent slits (or apertures) in an opaque screen, or a collection of reflecting grooves on a substrate. A reflection grating consists of a grating superimposed on a reflective surface, whereas a transmission grating consists of a grating superimposed on a transparent surface. An electromagnetic wave incident on a grating (upon diffraction) have its electric field amplitude (or phase or both) modified in a predictable manner. Diffraction efficiency (ƞ) is determined by the ratio of the diffracted light beam to the incident power of the beam
Using diffracted light, we can also find signal-to-noise ratio (SNR) value. The SNR is the ratio of signal power which is associated with diffracted light to noise power (unwanted light) [12-14].
Fig. 1 shows the proposed structure to determine diffraction efficiency. In this work, a standard grating type is used is known as uniform Bragg grating. The grating period 0.5µm is used and phase front is perpendicular to the length of the
waveguide. When
it diffracted into discrete directions.
Figure 1: Optical system setup for a diffraction grating. The effectiveness of gratings depends on the fact of its existing uniqueness in terms of discrete angles for a given spacing between grooves in which the light diffracted from each facet in phase with the light diffracted from any other facets, so it can combine constructively.
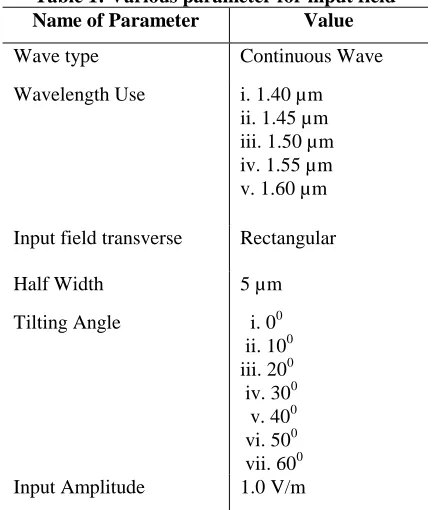
[image:2.595.306.555.90.244.2] [image:2.595.309.556.283.406.2]In propose waveguide, glass substrate is used with length 8.5µm, height 1.5 µm and width 3µm. Then the gratings are introduced on the surface of substrate with the length of each grating is 0.5 µm, height is 0.1 µm and width is 0.5 µm. Eight grating are superimposed on a glass substrate with the grating period Ʌ=0.5 µm. Table 1 shows the parameter of input field or optical source.
Table 1: Various parameter for input field
Name of Parameter Value
Wave type Continuous Wave
Wavelength Use i. 1.40 µm
ii. 1.45 µm iii. 1.50 µm iv. 1.55 µm v. 1.60 µm
Input field transverse Rectangular
Half Width 5 µm
Tilting Angle i. 00
ii. 100 iii. 200 iv. 300 v. 400 vi. 500 vii. 600
Input Amplitude 1.0 V/m
II. RESULTS AND DISCUSSION
In this setup the incident light is simulated at a different wavelength (1.40, 1.45, 1.50, 1.55, and 1.60µm) separately on the waveguide. The normalized power (0.2 to 3.1) is received against coordinate of z axis which is shown in Fig. 2.
specific type of material. For better clarification Fig. 3 shows the 3D view of a Bragg grating waveguide for z axis variation.
Figure 2: Normalized power at the different coordinate of z axis of the waveguide.
Figure 3: 3D view of a Bragg grating waveguide for z axis variation
From fig. 2 and 3 it is found that when the light of different wavelength is fall on the waveguide, 1.55 µm gives better performance for all the coordinate of z axis as compare to other wavelengths. So, in further investigations, we have used 1.55 µm as input wavelength. Further, the proposed system setup is investigated with different incident light angles (0, 10, 20, 30, 40, 50, and 60-degree angle) with respect to the different position of waveguide. Figure 3 shows the location of different distance which is represented with d1, d2, d3 and d4.
[image:2.595.61.277.397.652.2]Figure 4: Received output power as a function of the position of waveguide horizontally.
For further clarity, the electric field distribution over the waveguide has been observed for different incident angles. From Fig. 5 (a) to (c), it can be observed that, when light enters into substrate followed by proposed grating, an electric field is produced over the waveguide. From the patterns, we have achieved better electric field distribution with 0º incident angle. From the diffracted light it can be reported that, if the proposed design is used at zero degree incident angle then it provide more diffracted light in x-ray diffraction application. We have also analyzed the DE with the help of light diffraction in waveguide and an optical analyzer.
(a)
(b)
[image:3.595.309.564.54.183.2](c)
Figure 5: Wavelength transmission through proposed waveguide in XZ direction with 1.55µm wavelength at (a) 0º
incident angle (b) 30º incident angle (c) 60º incident angle.
[image:3.595.339.539.305.435.2]The results of DE with respect to different incident angles and wavelengths are shown in fig. 6. In support to our previous results, again proposed setup provides more variation in the term of DE (i.e. 8%) at 1.55 µm wavelength and 00of incident angle.
Figure 6: Diffraction efficiency as a function of wavelength at different incident light angle.
[image:3.595.334.568.538.647.2]The power plot is also drawn with respect to frequency to show the diffracted light power at the different position of the waveguide with the help of optical spectrum analyzer which is shown in fig. 7 and fig. 8. The best parameters (Wavelength: 1.55 µm and incident angle: 0 degrees) is taken to plot the power levels.
Figure 7: Power Observation Point Location on Waveguide.
Figure 8: Normalized power as a function of frequency.
Figure 9: Signal to noise ratio as function of frequency for waveguide length [µm]
The signal to noise ratio values are checked at best concluded parameters as shown in fig.9. We have achieved best signal to noise ratio at the position of waveguide horizontal 4.27 µm.
IV CONCLUSION
In this paper, Bragg gratings waveguide is proposed to investigate the behavior of diffraction efficiency at different wavelength and incident angle of light. SNR is also observed with the help of diffracted light and unwanted light. The electric field distribution over the proposed waveguide is improved with 1.55µm wavelength and 00 incident angle, respectively. It is also observed that the proposed waveguide provides better diffracted light with electric field distribution (1.969 v/m), output power (12 dB), DE (8%), SNR (25.5 dB) at 1.55µm wavelength and 00 incident angle, respectively. From the result, it can be conclude that the proposed design gave it best performance in x-ray diffraction.
REFERENCES
[1]. K. Venkatachalam, D. S. Kumar, and S. Robinson, “Investigation on 2D
International Journal for Light and Electron Optics, vol. 125, no. 21. pp. 6527–6529, 2014.
[3].Nidhi, U.Tiwari, V. Mishra, A. kumar, Y. Singh, B. kumar, S.C. Jain, N. Singh, and P. Kapur, “A current sensing technique based upon fiber Bragg grating”, Photonics - IIT Gawahati. vol. 39, no. 4. pp. 266, 2010.
[4]. N. Panwar, U. Tiwari, Nidhi, M. M. Khan, S. C. Jain, R. Garg and P. Kapur, “Long Period Fiber Grating Humidity Sensor with Gelatin/Cobalt Chloride coating”, is presented in International Conference on Fiber Optics and Photonics, pp-W2B.4,OSA 2012,IIT Chennai.
[5]. Christopher Palmerk, Diffraction Grating Handbook, 5th Edition, Richardson Grating Laboratory 705 St. Paul Street, Rochester, New York. 2015
[6]. M. Dai, L. Ma, Yelong Xu, M. Lu, X. Liu, and Y. Chen, “Highly efficient and perfectly vertical chip-to fiber dual-layer grating coupler”, Optik Express, vol. 23, no. 2, pp. 1691-8, 2015.
[7]. B. Yun, G. Hu, Y. Cui, “Third-order polymer waveguide Bragg grating array by using Conventional contact lithography”, Optics Communications, vol. 330, no.1, pp. 113–116, 2014.
[8]. H. J. Wang, D. F. Kuang, X. D. Sun, and Z. L. Fang, “Period interaction on diffraction efficiency of blazed transmission gratings”, Optik, vol. 121, no. 16, pp. 1511–1515, 2010.
[9]. J.C. Ibarra, M. O. -Gutie´rrez, A. Olivares-Pe´rez, G. ObregoPulido, M. Pe´rez-Corte, “Changes of the diffraction efficiency due to emulsions thicknesses in holographic gratings”, Optical Materials, vol. 30, no. 2, pp. 255–259, 2007.
[10].Yao Hu, L. Zeng, L. Li, “Method to mosaic gratings that relies on analysis of far-field intensity patterns in two wavelengths”, Optics Communications, vol. 269, no. 2, pp. 285–290, 2007.
[11].T. Harimoto, “Far-Field Pattern Analysis for an Array Grating Compressor” Jpn. J. Appl. Phys. vol. 43, no. 4A,pp.1362, 2004. [12].G. Kaur, R. S. Kaler, N. Kwatra, “On the optimization of fiber Bragg
grating optical sensor using genetic algorithm to monitor the strain of civil structure with high sensitivity”, Optical Engineering, vol. 55, no.8, pp. 087103-1 to 087103-6, 2016.
[13].G.Kaur, R. S. Kaler, N. Kwatra, “Performance investigation of semiconductor optical amplifier and raman amplifier as an optical sensors”, Optoelectronics and Advanced Materials – Rapid Communications, vol. 9, no. 9-10, pp. 1110 – 1113, 2015.
[14].G. Kaur, R. S. Kaler, N. Kwatra, “Investigations on highly sensitive fiber Bragg gratings with different grating shapes for far field applications”, Optik, vol. 131, pp. 483–489, 2017.
AUTHORS PROFILE
Gurpreet Kaur, obtained her bachelor’s degree in Electronics and Communication Engineering (ECE) from IET, Bhaddal, Ropar, India, and a Master’s degree in ECE from Punjabi University, Patiala, India. She has submitted her PH. D thesis in ECE department at Thapar Institute of Engineering and Technology, Patiala. Her field of interest is fiber nonlinearity, optical sensor and optical networks. She is currently working as Assistant Professor in the Department of ECE CGC Landran. She has published 18 research papers in SCI journals. She has Awarded Rajiv Gandhi National Fellowship of UGC in year 2014.
Dr. P.N. Hrisheekesha is a B. E, M. Tech, Ph. D from IIT Roorke. Currently he is working as
campus director at CGC landran. Has got more
than 50 publications in reputed international and
national journals and conferences. He has
completed so many funded projects. He is the editor of few reputed journals. He has Guided more than 50 PG and few Ph.Ds. He has few patents and books to his credit. He has established many incubation centers, Center of innovation , new labs too.His area of research and interest, renewable energy sources, power systems, distribution system automation, image processing, energy conservation, audit, printed electronics, AI, machine learning etc.

![Figure 9: Signal to noise ratio as function of frequency for waveguide length [µm] The signal to noise ratio values are checked at best concluded](https://thumb-us.123doks.com/thumbv2/123dok_us/8192541.258391/4.595.52.547.51.494/figure-signal-function-frequency-waveguide-length-checked-concluded.webp)
