Wavelet-analysis of network traffic time-series
for detection of attacks on digital production
infrastructure
aDarya Lavrova1, Pavel Semyanov1, Anna Shtyrkina1, and Peter Zegzhda1
1 Peter the Great Saint Petersburg Polytechnic University, Institute of Applied Mathematics and
Mechanics, 195251 Polytechnicheskaya st. 29, Russian Federation
Abstract. Digital production integrates with all the areas of human activity including critical industries, therefore the task of detecting network attacks has a key priority in protecting digital manufacture systems. This article offers an approach for analysis of digital production security based on evaluation of a posteriori probability for change point in time-series, which are based on the change point coefficient values of digital wavelet-transform in the network traffic time-series. These time-series make it possible to consider the network traffic from several points of view at the same time, which plays an important role in the task of detecting network attacks. The attack methods vary significantly; therefore, in order to detect them it is necessary to monitor different values of various traffic parameters. The proposed method has demonstrated its efficiency in detecting network service denial attacks (SlowLoris and HTTP DoS) being realized at the application level.
1 Complexity of security assurance in digital manufacture
systems
The modern level of science and equipment development is characterized by active transition from automated manufacture to digital manufacture practices. This transition goes along with transformation of existing process infrastructure, with combination of technologies and up-to-date developments bringing it into a global multi-level, multi- component system that is capable of changing the existing process practices and bringing all the industrial sectors to a new level of competitive ability.
Digital manufacture systems allow processing and systematization of data from all production process areas, organizational structures and business process data, a deep and comprehensive analysis of all these data makes it possible to take managerial decisions.
aWith financial support from the Ministry of education and science of the Russian Federation as part
of the Federal target program "Research and development of priority areas for Russia's research and process complex for 2014-2020" (Agreement No.14.578.21.0231, unique identifier of this agreement RFMEFI57817X0231)
The key role in digital production is given to such technologies as artificial intelligence, sensor and cloud technologies aimed at supporting effective operation of complex industrial systems. The complexity of these systems, a great number of various components incorporated in them makes the data analysis and knowledge extraction tasks rather difficult but still very important. Bearing in mind the large scale of these systems the task of mitigating the human factor effects on the operation of digital manufacture systems becomes relevant, because only machine intelligence is capable of processing large amounts of different data with high accuracy and extracting dependencies and properties that may go unnoticed for people.
Intellectualization and transition to artificial intelligence will significantly speed up both technological and business processes. However, functional transition from automated systems to automatic ones comes with a great number of complex tasks that need to be implemented before commissioning digital manufacture systems. The key problem is to provide security of digital manufacture systems.
Integrating these digital manufacture systems with such critical industries as power engineering, defense industry, health care, transport highlights the relevancy of this
problem. Incorrect operation of the systems in these industries may cause harm to people’s
lives and health as well as bring the state significant financial losses [1]. Resolving this problem is complicated by the following causes:
big difference in types of digital manufacture system components caused by both technical difference of components by intended use and a great number of component manufacturers;
low output capacity of most components;
Intensive generation of large and diverse data volumes by digital manufacture systems;
This high diversity of system components brings about a great number of generated data formats and different interfacing protocols to be applied and integrated. This imposes a requirement on these protection systems proposed to be developed to ensure that different data types can be processed.
Low output capacity of most components does not allow classic security systems such as attack and intrusion detection systems, information leakage detection systems etc, to be integrated with digital manufacture systems in an efficient manner. Therefore, the solutions proposed to provide security should consider this feature of application environment for digital production.
Intensive generation of huge data volumes requires from these security assurance systems to be capable of analyzing data on a real time basis. In combination with resource intensiveness requirements for these security solutions the task of developing digital production security systems becomes much more complicated.
Systems operating on standalone servers instead of running on the end nodes of digital manufacture systems could be a solution to this problem in accordance with sources [2-4]. These systems should be handling data from all the system components and be capable of processing them quickly and detecting data abnormalities with high accuracy signaling that the system may be running incorrectly due to a technical fault or a cyber attack on the system.
In this article the authors offer an approach to analyze digital manufacture system data for abnormalities based on assessment of digital wavelet-transform parameters of time-series. The use of these time-series especially for a traffic analysis is justified by the fact that the same network traffic volume can generate several time-series containing various traffic parameters. The following can be referred to these parameters: quantity of network packets for certain protocols, average quantity of network protocols per time unit representing a time series step, average packet size etc. Thus these time-series make it
possible to consider the network traffic from different sides at the same time, which plays an important role in detecting network attacks. Attacks of different type, even if they refer to the same class (for example, to service denial attack class) are carried out by intruders in a different way and to be detected it is necessary to monitor different characteristics.
2 Abnormality detection method based on wavelet-transform
One of the advantages of wavelet-transform is that it makes it possible to analyze a signal within the frequency-and-time region and allows researching the abnormal process on the background of other components. This article offers to implement digital wavelet-transform.
Its idea consists in the fact that any digital sequence is represented as a combination of decomposition coefficients as per basic scaling and functions [5]. Thus, wavelet-transform decomposes the analyzed sequence into two sequences of coefficients: approximation coefficients 𝑐𝑐𝑜𝑜𝑒𝑒𝑓𝑓𝑓𝑓𝐴𝐴, which are linked with a scaling function and detailing coefficients 𝑐𝑐𝑜𝑜𝑒𝑒𝑓𝑓𝑓𝑓𝐷𝐷, which are linked with wavelet-function. If the level of decomposition is higher than one, then at further steps, the approximation coefficients obtained at each level are subject to wavelet-transform. Thus the algorithm outcome at decomposition level 𝑗𝑗
is a set of coefficients, ሾ𝑐𝑐𝑜𝑜𝑒𝑒𝑓𝑓𝑓𝑓𝐴𝐴𝑗𝑗ǡ 𝑐𝑐𝑜𝑜𝑒𝑒𝑓𝑓𝑓𝑓𝐷𝐷𝑗𝑗ǡ 𝑐𝑐𝑜𝑜𝑒𝑒𝑓𝑓𝑓𝑓𝐷𝐷𝑗𝑗 −ͳǡ 𝑐𝑐𝑜𝑜𝑒𝑒𝑓𝑓𝑓𝑓𝐷𝐷𝑗𝑗 −ʹǡ … ǡ 𝑐𝑐𝑜𝑜𝑒𝑒𝑓𝑓𝑓𝑓𝐷𝐷ʹǡ 𝑐𝑐𝑜𝑜𝑒𝑒𝑓𝑓𝑓𝑓𝐷𝐷ͳሿ.
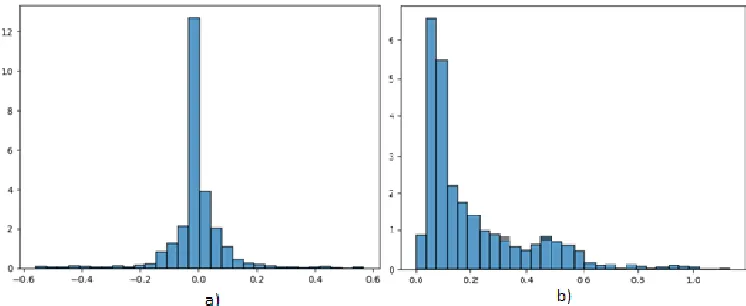
[image:3.482.62.435.356.509.2]The set of approximation and detailing coefficients has its statistical properties. The detailing coefficients characterize the local changes of analyzed sequence. Their distribution is described by Gaussian law with zero mean (Fig. 1a)). The distribution density of approximation coefficients, which provide information about global trend, are best of all described by distribution of exponential type [6], as it is shown in Fig. 1 b).
Fig. 1. Analysis of normal traffic time-series elaborated by average size of the HTTP-packets.
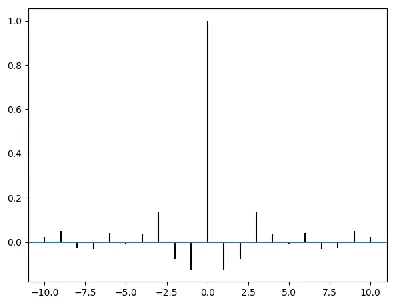
Fig. 2. Autocorrelation function of detailing coefficients.
The abnormality detection methods using digital wavelet-transform are mainly aimed at analyzing detailing and approximation coefficients. In particular, within a number of methods researchers apply approaches related to the change detection task, which is one of widely distributed tasks of data sequence analysis [7-10].
It is obvious that the statistical properties of time-series may vary in time. However, if there is an abrupt change in the properties of analyzed sequence than the assessment of time point of this jump can significantly help during time-series analysis. In this paper the change point accompanied by a rapid jump in distribution parameters can indicate that there is a network abnormality.
As discussed, the detailing coefficients are described by normal distribution with zero mean value. It means that it is necessary to detect change points caused by a rapid change in dispersion of detailing coefficients in order to detect abnormalities in local traffic trend. In a number of works it is offered to use ICSS criteria (iterative algorithm of cumulative sum of squares) [7, 8], SIC (Shwartz information criterion) [9], Fisher criterion making it possible to trace dispersion equality [5] and etc. This paper offers to use a Bayesian on-line change detection algorithm [10]. In original research this method is applied to analyze various data time-series. In this case, this article offers to apply the Bayesian algorithm to detailing coefficients obtained as a result of wavelet-transform of time-series. The analyzed data processing time is reduced due to a lesser sequence generated by detailing coefficients. Moreover, wavelet-coefficients make it possible to analyze data within various frequency regions which allows detecting abnormalities at several decomposition levels.
The algorithm is based on the idea that the analyzed time-series
x t1 1 , x t2 2, ... ,x tn nis broken down into disjoint intervals. The delimiters between
the intervals represent the points of appearance of the fault. With the algorithm running a posteriori probability is evaluated throughout the length of sequence, which starts with the last appearance of the change point. Let us symbolize the length of each of these sequences at time points tas rt Let an average value be symbolized as and dispersion as .
According to the Bayesian theorem the following equation is true:
𝑃𝑃 𝑟𝑟𝑡𝑡 𝑥𝑥 ൌ𝑃𝑃 𝑟𝑟𝑃𝑃 𝑥𝑥 𝑡𝑡ǡ𝑥𝑥 , (1)
The new monitored data collection process occurs after initialization step [10]. The following is calculated:
Forecasting probability (using Student's distribution) P r t | , ;
Quality of evidence P x ;
Growth probability P r t rr t 1,x;
Fault probability P r t 0,x.
The last two probabilities are calculated using Hazard functions. The following is calculated according to Bayes' formula P r x t| . Once the change point is identified the
main distribution parameters are initiated once again.
The proposed method’s operability has been checked during detection of attacks from
the traffic dump collected and posted by New Brunswick University.
3 Experimental tests to detect abnormalities in network traffic
by proposed method based on digital wavelet-transform
CIC IDS 2017 dataset contains backbone network dumps over five work days including both normal network traffic and traffic with attacks such as service denial. Traffic with SlowLoris and HTTP Flood application level attacks was used for these experimental tests.
A SlowLoris attack occurs when an intruder sends a huge amount of data to a victim with slow speed, which makes it possible to use the server resources much longer than required. It is done by opening links with a target web-server and sending a partial request. At regular intervals this intruder sends further HTTP headers but never completing the request. The servers under attack will be opening these connections and filling the connection pool will not allow the clients to connect to it.
While identifying time-series from the network traffic it is necessary to consider both the number of HTTP protocol packets over a particular period of time and an average size of HTTP-packets. The time-series received were decomposed using digital wavelet-transform. Detailing coefficients were analyzed using the Bayesian change point detection method. The following results were received during these experimental tests (Fig. 3-6).
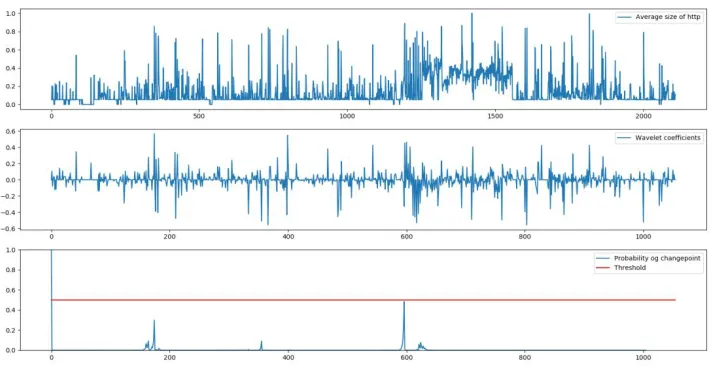
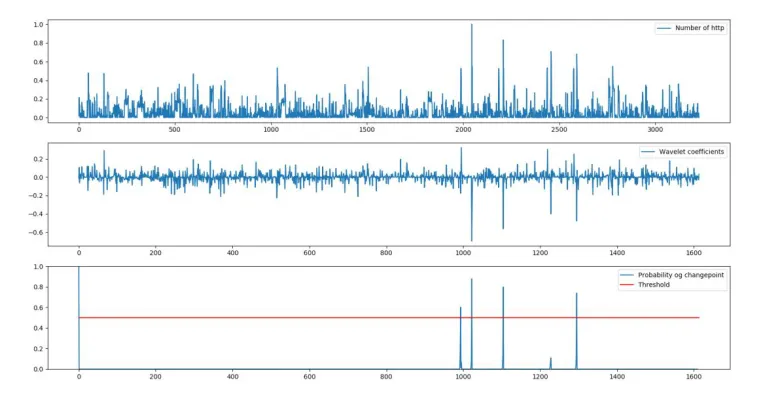
Three charts are shown in each figure:
Upper chart – time-series based on average HTTP-packet size parameter
Middle chart – detailing coefficient values received and based on digital wavelet-transform of time-series;
[image:5.482.65.421.454.641.2] Lower chart – change point probability chart calculated in accordance with the Bayesian algorithm.
Fig. 4. Analysis of abnormal traffic time-series with SlowLoris attack being carried out.
It is possible to see in Fig. 5 that the developed method detected a change point between the intervals 500 and 600: the posteriori probability assumed the value that is greater than the threshold one (threshold value is 0.5). The rapidest jumps within the distribution parameters most likely will be a change point and consequently will define a possible attack.
The second attack to be considered is HTTP Flood, which is initiated by sending HTTP-requests GET to the 80th port. It loads the server so much that it cannot process the other
requests. This flood attack can be aimed both at the server root and its script that is busy carrying out resource-intensive tasks. This attack can be identified by detecting a rapid increase in the number of requests to the same or several scripts on the servers and a rapid increase in the server logs.
The time-series plotted and based on the "number of HTTP packets" parameter were used to detect this attack. Fig. 5 shows the normal traffic time-series plotted by the number of packets and Fig. 6 shows the time-series chart for traffic under attack.
[image:6.482.57.425.429.624.2]Fig. 4. Analysis of abnormal traffic time-series with SlowLoris attack being carried out.
It is possible to see in Fig. 5 that the developed method detected a change point between the intervals 500 and 600: the posteriori probability assumed the value that is greater than the threshold one (threshold value is 0.5). The rapidest jumps within the distribution parameters most likely will be a change point and consequently will define a possible attack.
The second attack to be considered is HTTP Flood, which is initiated by sending HTTP-requests GET to the 80th port. It loads the server so much that it cannot process the other
requests. This flood attack can be aimed both at the server root and its script that is busy carrying out resource-intensive tasks. This attack can be identified by detecting a rapid increase in the number of requests to the same or several scripts on the servers and a rapid increase in the server logs.
The time-series plotted and based on the "number of HTTP packets" parameter were used to detect this attack. Fig. 5 shows the normal traffic time-series plotted by the number of packets and Fig. 6 shows the time-series chart for traffic under attack.
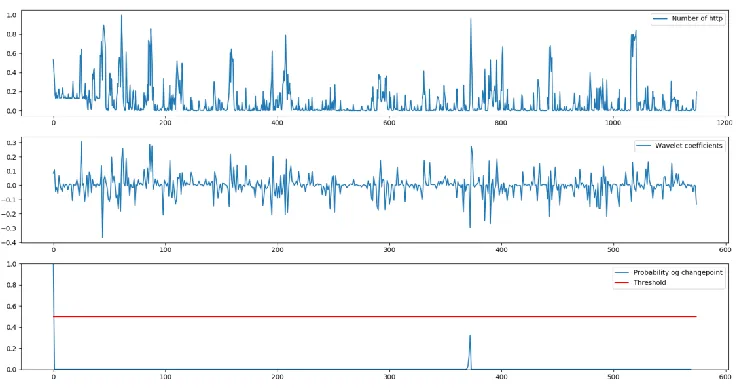
Fig. 5. Analysis of time series of normal traffic plotted as per the number of packets.
Fig. 6. Analysis of abnormal traffic time-series with SlowLoris attack being carried out.
In Fig. 5 there is a slight jump in data, however in accordance with the developed method implementation it is not a characteristic of abnormality. In Fig. 6 it is possible to see 4 intense jumps in data and all of them coincide with the attack time. In this case, it should be noted that the developed method does not initiate false responses. The noticeable jump after value 1200 on the middle chart looks like an abnormality, however, the lower chart showing the change point posteriori probability value demonstrates that the change point probability is very low: less than 0.2.
Thus, it has been experimentally proved that the developed method demonstrating the application of Bayesian algorithm to the network traffic time-series parameters transformed using wavelet-transform was efficient.
4 Conclusion
This article has offered a method of wavelet-analysis for network traffic time-series to detect attacks on the digital manufacture infrastructure. This method is based on evaluation of change point probability by the Bayesian method, however this method applies not to the data series containing the network traffic parameters but to the time-series of detailing coefficients received using the digital wavelet-transform of traffic series.
This approach is quite new, its comparison with the methods based on the analysis of time-series without wavelet-transform applied shows efficiency in terms of operation speed and possibility for a more deep traffic analysis. The analyzed data processing time is reduced due to a lesser sequence generated by detailing coefficients. Moreover, wavelet-coefficients make it possible to analyze data within various frequency regions which allows detecting abnormalities at several decomposition levels. High operating speed and consideration of various frequency regions have an important value during security analysis of digital manufacture network infrastructure, because a wide spectrum of managerial and industrial processes to be implemented should be considered at various time intervals. In addition, the high operating speed of this method increases the speed of detecting network attacked on the digital manufacture infrastructure.
at the application level, in particular, SlowLoris and HTTPDoS that were used to carry out experimental test of the developed method. Both attacks were successfully detected: The a posteriori probability value exceed the preset threshold equal to 0.5 when the abnormal traffic was observed.
References
1. Y. S. Vasiliev, P. D. Zegzhda, D. P. Zegzhda, Aut. Cont. and Comp. Scien., 63 (2016) 2. D. S. Lavrova, A. I. Pechenkin, IJCNIS, 7 (2015)
3. D. S. Lavrova, Aut. Cont. and Comp. Scien., 50 (2016)
4. D. P. Zegzhda, E. Yu. Pavlenko, Aut. Cont. and Comp. Scien., 51 (2017) 5. О. I. Sheluhin, A. A. Atayero, IJCSIS, 10(1) (2012)
6. O. I. Sheluhin, A. V. Pankrushin, SAI Conf. (2013)
7. C. Inclan, G. C. Tiao, Journ. of the Americ. Stat. Ass. (1994)
8. O. I. Shelukhin, Y. A. Ivanov, V. Y. Rogov, TComm-Telekom. i Transp. (2011) 9. O. Y. Rodionova, A. L. Pomerantsev, Progr. in Chem. Research (2005)