City, University of London Institutional Repository
Citation:
Hampton, J. A., Aina, B, Mathias Andersson, J, Mirza, HZ and Parmar, S (2012). The Rumsfeld Effect: The unknown unknown. Journal of Experimental Psychology: Learning Memory & Cognition, 38(2), pp. 340-355. doi: 10.1037/a0025376This is the accepted version of the paper.
This version of the publication may differ from the final published
version.
Permanent repository link:
http://openaccess.city.ac.uk/964/Link to published version:
http://dx.doi.org/10.1037/a0025376Copyright and reuse: City Research Online aims to make research
outputs of City, University of London available to a wider audience.
Copyright and Moral Rights remain with the author(s) and/or copyright
holders. URLs from City Research Online may be freely distributed and
linked to.
City Research Online: http://openaccess.city.ac.uk/ [email protected]
The Rumsfeld Effect: The unknown unknown.
James A. Hampton,
Bayo Aina,
J. Mathias Andersson,
Humaira Z. Mirza,
and
Sejal Parmar
City University, London
Address for correspondence:
James A. Hampton
Psychology Department
City University
Northampton Square
London EC1V OHB
Abstract
A set of studies tested whether people can use awareness of ignorance to provide
enhanced test consistency over time if they are allowed to place uncertain items into a
“don’t know” category. For factual knowledge this did occur, but for a range of other
forms of knowledge relating to conceptual knowledge and personal identity, no such
effect was seen. Known unknowns would appear to be largely restricted to factual kinds
Many statements in natural language may be termed vague. A vague statement is
one that is neither clearly true nor clearly false. Philosophical treatments of vagueness
(Keefe & Smith, 1997; Williamson, 1994) have largely focused on the logical problems
surrounding the Sorites Paradox. Named for the Greek word for “heap” the paradox
concerns whether removing just one grain of sand from a heap could ever make the
difference to the truth of the statement “this is a heap”. Of course, if the answer is no,
then the heap can be reduced one grain at a time until all the sand has gone, while in the
style of the smile on the face of Carroll’s Cheshire Cat the heap remains. But the answer
yes just seems counter-intuitive, especially considering that the grain size can be
reduced at will making each step infinitesimally small. Vagueness more broadly has
also been demonstrated in other domains, such as geographical location (Fisher et al.
2004).
Our interest in vagueness in the present paper first arose in the context of
categorization. In a seminal paper by McCloskey and Glucksberg (1978), they provided
evidence that people’s understanding of most of our common semantic categories, such
as Sports, Fruit or Vehicles is vague. McCloskey and Glucksberg gave participants lists
of possible category members (e.g. for fruit it could include apple, pineapple, coconut,
olive, pumpkin), and asked them to say Yes or No as to whether they were members of
the category. The participants returned some weeks later and repeated the task.
Vagueness in categorization was seen in two ways. First there were in each list
borderline items for which there was poor consensus. In fact the likelihood of people
saying Yes was smoothly distributed across the scale from zero to one (see Hampton,
1998). Second, where people disagreed about categorization they were also more likely
to be inconsistent in their responses across the two occasions. In other words, items such
as olive as a fruit were not at the borderline just because of different beliefs across
consistent belief of their own about the categorization.
The principal question that is posed here concerns whether people are reliably
aware of this uncertainty and potential inconsistency in their judgments of the truth of
statements. The experiments to be reported examined a number of different knowledge
domains, but we illustrate the issue first in respect of categorization.
A strong case can be made that there are certain statements which everyone would
agree are true or false, while there are other statements that everyone would
acknowledge are borderline or difficult to agree on. The latter we might term the
“known unknown” to use a phrase made familiar by Donald Rumsfeld, Secretary of
Defence of the USA from 2001 to 2006, under President George W. Bush (Seely, 2003).
For example everyone would agree that apples, oranges and bananas are fruit, and that
potatoes and cabbages are clearly not. Then again, perhaps everyone would agree that it
is difficult to classify tomatoes, olives, avocados and pumpkins as fruit. If this triage is
possible, then it should be the case that allowing people three response options in a
categorization task (Clearly True, Unclear, and Clearly False) should improve the
consistency of the responses at retest. A person who knows that the truth of a statement
is unclear can simply use the middle response on each occasion. On the other hand if
they are forced to choose between True and False, as in the traditional categorization
task, they will have to make a decision as best they can, and may therefore have a higher
likelihood of giving an inconsistent response at retest.
The comparison of consistency in responding between a 3-response (Clearly True,
Unclear, and Clearly False) and a 2-response (True, False) group thus provides a novel
test of metacognitive awareness of the vagueness or uncertainty in a decision. Before
briefly describing other work on similar problems of metacognition, let us consider an
alternative hypothesis about how people may respond when given 3 rather than 2
Verheyen, Hampton & Storms, 2010), people decide whether an item is in a category by
comparing it with a prototype representation of the category concept. Integrating across
different dimensions whose relevance and weight is determined by the concept and by
the context, an overall similarity is calculated and compared to a threshold criterion. If
the similarity surpasses the criterion a True response is triggered, and if not, a False is
given. Random variation in the process of computing similarities and variation in the
placement of the criterion naturally lead to the kind of probabilistic responding and
inconsistency seen in the McCloskey and Glucksberg data. They also explain the slower
decision times seen near to the category borderline (Hampton, 1979, 1995; McCloskey
& Glucksberg, 1979). To adapt the model to the 3-response version of the task, one can
simply propose that the participant adopts two threshold criteria, one higher threshold to
separate a Clearly True from an Unclear, and a second lower threshold to differentiate
an Unclear from a Clearly False. The Unclear response will therefore be most likely to
be given to items with intermediate levels of similarity to the category, falling between
the two threshold points. Note however that the variability in the computation of
similarity and the placement of criteria is not affected by this adaptation. So whatever
sources of variance led to probabilistic responses and inconsistency in the 2-response
case will still be present with equal force in the 3-response case. So the threshold model
predicts that providing 3 responses will have no effect on the level of inconsistency
observed in categorization. It will be just as hard to remain consistent when deciding
what is clearly a fruit as it is when deciding what is a fruit simpliciter.
Metacognitive awareness. The question of how aware people are of their degree
of knowledge has attracted a large amount of research in the field of metacognition. It is
known for example, that people are generally overconfident in estimating the number of
answers that they get correct on a quiz (Fischoff et al. 1977). In fact when they state
time. A large literature on calibration of judgments exists which relates people’s
subjective estimates of the probability of being correct to their actual accuracy
(Lichtenstein et al., 1982, Koehler et al., 2002). Another literature has grown up around
the concept of Feeling of Knowing (Klin, Guzman & Levine, 1997; Koriat, 1993). It has
been demonstrated that when recall of an item fails in a cued recall task, people can
reliably predict which targets they would be able to recognize in a subsequent
recognition test. This research has been extended to negative feelings of knowing—
knowing that you will not be able to remember something—in work by Liu, Su, Xu &
Chan (2007).
The possibility of awareness of ignorance (known unknowns) was demonstrated
in an early study by Glucksberg and McCloskey (1981). They showed that providing
people with relevant but uninformative facts slowed down a “don’t know” response.
They argued that there are two ways in which we may decide that we don’t know the
answer to a question. One is that we find no relevant information in memory as in their
example of “Does Margaret Thatcher use an electric tooth-brush?” In this case a rapid
and definite “don’t know” could be given in 1981. The other way to arrive at a “don’t
know” is when there is relevant information available, but it is insufficient to lead to a
confident judgment – as for example in asking whether Kiev is in the Ukraine. This type
of “don’t know” will be slow and deliberative, as people attempt to use the relevant
evidence within their existing knowledge base to arrive at an answer, and then decide
that they cannot decide.
Glucksberg and McCloskey proposed a two-stage model for verification of a fact.
First there is a search for relevant information, and then if such information is found,
there is an evaluative stage. A “don’t know” response can result from either stage. As
regards the analysis of category vagueness described above, the model would suggest
“Unclear” response result from the first quick stage.
The research described thus far is largely concerned with the relation of
confidence to accuracy. Apart for some indirectly related studies in opinion survey
methodology (e.g. Gilljam & Granberg, 1993) there has been little research on the
general consistency of question answering, regardless of whether the answer is correct
or not. The issue is of particular importance for the epistemological foundations of our
knowledge. If we are sure of a fact, then it is tempting to consider that knowledge to be
permanently represented in long term memory in a way that ensures that a stable
response is produced whenever the fact is questioned. Intuitively there is a strong
connection between feeling 100% confident in the truth (or falsity) of a statement and
being consistent in that belief over time, in the absence of any new information
(regardless of whether one is correct in one’s belief).
Overview of the research. The question that we address here concerns the
consistency with which people answer True/False statements. We consider not just
categorization statements but also general knowledge and other kinds of statement. The
procedure adopted for Experiments 1 – 3 is to compare consistency for a group who
simply answer Yes or No, with that for a group who are allowed 3 responses, Definitely
True, Uncertain and Definitely False. (Experiment 4 adopted a within-subjects version
of the procedure). The question is whether the latter group show increased consistency
relative to the former. Our research differs in two important respects from previous
research in this area. First, we do not restrict ourselves to statements for which there is
an objectively determined truth or falsity. Hence we are not primarily concerned with
calibration and accuracy. Second, in addition to objective facts we also consider a range
of other types of knowledge, such as the membership of conceptual categories, personal
moral beliefs and values, and personal aspirations and preferences, which cannot be
confidence is well calibrated across the scale, but in whether a sense of being 100%
certain about a statement is a stable state that perseveres across time, and equivalently
whether being uncertain about the truth of a statement is also a stable state of belief.
In setting the scene for the research to be reported, it is important to distinguish two
questions that the research addresses. Our primary concern, as stated above is to test
whether being 100% certain of a belief provides additional consistency over time. The
methodology of comparing consistency between the 2-response and 3-response groups
addresses this question. A second question is whether this effect differs in a qualitative
way across different domains of knowledge. As will be seen, there is evidence that the
consistency advantage shown for the 3-response group is only seen in general
knowledge domains. Given the difficulty in finding an appropriate and representative
sampling procedure for selecting statements from different domains, it may be harder to
prove that this interaction reflects a qualitative rather than a quantitative difference
among domains. We return to this issue in the final discussion.
Predictions. On the basis of the foregoing arguments it is possible to predict either
of two outcomes to the procedure of comparing consistency between a 2-response and a
3-response group. First, it can be argued that if a person is asked to say True or False of
a statement only if they are 100% certain of the answer, and otherwise to say “unsure”,
then this sense of certainty should guarantee that they give the same response on both
occasions. After all, how could one be definitely sure that something is the case, but
then be uncertain, or even sure that it is false just two weeks later? (Assuming the facts
have not changed and nothing has happened to lead a person to change their view in the
mean time.) If long term memory contains a set of stable known facts, and if people can
differentiate these from those about which they are not completely certain, then the
3-response condition should show better consistency. Equivalently, if a person can find no
alone should lead them to an Unsure response on both occasions, and so improve
consistency.
Alternatively an analogy can be drawn with a familiar kind of decision making,
that of a juror who must decide on a verdict. In a criminal case (in England and Wales),
the jury is instructed to bring in a guilty verdict only if the evidence proves guilt
“beyond a reasonable doubt”. In a civil law case, a jury has to decide between the two
parties on the balance of the argument. The former is akin to our 3-response category
condition. Jurors could be convinced of guilt, convinced of innocence or in a state of
doubt, and the law directs them to return “not guilty” in either of the latter two cases. (In
Scottish law, the middle response of “Unproven” is also allowed). The civil law case is
like our 2-response condition – either the plaintive has made their case or they have not.
Experience with jury decision making suggests that the decision is no easier to make in
the former case than the latter. Juries will find it just as hard to reach consensus on
whether a case is proven beyond reasonable doubt, as on whether the evidence favors
one side or the other on balance. In other words, this analogy implies that requiring
people to only say True when they are definitely sure simply moves the decision
criterion to a higher level, but does nothing about the problem of evaluating the truth of
the statement itself, and the degree of instability and uncertainty that may be involved in
assessing the likelihood of its truth.
For our initial exploration of this issue we created statements of three types,
representing three different kinds of knowledge in long term memory. First we took
statements representing semantic knowledge – membership in different semantic
categories like Fruit, Sport or Tool. As discussed above, the threshold model (Hampton,
2007) predicts that the 3-response condition should show no more consistency than the
2-response condition. Second we took statements representing objective factual
known unknowns in the case of more abstruse general knowledge statements, thus
leading to greater consistency in the 3-response group. Finally we generated a set of
items concerning people’s autobiographical details and memories. Here the prediction
was harder to make. Although it can be argued that autobiographies correspond to
objective historical facts, there is nonetheless an important difference from other
non-personal statements. That difference is that if a statement is about one’s self, it is more
than likely that one will attempt to retrieve relevant information and use that in an
evaluative decision process. In such a case, then autobiographical statements should
resemble categorization statements more than they do facts of general knowledge. (Note
that we should expect much less consensus in the case of personal statements, but the
issue of consistency is unaffected by the level of consensus).
Experiment 1
Method
Participants. Thirty-two students (25 female) at City University London
participated for course credit. There were 16 in each condition.
Materials. Booklets were constructed with 150 statements in a random order,
comprising 50 general knowledge statements, 50 category membership statements and
50 autobiographical memory statements. The items are listed in Appendix A. We aimed
broadly for each set of 50 statements to include approximately 15 that were clearly true,
15 that were clearly false, and 20 that might be uncertain. Items in the Appendix are
labelled Y for Yes if at least 90% of participants in the 2-response condition said True
(averaged across the two tests), and N for No if at least the same number said False.
Design and Procedure. Two versions of the booklets were constructed. One had
the 2 response options “True” and “False”, and the other had the 3 response options
“100% sure it’s true”, “Not 100% sure either way”, and “100% sure it’s false”. These
Since it was important that participants would only use the true and false responses
when they were certain about an answer, the instructions were as follows: “Please only
choose option 1 if you are 100% sure that the statement is true, and only choose option 3
if you are 100% sure that the statement is false. In all other cases, please use the middle
option. Don’t worry about using the middle option too much – we only want you to say
True or False if you are completely clear in your mind about the statement.” Two
random orders of statements were used, one for the first test and one for the retest which
took place one week later. On the final page of the booklet at retest, two additional
questions were added after the main set of statements: “Did you look up or discuss the
answers to any of the questions since last week?” and “Did you try to remember your
answers from last week in order to give the same answer?” These questions were
included in order to provide a check on how participants had responded to the retest.
While they had been unaware that the same questions would be asked again, it was
nevertheless possible that they had made an effort to be consistent by recalling their
earlier responses.1
Results
Consistency. There were just 10 missing responses from 32x150 = 4800 data
points. Table 1 shows the cross-tabulation of responses given on test and retest for each
of the types of material and for each condition. Cell frequencies are expressed as
percentages, such that the sum of all 4, or of all 9, cells is 100%. (N for each table was
between 797 and 800). Thus for example, 24.3% of responses to General knowledge
questions were “100% sure it’s TRUE” on the first test, of which 19.3% were given the
same answer at retest, corresponding to a consistency of 79% (19.3 out of 24.3).
Measures of consistency for each condition were calculated for the three different
types of statement separately. For the 2-response condition, consistency was calculated
the proportion of all first responses that were unchanged at retest. This value was 82%
for category statements, 82% for general knowledge statements, and 88% for
autobiographical statements.
Compared to the 2-response condition, consistency for the 3-response condition
was lower if calculated simply as the proportion of first responses that were unchanged.
However expected levels of consistency should be lower for 3 rather than 2 response
choices, since of 9 possibilities only 3 are consistent, compared with 2 out of 4 for the
2-response case. For a fair comparison, separate measures of consistency were calculated
for the likelihood of a 100% true remaining consistent and for the likelihood of a 100%
false remaining consistent. For the first, the frequencies of Unsure and 100% false
responses were collapsed, to yield a 2 x 2 table, from which the consistency of 100%
true responses was calculated as for the 2-response condition. Similarly, for the second
measure, 100% true and Unsure were collapsed to yield a 2x2 table for the calculation
of the consistency of 100% false responses. Mean consistency calculated in this way is
shown in Figure 1.
It can be seen in the Figure that there was no difference in consistency for 2- and
3-response groups for the category statements (M = .82 and .81 respectively). In
contrast, general knowledge statements showed an increased level of consistency when
Unsure responses were allowed (M = .82 for 2 responses and .90 for 3 responses). In the
case of autobiographical facts, where we had made no strong prediction, there was no
difference in consistency between 2-response and 3-response conditions (M = .88 and
.86 respectively). Analysis of variance was run across participants and across items with
factors of type of statement (3 levels) and response condition (2 vs 3 response options).
There was a marginally significant main effect of type of statement (Min F’(2, 182) =
2.86, p = .06) and a significant interaction of type of statement with response condition
(F<1). Break-down analysis of the interaction confirmed that there was a significant
effect of response condition only in the case of general knowledge (Min F’(1,56) = 3.98,
p =.05).
In terms of the two final questions, only 2 participants reported having discussed
or looked up answers, and their consistency was not notably different from the others in
their group. In addition 13 participants said that they had tried to recall their earlier
answers – 6 in the 2-response condition and 7 in the 3-response condition. A post hoc
analysis was therefore possible, breaking down each group into those who did and those
who did not try to recall their earlier responses. A 3-way ANOVA was run with the two
factors of response condition and type of statement as before, plus a third factor of
whether the participant reported trying to recall or not. Neither the main effect of trying
to recall, nor any interactions involving recall were significant, whereas the interaction
of response condition and statement type remained strong (F(2, 56) = 7.08, p = .002).
Discussion
Three types of knowledge were tested. For general knowledge statements, as
predicted, there was a notable increase in consistency – from 82% consistency for the
“True/False” condition to 90% consistency for the 3-response condition. Examination of
the frequencies in Table 1 showed that a major reason for this consistency was the much
greater frequency and consistency of “Not 100% sure either way” responses in this type
of statement. Whereas for category and autobiographical statements a first response of
not sure was only about 50% likely to be repeated at retest, for the general knowledge
statements the figure rose to 80%. In other words being unsure was a common and a
stable cognitive state for the general knowledge statements we used here. A
consequence of having a large stable group of “Not sure” responses was that the
likelihood of the definite yes and no responses was reduced, and hence their stability
In contrast, there was no evidence that people were more consistent in
categorization if allowed to differentiate cases about which they were definitely sure
from others where they were unsure. Power calculations for the category condition
estimated an 80% chance of detecting a difference between the two conditions of 3% or
greater.
The third kind of statement used was autobiographical. Here, interestingly, the
pattern of results matched those of category statements. The general level of consistency
was somewhat higher, which probably reflected the arbitrary sampling of statements of
each type. We aimed to match response frequencies across the three types of material,
and we did this fairly well for the 2 response condition (see top part of Table 1).
However when allowed three responses, the autobiographical statements proved to have
fewer Unsure and more 100% false than the category statements. It is perhaps possible
that there are fewer statements about one’s own life about whose truth one is not sure,
but no attempt was made to sample statements in any systematic way.
The results of Experiment 1 lead us to infer that there may be a qualitative
difference between the kind of knowledge retrieval involved in judging general facts
and that involved in category membership or autobiographical memory decisions. This
conclusion must be qualified with the acknowledgement that although a fairly large
sample of each type of statement was used, there was no obvious way in which to
sample them in a representative fashion. It is for this reason that all the statements are
listed in the Appendix. The alternative to a qualitative difference in domains would be a
quantitative difference across domains in the types of items and distribution of
responses. For example, as shown in Appendix A, all three domains had equivalent
numbers of Definitely True items (between 5 and 7), but General Knowledge had more
Definitely False items (11) than did Category Knowledge (6 items). On the other hand,
Category Knowledge. More generally, the opportunity for the 3-response advantage to
appear depends on there being a good sample of unclear items. In this respect, Category
Knowledge had a greater opportunity (40 items with no 90% consensus of being true or
false) than the other two domains, and yet still showed no advantage for the 3-response
condition.
In the following experiment, we ran a larger scale replication of the categorization
condition. Since the dissociation depends quite critically on the absence of an effect in
categorization, we aimed to use a more powerful design to confirm that there is indeed
no improvement in consistency with 3 responses when category membership is being
judged. We returned to the issue of personally related information and sought to
replicate the effect for General Knowledge in Experiments 3 and 4.
Experiment 2
Method
Participants. Seventy-one students (53 female) at a London college participated
voluntarily. Sixty-two returned for the second test, and data for the other 9 were not
used. In the final data there were 32 in the 2-response group and 30 in the 3-response
group.
Materials. Six semantic categories were used, with a list of 22 items for each
category. Items were taken from a set of category materials developed by Hampton,
Dubois & Yeh (2006), and are listed in Appendix B. Hampton et al. aimed to sample
from the full range of category membership from clear members to clear non-members.
Based on earlier data, about half the items were expected to lie in the borderline region
for categorization (probability of a “yes” response between .25 and .75). As in Appendix
A, (Y) indicates items with a consensus of >90% for a yes response in the 2-response
condition, and (N) the equivalent for a no response. Some 18% of items were in the first
membership required to be sensitive to the manipulation used.
Design and Procedure. Participants were allocated at random to either the 2- or
the 3-response group. The 2-response group worked through the booklet choosing either
“yes” or “no” to each category item. The 3-response group had the same booklet, but
instead of “yes” or “no” they chose one of three responses: “definitely yes”, “maybe”
and “definitely no”. Instructions for this group emphasized that a yes or no should only
be given if the participant was confident that it was definitely the right answer. If a
participant was unfamiliar with any item they were told to leave it blank. All
participants were retested after a period of two weeks. The order of items was
alphabetical within category for one half of the booklets in each condition and reverse
alphabetical for the other. Order of categories was constant. Order was kept the same for
each participant at test and retest. Participants wrote their names on coversheets each
week so that booklets could be matched up. Cover sheets were then detached to preserve
anonymity.
Results
Less than 2% of the data were missing owing to non-response to items. Item and
subject statistics were calculated based on the valid data only. Table 2 shows
percentages for the cross-tabulation of the responses given on the first and second
occasions, rounded to the nearest integer. For example for the 2-response group, 52% of
all responses at the first test were “yes”, and these broke down into 45% where the
second response was also “yes” and 7% where the second response was “no”. Thus 86%
(= 44.7/52.1) of initial yes responses were unchanged. Combining the consistent yes
(44.7%) and consistent no (38.5%) percentages gave a total consistency of 83.2% for the
2-response group.
As in Experiment 1, participants were more likely to change their responses in the
explained in Experiment 1, it is harder to be consistent in the allocation of 3 response
categories than just 2. To compare like with like, the data from the 3-response group
were analysed as in Experiment 1 to provide two separate estimates of consistency, one
for Definitely Yes versus other responses, and one for Definitely No versus other
responses. The two estimates were averaged together for an overall consistency
measure for the 3-response group.
When calculated in this way, the mean consistency for the 3-response group was
83.6%, compared with 83.2% for the 2-response group. Standard errors for the two
estimated means based on subject variance were 0.9% and 0.7%, giving 95% confidence
intervals of ± 2% and ± 1.5% respectively. Estimated power was 95% for detecting a
difference in the group population means of 2% or more, and 80% for a difference of
1% or more.
Consistency and response probability. A further analysis considered whether a
shift in consistency may have been masked by changes in the distribution of items
across the membership scale. Clearly if a given item has a 90% chance of a “yes”
response in the 2-response group then it is more likely to receive the same response at
retest than if it has a 50% chance of a “definitely yes” response in the 3-response group.
The closer an item is to the criterion cut-off, the more inconsistent a response can be
expected to be. In fact, assuming independence of the two responses, the expected
consistency of a response in a two-choice repeated response task is p2 + q2 where p and
q are the probabilities of the two responses (p + q = 1). This function reaches a
minimum of 0.5 when p = q = .5, and rises to a maximum of 1 as p or q approaches 1.
Adopting a high and low criterion could therefore generate shifts in consistency just by
changing the number of items in the sample that are close to the criterion. Thus if
response probability is treated as a covariate, it is possible that a difference in
To examine this possibility, a data set was prepared based on the three different
2x2 tables that were used for the consistency calculations above. For each of the 132
items response probability and consistency were calculated for: (1) the 2x2
cross-tabulation table for the 2-response group, (2) the 2x2 table for the 3-response group,
collapsing Unsure and Definitely No and (3) the 2x2 table for the 3-response group,
collapsing Definitely Yes and Unsure. Consistency was entered into the dataset for each
item, together with the response probability of the modal response (i.e. probability of a
yes where yes was the more common response, and probability of a no if no were more
frequently given). To illustrate, the item Chess as a Sport contributed three pairs of
values to the dataset. In the 2-response group it had a probability of a “No” (the modal
response) of .58 and a consistency of .83; with the high criterion applied to the
3-response group data the modal 3-response was [Definitely No or Unsure] which occurred
with a probability of .77 and had a consistency of .87; and with the low criterion applied
to the 3-response group data the modal response of [Definitely Yes or Unsure] had a
probability of .60 and a consistency of .77.
As expected, modal response probability MRP correlated significantly with
consistency (r(396) = .773, p < .001). Higher MRP necessarily yields higher
consistency. The question is then whether this may have been masking a difference in
consistency between the 2- and 3-response groups. Accordingly an ANCOVAR was run
on consistency with Response group as between-items factor, and MRP as a covariate.
The results showed a very significant effect of MRP (F(1,393) = 583.3, p < .001) but
still no effect at all of Response group (F = 0.1). The lack of any difference between
groups was not therefore an artefact of shifts in response probability between groups.
Discussion
Experiment 2 confirmed the results of Experiment 1. There was no improvement
which they were sure, and leaving the rest unclassified. With 132 items and 62
participants, the power of the experiment was sufficient to detect even a small
improvement in the consistency of judgment in the 3- versus the 2-response condition.
There was no evidence at all that allowing participants the option of saying “maybe”
rather than forcing them to choose between “yes” and “no” helped to reduce the
inconsistency of their categorization responses over time. The power was also sufficient
to test whether an effect was being masked by a shift in item modal response probability
between conditions (consistency being constrained as MRP approaches ceiling). There
was no evidence for this possibility.
The results supported the proposal (Hampton, 2007) that category membership
falls on a continuum. Decisions are subject to variation because of a range of factors that
lead to items being placed higher or lower on the continuum on different occasions. As a
consequence consistency is no greater if a higher standard of certainty is required than if
people just give a yes or no answer. They also support the conclusion that by and large
there are no known unknowns when it comes to categorizing familiar items in their
superordinate categories.
The third experiment aimed to extend the study to a further domain. Following the
results for autobiographical facts in Experiment 1, we adopted the working hypothesis
that the advantage for consistency of being able to say “unsure” is restricted to matters
of external objective fact, and that where questions of opinion or internal memory are
involved there is no stable category of known unknowns. To test this notion,
Experiment 3 again compared three domains of knowledge: general knowledge,
personal ethical beliefs and personal aspirations. We expected to replicate the greater
consistency for the 3-response group with general knowledge statements, and wished to
test whether the advantage would be found reliably when response probability was
more personal statements about beliefs and aspirations would show no difference
between the two groups. Finally, to test the generalizability of the results for General
Knowledge in Experiment 1, a new set of test statements were sampled.
Experiment 3
Method
Participants. Forty-four students (35 female) at City University, London
participated voluntarily. Some received course credits. They were randomly divided
between the two conditions.
Materials. The booklets were created with 90 statements, comprising 30 general
knowledge, 30 beliefs and 30 aspirations. The statements are listed in Appendix C.
Beliefs and aspirations were devised partly with the help of a focus group of 5 students
who were asked “what beliefs do you hold?” and “what are your aspirations in life?”
Others were taken from current affairs news sources. For beliefs the aim was to provide
a range of beliefs including some that most would hold, some that few would hold and
some that were controversial issues where different opinions would be found. For
aspirations there was again a mix of aspirations that most students would hold,
aspirations that few would hold, and others that some would hold and others not. A new
set of general knowledge statements were created with the aid of a quiz book. As in the
previous Experiments, items with strong consensus are labelled Y and N in the
Appendix. There were 4 such items for General Knowledge, 5 for Beliefs and 11 for
Aspirations.
Design and Procedure. The design was the same as in Experiment 1, except that
the 3 levels of the domain factor were general knowledge, beliefs and aspirations. The
same instructions and response labels were used, again emphasizing that the “100% sure
it’s True” and “100% sure it’s False” responses should only be used when the
Results
Consistency of responding was calculated in the same way as in Experiment 1, for
each of the 3 domains, and for each of the two groups. The data are summarized in
Table 3 and mean consistency by condition is graphed in Figure 2. ANOVA was run on
the consistency data, calculated as before, across subjects and items, with Type of
Statement and Response group as factors. There were no significant main effects, but
there was a significant interaction of Type of Statement with Response group (Min
F’(2,166) = 7.98, p < .001). Breakdown analysis confirmed that the 3-response group
was more stable than the 2-response group, only in the case of General Knowledge (Min
F’(1, 71) = 9.75, P < .005) and not for the other two types of statement, where the
2-response group was slightly (although not significantly) more stable.
As in Experiment 2, an analysis was run to test whether the results were affected
by a change in the distribution of items across the probability of categorization. As
before, an ANCOVAR was run with modal response probability MRP as a covariate.
The interaction of Domain by Response group was still significant (F(2,263) = 4.58, p<
.05) when MRP was held constant as a covariate.
Discussion
Using a new sample of statements, Experiment 3 replicated the pattern of data found for
general knowledge statements in Experiment 1. Furthermore it was possible to confirm
that the pattern was not just owing to a redistribution of items in terms of probability of
a True response in the 3-response group. In contrast, neither personal aspirations nor
beliefs showed any greater consistency when the third response option was included. In
keeping with our hypothesis, the personal nature of this type of information was such
that our participants were unlikely to think “that is a belief or aspiration that I know
nothing about”. As a consequence, the percentages of “unsure” responses that were
knowledge questions.
Experiment 4
The final experiment to be reported extended the domains of knowledge tested to
hedonic statements. Likes and dislikes are clearly a paradigm example of subjective
personal facts. They are also clearly graded in as much as one can like or dislike things
to different degrees. As such we expected that they would pattern like the other
subjective statements used in Experiment 3, namely beliefs and aspirations. To test the
generality of the findings we also introduced a change in the methodology. Rather than
use two groups of participants, we combined the 2-response and 3-response conditions
into a single task. Participants were offered four response choices. In this way three
threshold criteria were incorporated into a single scale running from “100% sure it’s
true”, and “Probably true but not 100% sure”, through “Probably false, but not 100%
sure”, to “100% sure it’s false”. In this way the data could be collapsed into two
response bins to test consistency in three different ways. Using a high threshold
involved measuring the consistency of a “100% sure it’s true” versus any other
response. The middle threshold measured the consistency of a true versus a false
response, regardless of certainty; and the low threshold measured consistency for a
“100% sure it’s false” as opposed to any other response. In addition to changing the
design and response scale, a different mode of analysis was also used. The tetrachoric
correlation coefficient (Drasgow, 1988; Ferguson, 1966) measures the degree of
association in a 2x2 table. It is specifically suited to the situation in which each binary
variable is the result of dichotomizing an underlying normally distributed variable. Each
of these response variables is assumed to be correlated to the same degree with a single
underlying latent variable, which is the “true” value of the item on the scale. The square
of this underlying correlation is the tetrachoric correlation.
degrees of freedom in the table, namely the dichotomization threshold of each response,
and the degree of correlation between the two responses. It is the latter that we take as
our measure of consistency. If there is greater consistency in deciding that something is
100% certainly true or false, than in deciding that it is simply true or false, then the two
2x2 matrices corresponding to a high and a low threshold will show higher values of the
tetrachoric correlation than the 2x2 matrix that corresponds to the middle threshold.
Method.
Participants. Participants were 40 students at City University London, the
majority of whom were female. Some additional participants who did not return for the
second session were dropped from the study.
Materials. Thirty statements were created for each of three domains:
Categorization, General Knowledge and Hedonic Likes/Dislikes. Three statements had
to be dropped because of a printing error, so there were respectively 30, 28 and 29
statements in the three domains for the analysis. Category and Knowledge items were
randomly sampled from those used in Experiment 1, with the addition of a new category
“type of music”. The Hedonic statements are listed in Appendix D. They were all
phrased as “I like ….”, and were generated with the help of a small group of students to
reflect a range of tastes and aversions. Four of the Hedonic statements reached a
positive consensus of 90% (students still like cookies and milk-shakes), and none
reached a negative consensus at this level (see Appendix D).
Design and Procedure. The same procedure was used as in Experiment 3, with
participants working through a booklet, and then returning after a period of
approximately a week to do the task again. The response scale was however changed to
incorporate four responses as described above. As a result the experiment was a single
group design, with three domains of knowledge as a within-subjects factor, and the three
within-subjects factor.
Results.
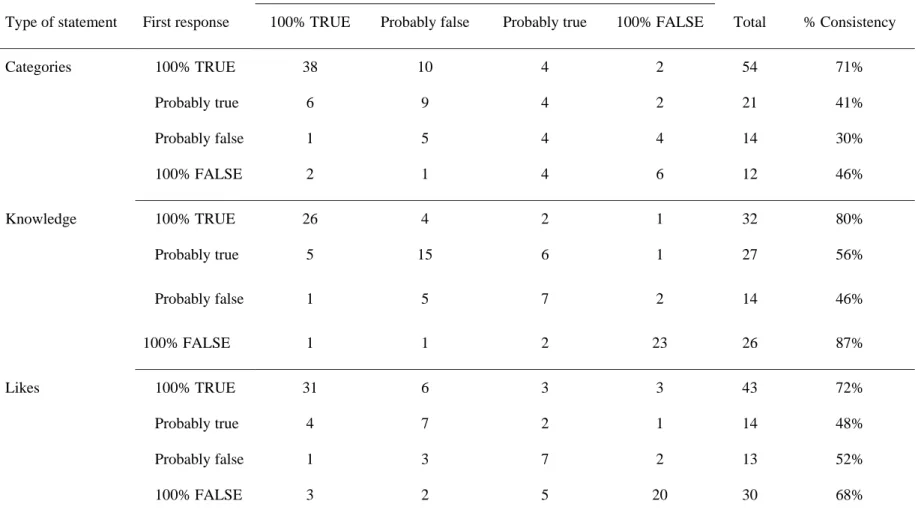
Response frequencies are summarized in a 4x4 cross-tabulation for each domain
in Table 4. The data for each domain for each participant were collapsed into three 2x2
tables by setting a cut-off criterion at three different points on the response scale and
collapsing all responses either side of the criterion. This procedure is illustrated in
Figure 3. The resulting 9 data matrices (one for each threshold applied to each domain)
were used to calculate 9 tetrachoric correlations for each participant. To avoid zero cell
frequencies, 1 response was added to each of the four cells before the analysis. The
analysis was performed on a Dell PC using TETCORR (Fleming, 2005) under Windows
XP. Results are shown in Figure 4. The mean correlation reflects the degree of
consistency in maintaining responses either side of each threshold criterion. It is clear
that in the case of General Knowledge, but not in the other two domains, there was a
lower consistency for the middle threshold (the simple True/False judgment) than for
either of the other two. This conclusion was confirmed with an ANOVA with two
repeated measures factors of Domain (Categories, Knowledge and Likes), and
Threshold (High, Middle and Low). There was a significant main effect of Domain
(F(2,78) = 17.3, p < .001, MSe = .08) and no effect of Threshold. However the
interaction was significant (F(2,78) = 5.6, p < .001, MSe = .016). Breakdown analysis
showed that there was an effect of Threshold for the General Knowledge statements
(F(2,78) = 15.206, p < .001), but not for either of the other domains (F(2,78) = 2.0 for
Categories and 0.6 for Likes). A further breakdown of the main effect of Threshold for
the Knowledge statements showed that the consistency measure for the Middle
threshold (M = .77) was significantly below both the High threshold (M=.83, p < .05)
and the Low threshold (M = .88, p < .001).
Experiment 4 confirmed the pattern of results in earlier Experiments, that
Categorization shows no difference in consistency between a True/False judgment and a
Definitely True/ Not Definitely True or a Definitely False/ Not Definitely False
judgment, whereas for General Knowledge statements there is such a difference. Our
hypothesis that the lack of difference is primarily to be found in subjective domains was
supported by the significant interaction showing that Hedonic likes and dislikes showed
the same pattern as categorization, in contrast to the General Knowledge statements. A
particular advance in Experiment 4 was the introduction of two innovations. First we
used a single group of participants and combined the previous 3-response versus
2-response contrast into a single 4-2-response scale. Second we adopted a new method of
statistical analysis using the tetrachoric correlation which is particularly suited to the
analysis of this type of data. The confirmation of the earlier results with this different
methodology confirmed the robustness of the results.
General Discussion
The central question of concern in this paper is the degree to which people are
aware of the unreliability of their judgments. Are we sufficiently aware of the
uncertainty in particular answers to the extent that we can reliably differentiate unclear
cases from clear cases? The results of our experiments suggest that for many domains
the answer is no. For categorization, autobiographical memories, beliefs, aspirations,
and likes or dislikes, when participants differentiated the cases about which they were
100% sure from the rest, they were no more likely to give a consistent response at retest
than if they were just forced to say “true” or “false” to each item regardless. Prima facie
this result is counter-intuitive. It implies that when a person declares that they are
“definitely 100% sure” that something is true, it is just as possible that they will change
their mind in a week’s time as if they had simply said that on balance it was more likely
knowledge in turn.
For categorization decisions, the results across experiments provide clear support
for the threshold model of category decisions (Hampton, 2007; Verheyen et al, 2010). In
none of the experiments was there any indication that, as measured by consistency,
second order vagueness (the point at which a statement ceases to be vague) is any less
vague than first order vagueness (the point at which a statement ceases to be false). This
result has important implications for the philosophical debate concerning the best way to
treat vague statements. For example Kamp and Partee’s (1995) treatment of vagueness
using Fine’s Supervaluations (Fine, 1975) requires that the borders of the region of
vagueness are themselves less vague. (There is a risk of an infinite regress in which
there is a region where the truth of a statement is vague, then there is vagueness about
where that region itself begins, then vagueness about where the vagueness of the region
begins, and so forth.) The result also suggests that explanations of fuzziness in
categorization that rely on epistemological uncertainty (Bonini et al., 1999), or on
contextual ambiguity (Braisby, 1993) would additional have to explain why people
apparently show no awareness of their lack of knowledge or of the ambiguity of the
task.
Of more direct psychological import, the results for categorization were
contrasted with the way in which people responded to general knowledge statements.
The intuition that there may be questions to which one confidently does not know the
answer, and that this state of ignorance will remain stable across time was borne out by
the results of Experiments 1, 3 and 4. For general knowledge statements there were
clearly a number of items that were known unknowns, and hence a stable “unsure”
response was given. The contrast between the two domains was also seen in the
likelihood of the most extreme form of inconsistency, where a 100% Definitely True
4, this pattern was seen in 7%, 6% and 4% of cases for the categorization domain across
experiments, but in only 3%, 1% and 2% of cases in the general knowledge domain.
Barsalou (1987) reported similar levels of shift in judgments of typicality within
categories, with items that were most typical in week 1 sometimes being judged least
typical a week or two later. It is probable that these two phenomena reflect the same
cognitive process.
Could the observed difference between categorization and general knowledge in
some way reflect a quantitative difference in the selection of items for testing, rather
than some qualitative difference in the nature of the information and its processing?
While impossible to rule such a difference out, we would argue strongly for a qualitative
difference. First, a wide range of categories and items were sampled from the usual
range of category norms, so the items were representative of conceptual categories
(albeit with a preponderance of borderline cases). Second we tested two different sets of
general knowledge statements, and the reader can confirm that there was nothing
unusual in these items, some of which were easy and some hard (just as for
categorization). Third, the use of different statistical measures, including an analysis of
covariance in Experiments 2 and 3, ruled out the possibility of the observed interaction
being owing to differences in the distribution of probability of “yes” or “definitely yes”
responses across the item lists.
Having made this strong claim for categorization, we can be less confident as
concerns the other “personal” information used in Experiments 1, 3 and 4. For these
domains the sampling was less easy to control, and each domain was tested only once.
Each domain (e.g. beliefs, aspirations etc.) was sampled in a relatively informal way,
with the help of some pilot work. Failure to find a consistency advantage in the
3-response condition is therefore less secure as evidence about a fundamental difference in
the group difference was significantly less than that for general knowledge, particularly
bearing in mind that the significant Min F’ statistic suggests that the effect is
generalizable both to new participants and to new items.
Thus autobiographical statements of the kind used in Experiment 1 also showed
very few known unknowns. This failure to find stable unknown items may relate to a
phenomenon noted by Gentner and Collins (1981). They showed that we can reliably
use the fact that we have no memory of an event to infer that the event did not occur. If
asked “Did you ever shake hands with Richard Nixon”, people can confidently know
that they did not, simply because they have no recollection of the event, and if it had
occurred then it is highly probable that they would remember it. Failure to find traces in
autobiographical memory will be taken as evidence that a statement is false, whereas
failure to find information about a general knowledge statement does not give any
reason to believe that it is false. The implication is that for general knowledge as the
level of retrieved relevant information decreases, responses tend to a stable “not sure”
response, whereas for autobiographical memories, as the level of relevant information
decreases, responses tend to a stable “false” response. The less a person can recall about
ever being on a bus when it broke down, the more they will tend to believe that it
definitely did not happen. Unlike general knowledge, lack of information about personal
experiences will not lead to a known unknown.
As a consequence of the result with autobiographical statements, the hypothesis
was formed that maybe the Rumsfeld Effect (the absence of known unknowns) occurs
primarily in domains that involve personal information – a person’s individual
memories, beliefs, aspirations and likes or dislikes. Experiments 3 and 4 confirmed this
hypothesis (subject to the caveats already mentioned). Once again, knowledge
statements showed improved consistency when an “unsure” response was allowed, but
and dislikes (Experiment 4) did not.
Are there other domains than General Knowledge where known unknowns can be
demonstrated? Other unpublished studies by the first author with Elizabeth Thwaites
and with Priya Gorasia have found domains where consistency does improve with
provision of an Unsure option. In the first study with Thwaites, participants judged
whether unfamiliar words had particular meanings or not. Consistency across occasions
was greater for the group who were allowed to say “Unsure”, even for words that they
claimed to have seen before, but of whose meanings they were unsure. In the second
study with Gorasia, memory for a short video was tested on two occasions with a
True/False recognition test. Again, the 3-response group showed better consistency than
the 2-response group when it came to judging the truth or falsity of statements about the
witnessed event. Both of these domains involve externally verifiable facts (word
meanings and actual events), and so provide further confirmation of our hypothesis that
the Rumsfeld Effect reflects a crucial distinction between more subjective and more
objective domains of knowledge.
A model of fact verification
Our explanation of our results owes a debt to Glucksberg and McCloskey’s
(1981) analysis of the stages involved in verifying a fact. They proposed that first there
is a search of memory for relevant information. If this search fails to find anything, then
a quick “don’t know” or “uncertain” response can be made. Alternatively if relevant
information is retrieved, a slower “don’t know” may still result, if the information
proves insufficient to answer the question. The present results for knowledge statements
are consistent with this general model, and additionally suggest that a “don’t know”
arising in the first stage from the lack of relevant information is a more stable response
than one arising from the second stage. When memory contains no relevant information,
following week there is still no information in memory, and so they come up with the
same answer. Those unfortunate enough to be in the 2-response group have to use some
other means of guessing the answer, and so risk changing their mind the following
week.
To explain the results for categorization and for personal information, it is
suggested that in these domains memory will almost always contain relevant
information. A statement about your past experiences or future ambitions may be more
or less meaningful to you, but you will always have some relevant basis in memory on
which to base your answer. In this case it is a question of trying to retrieve evidence and
argument in favour of the statement being true or not. Would you like to meet the Queen
(of England)? You think of the pros and cons and weigh them up in your mind. The
consequence of this slower process is that you accumulate a degree of confidence in the
answer being true, and then compare this to some threshold criterion. In the case of a
“definitely true” answer, the criterion is higher than just for a “true” answer. But in both
groups, the participant is doing the same thing – accumulating reasons for the statement
being true or false, and then deciding if the threshold is passed. They do not decide that
there are no reasons either way, so that no decision can sensibly be made.
If this account is correct, then we would predict that there may be some cases of
category membership and some autobiographical memories and other personal
information that would show greater consistency in the 3-response condition. If a
category item was so unfamiliar as to be unknown to the participant – for example it
might be whether euglena is an animal (Hampton, 1998) – then it could end up being
given a stable “unsure” response. Similarly if asked to evaluate a memory such as “On
11 November 2004 I wore a blue shirt”, (and assuming that the person did regularly
wear blue shirts at the time) then again a consistent “unsure” response could be
practice (e.g. the ethics of Finland’s whaling policy) would likely also engender stable
unsure responses, as would aspirations for unknown goals (I would like to take a
vacation in Carvoeiro). In such cases, the initial attempt to retrieve relevant information
would fail to find any reason for giving either a True or a False response. The pros and
cons would never be evaluated against a criterion, and so the response of “unsure”
would be more stable.
The Rumsfeld Effect is the finding that there are “unknown unknowns – the ones
we don't know we don't know”. We claim that when a decision is made by accumulating
evidence and comparing it to a criterion then responses of “sure” and “unsure” are like
unknown unknowns. We cannot access a stable state of uncertainty in a reliable fashion.
It is known that people are overconfident, judging that they are 100% certain about
things, 10% of which they have got wrong (Fischhoff et al., 1977). The contribution of
the present research is to show that for personal domains of knowledge the belief that
one is 100% confident that something is definitely true is a surprisingly unstable mental
References
Barsalou, L. W. (1987). The instability of graded structure: implications for the nature
of concepts. In U.Neisser (Ed.), Concepts and conceptual development:
Ecological and intellectual factors in categorization (pp. 101-140). Cambridge:
Cambridge University Press.
Bonini, N., Osherson, D. N., Viale, R., & Williamson, T. (1999). On the psychology of
vague predicates. Mind and Language, 14, 377-393.
Braisby, N. R. (1993). Stable concepts and context-sensitive classification. Irish Journal
of Psychology, 14, 426-441.
Drasgow F. (1988) Polychoric and polyserial correlations. In Kotz L, Johnson NL
(Eds.), Encyclopedia of statistical sciences. Vol. 7, pp. 69-74. New York: Wiley.
Ferguson, G. A. (1966). Statistical analysis in psychology and education. New York:
McGraw-Hill.
Fine, K. (1975). Vagueness, truth and logic. Synthese, 30, 265-300.
Fisher, P., Wood, J., & Cheng, T. (2004). Where is Helvellyan? Fuzziness of multiscale
landscape morphometry. Transactions of the Institute of British Geographers, 29,
106-128.
Fischoff, B., Slovic, P., & Lichtenstein, S. (1977). Knowing with certainty: The
appropriateness of extreme confidence. Journal of Experimental Psychology:
Human Perception and Performance, 3, 552-564.
Fleming, J. S. (2005). TETCORR: A program to compute smoothed tetrachoric
correlation matrices. Behavior Research Methods, 37, 59-64.
Gentner, D. & Collins, A. C. (1981). Studies of inference from lack of knowledge.
Memory & Cognition, 9, 434-443.
Gilljam, M. & Granberg, D. (1993). Should we take don't know for an answer? The
Glucksberg, S. & McCloskey, M. (1981). Decisions about ignorance: Knowing that you
don't know. Journal of Experimental Psychology: Human Learning and Memory,
7, 311-325.
Hampton, J. A. (1979). Polymorphous Concepts in Semantic Memory. Journal of
Verbal Learning and Verbal Behavior, 18, 441-461.
Hampton, J. A. (1995). Testing Prototype Theory of Concepts. Journal of Memory and
Language, 34, 686-708.
Hampton, J. A. (1998). Similarity-based categorization and fuzziness of natural
categories. Cognition, 65, 137-165.
Hampton, J. A. (2007). Typicality, Graded Membership and Vagueness. Cognitive
Science, 31, 355-383.
Hampton, J. A., Dubois, D., & Yeh, W. (2006). The effects of pragmatic context on
classification in natural categories. Memory & Cognition, 34, 1431-1443.
Kamp, H. & Partee, B. (1995). Prototype theory and compositionality. Cognition, 57,
129-191.
Keefe, R. & Smith, P. (1997). Theories of vagueness. In R.Keefe & P. Smith (Eds.),
Vagueness: a reader (pp. 1-57). Cambridge: MIT Press.
Klin, C. M., Guzman, A. E., & Levine, W. H. (1997). Knowing that you don't know:
Metamemory and discourse processing. Journal of Experimental Psychology:
Learning, Memory, and Cognition, 23, 1378-1393.
Koehler, D. J., Brenner, L. A., & Griffin, D. (2002). The calibration of expert judgment:
Heuristics and biases beyond the laboratory. In T. Gilovich, D. Griffin, and D.
Kahneman (Eds.), Heuristics and Biases: The Psychology of Intuitive Judgment.
Cambridge: Cambridge University Press.
Koriat, A. (1993). How do we know that we know? The accessibility model of the
Lichtenstein, S., Fischoff, B., & Phillips, L. D. (1982). Calibration of probabilities: The
state of the art to 1980. In D.Kahneman, P. Slovic, & A. Tversky (Eds.),
Judgment under uncertainty: Heuristics and biases. (pp. 306-334). Cambridge:
Cambridge University Press.
Liu, Y., Su, Y., Xu, G., & Chan, R. C. K. (2007). Two dissociable aspects of
feeling-of-knowing: Knowing that you know and knowing that you do not know. Quarterly
Journal of Experimental Psychology, 60, 672-680.
McCloskey, M. & Glucksberg, S. (1978). Natural categories: Well-defined or fuzzy
sets? Memory & Cognition, 6, 462-472.
McCloskey, M. & Glucksberg, S. (1979). Decision processes in verifying category
membership statements: Implications for models of semantic memory. Cognitive
Psychology, 11, 1-37.
Seely, H. (2003) (Ed.). Pieces of Intelligence: The Existential Poetry of Donald H.
Rumsfeld. New York: Free Press.
Verheyen, S., Hampton, J.A., & Storms, G. (2010). A probabilistic threshold model:
Analyzing semantic categorization data with the Rasch model. Acta Psychologica,
135, 216-225.
Author Notes
Address all correspondence concerning this article to James A. Hampton, Department of
Psychology, City University, Northampton Square, London EC1V OHB, UK. Email:
[email protected]. We thank Priya Gorasia, Gurinder Jai and Elizabeth Thwaites for
Footnote
1. It is of course possible that one or more of the autobiographical events may have
occurred to participants in the intervening week. The likelihood of this was considered
very low, and would in any case affect consistency in both conditions.
2. Low response probability leads to greater predicted consistency because of the way
consistency was calculated. The repetition of any response other than the designated
response was counted as consistent. Thus if Definitely True had a low probability,
{Either Not sure Or Definitely False} had a high probability and so was likely to be
repeated. Hence the predicted consistency of a Definitely True response would
paradoxically increase as the probability of that response decreased. This issue is
APPENDIX A. Statements used in Experiment 1
Note: (Y) and (N) indicate items receiving >90% True, or >90% False responses respectively in the 2-response condition.
CATEGORY STATEMENTS
An apple is a fruit (Y)
An avocado is a fruit
A carrot is a fruit
A coconut is a fruit
A grape is a fruit (Y)
A mushroom is a fruit (N)
An olive is a fruit
Rhubarb is a fruit
A tomato is a fruit
A walnut is a fruit
An artichoke is a vegetable
Bamboo shoots are a vegetable
A cereal is a vegetable
Garlic is a vegetable
Lettuce is a vegetable (Y)
A peanut is a vegetable (N)
Sage is a vegetable
Seaweed is a vegetable
A turnip is a vegetable
Billiards is a sport
Bullfighting is a sport
Chess is a sport
Darts is a sport
Hunting is a sport
Kite flying is a sport
Mountaineering is a sport
Playing cards is a sport
Teaching is a sport (N)
Washing dishes is a sport (N)
An axe is a tool
A bottle is a tool
A bucket is a tool
A pen is a tool
A rake is a tool
A sewing needle is a tool
A tire is a tool
A toothbrush is a tool
An umbrella is a tool
Varnish is a tool
A chair is furniture (Y)
A cushion is furniture
A desk is furniture (Y)
A door mat is furniture
A lamp is furniture
A piano is furniture
A remote control is furniture (N)
A rug is furniture
A saucepan is furniture
GENERAL KNOWLEDGE
A common side effect of antidepressants is itching skin rashes
Adidas produces more shoes than Reebok
Aikido is a Japanese martial art where one often practices with wooden sticks
Aliens control people’s minds (N)
Astronauts wear spacesuits when taking a walk outside spaceships
Bicycles do not have wheels (N)
Black and Green tea have generally equally amounts of caffeine in them
Britain produces more meat than grain
Certain sounds can be very loud (Y)
Everything shown on the TV is true (N)
Green tea can enhance reaction time
Humans are 60-65% water
If climate change accelerates the Mediterranean will dry out within 85 years
If you faint standing up you are more likely to land on your back than on your front
In England cars drive on the left (Y)
In humans the spleen is larger than the liver
In parts of Africa there are still dinosaurs (N)
In the winter Canada is colder than Finland
John is the most common name in Britain
Lizard tastes like chicken (N)
London has more than 11 airports
Mongolia is a country (Y)
Music is something edible delivered in boxes (N)
No vehicle can go faster than the speed of light
North Korea is larger than South Korea
Olives are more popular in Greece than in Italy
People living in arctic conditions can breathe under water (N)
Platinum is more expensive than diamond
Sausages from Germany and sausages from Austria taste about the same
Scandinavia is formed by five countries
Sharks have been developing for millions of years
Snow falls from the sky
Some boats have motors others have sails (Y)
Some poisonous plants can induce prolonged coma in humans
Texas is the size of Oklahoma
The earth is flat (N)
The Internet was originally developed for military reasons