Novel Metrics to Quantify the Impacts of Frequency
Support Provision Methods by Wind Power
A. B. Attya, O. Anaya-Lara and W. E. Leithead Department of Electronic and Electrical Engineering University of Strathclyde, Glasgow, United Kingdom
Abstract—This paper introduces two novel metrics to judge the capability and influence of wind power to provide virtual inertia response (i.e. frequency support). The first metric considers the generation unit (i.e. wind turbine generator (WTG)/wind farm (WF) vs. synchronous generator). This metric is applied to compare between three different methods of provision of frequency support. The second metric assess the improvement or hindering in frequency response at the point of common coupling (PCC) between a WF and a synchronous area. This metric is critical especially to WFs that are connected via High Voltage Direct Current (HVDC) or Low-frequency AC links. Both metrics are universal so that they could be applied to any support method, and any power system. The first metric is applied to assess the virtual inertia response of an offshore WF, which is considered as a power plant along with the HVDC transmission link. Results assure the positive impact of the provision of frequency support by wind power. This impact is quantified could be used to tune frequency support controllers, and optimize system planning. It is verified that no obstacles are implied by the HVDC link to integrating frequency support methods, as the WF dominates the support process.
Keywords— wind power; power systems; ancillary services; HVDC, energy storage; virtual inertia
I. INTRODUCTION
The high penetration levels of wind energy in power systems excavate many challenges to maintain system stability. The retirement of conventional generation will imply strict requirements from WFs during frequency excursions. Thus, the provision of frequency support by WFs will be mandatory [1]. The sudden miss-match between generation and load demand causes the system frequency to deviate from its nominal value. The rate of frequency deterioration and its nadir are determined based on several factors, namely, system inertia, miss-match severity, and load dynamic behavior. At the early stage of drop, synchronous generators will naturally slow down to extract a portion from its kinetic energy (KE), stored in the turbine, and generator rotating parts, and convert it into electric energy (i.e. inertia response). However, the drop in generator synchronous speed should not exceed 2% from the nominal value (e.g. in a 50 Hz system; allowed drop is 49 Hz). This reaction continues for few seconds, then the primary (i.e. droop) response turns activate [2].
The concepts of emulated KE extraction (called from now on Method 1) and WTG de-loading (Applied in Method 2 as explained later) were developed in [3, 4] respectively. These two methods provide frequency support directly through the WTG. Energy storage mediums, namely battery banks were
implemented in [5] to provide indirect support (Method 3). This paper proposes a simple generalized approach to evaluate the inertial response provided by a generation unit/plant. Then it compares between the responses of these three frequency support methods. The response of a typical conventional unit is considered as a datum to judge the three methods. The impact of frequency support method on frequency response at PCC is also quantified through a novel metric. This metric counts on the integrated frequency support mechanisms and is designed to assess the impact of frequency support provision by WFs on the early critical stage of frequency excursion. These metrics could be utilized to 1- tune the frequency support controllers of WTG/WF, 2- mitigate the frequency measurements complications, 3- provide general judgment that is not event-dependent (i.e. independent of generation/load mismatch, and normal generation before the excursion). Moreover, they consider the capabilities of the power electronic converters of the HVDC links connecting large WFs, such that the WF (or group of WFs), and its HVDC are treated as a compact power plant. However, they are also valid to quantify the impact of a single WTG. These two metrics pave the way to achieve the utmost objective of estimating the system inertia and primary reserve at high penetration levels of intermittent renewable energies.
The paper is composed from six sections including this introduction. The next section introduces the first metric that mainly counts on the amount of released energy in the early stage of frequency support. It also compares between three different methods of frequency support using this metric. The second metric is introduced and explained in Section 3, in addition to the implemented benchmark system. Meanwhile, the executed case studies are described and their results are analyzed in Section 4. The first metric is evaluated for the WF and its connecting HVDC that are treated as a power plant, then the results are discussed. Finally conclusions and future work are briefed in sixth section.
II. SUPPORTIVE ENERGY TO RATED POWER RATIO The released supportive energy (ES) by certain generation
unit during the early stage of a frequency drop (i.e. inertial response) is compared to the rated output power (Pr) of the
same unit. In particular, ES/Pr is evaluated for the three
considered support methods, and compared to that of a standard conventional unit. The inertial response time is assumed to be 4 s, and the speed will drop to its threshold (nominal frequency; fo = 50 Hz, and nadir frequency; f = 49
derived though (1) and (2) where J is the aggregate moment of inertia of the generator set. An average turbine-generator unit is considered with inertia constant (H) of 4 s. The corresponding value of ES/Pr is 0.16 s.
2
2 2
2 2 ;
2
2 o
o
r
E J f f J P H
f
(1)
2 1 r inertial o
f H
f E
P
(2)
A. Implementation to support methods
The ES/Pr is not highly dependent on the unit rated power
and other characteristics, hence the comparison is universal. It is assumed that the wind speed (WS) is fixed during inertial response. The delays caused by controllers are ignored in this section due to their actual very fast responses (i.e. delay in range of milliseconds, which will have very minor impact on the obtained results). In all the implemented case studies the output array of the WTG/WF is obtained. Afterwards, trapezoidal numerical integration is used to evaluate the amount of supportive energy during the inertia-stage (i.e. first 4 s) of the frequency excursion.
1) Method 1 – WTG deceleration
The WTG at Maximum Power Tracking (MPT) operation does not provide any support to the system during frequency drops [1]. However, Method 1 proposed an algorithm to accelerate the WTG speed to a higher value by tuning the tip speed ratio (λ). Because the WS is fixed during the inertial response, WTG will provide step increase in its output power (in analogy to the power surge from a conventional plant) when λ is recovered to its optimum value (λo). This power step
has two components; the first one is based on the extracted energy due to the deceleration from the higher speed to the optimum speed (∆PKE). The second component is due to WTG
aerodynamics (∆Po), as it produces the optimum output (i.e.
operates at λo) not a reduced value as illustrated by (1).
According to Method 1, ES/Pr is evaluated at high tip speed
ratio λH = 1.2∙ λo for the GE-77 1.5MW (J = 543 kg∙m2) [6].
ES/Pr is evaluated at several WSs (WS class is 0.5 m/s), and
the average values of different WS ranges (i.e. low, moderate and high) are obtained using (3).
4 seconds KE o
r inertial
P P
E
P WT rated power
(3)
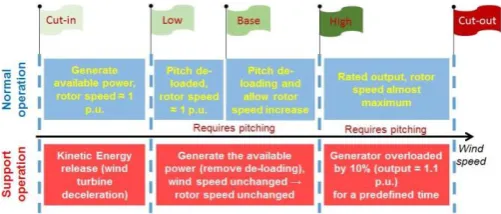
2) Method 2 – location-tunable and multi-concept
The same procedure is repeated but the only change is in the determination of support power step which depends on the WS range that coincides with the frequency event. The analysis is conducted for two different locations; Ghareb and Nabq (average annual WSs; 9.8 and 6.8 m/s). As an illustration, Method 2 has a unique advantage where the tuning of some parameters is related to the average WS at the WTG/WF location. The de-loading ratio (DF) is 15%, and the
same WTG type is examined in the two locations. In Method 2, no single equation describes the provided power surge,
because it has three different possibilities according to the prevailing WS as illustrated in Figure 1 [4].
3) Method 3 – energy storage
The provided power surge is based on the discharging power of the storage bank (SB), independent of WS and WTG inertia, hence the equivalent contribution of a single WTG should be assessed. In other words, the SB carries out the role of WF in frequency support, thereupon it is required to evaluate the share of a single WTG in the support provided by the SB. The two locations selected for the assessment of Method 2 are also investigated, so that the results are comparable. According to [5], Ghareb and Nabq sites have the same number and types of WTGs (65*GE-77 1.5MW, and 65*G-90 2MW). However, according to the applied sizing method that counts mainly on the WS and load-demand variations, the SBs of the two locations are not equal. The rated power of the SBs assigned to Ghareb and Nabq are 42 and 28 MW respectively [5]. The share of a single GE-77 is estimated proportional to its rated power compared to the aggregate rated power of the WF, so that the ‘indirect’ power step provided by the WTG is evaluated, thus ES/Pr is obtained using (4), where ∆Pdisch is the
rated power of the SB (The SB provides its rated power as soon as frequency violates the safe dead-band to mitigate the dependence on frequency measurements and maximize the impact of the provided support).
disch .
1
4 seconds No of WTs types
r inertial
WT i i
i
P E
P
N WT rated power
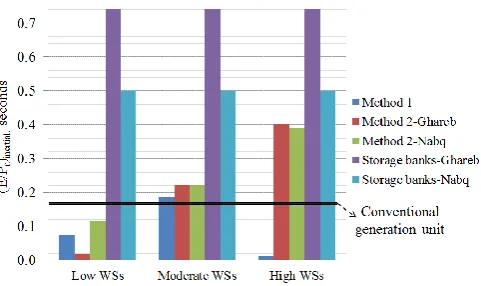
(4)B. Results
The complete results are depicted and compared in Figure 2. The black line represents the ES/Pr of the conventional unit.
The integration of SBs proved to be superior over the other methods from two aspects, firstly, it is fixed regardless WS conditions, and secondly it provided the highest ratio. However, ∆Pdisch has considerable impact, as it is directly
proportional to ES/Pr. SBs have a clear advantage compared to
[image:2.595.306.557.531.638.2]the conventional unit. On the other hand, Method 2 is always better than Method 1. At low WSs, Method 1 contribution is limited by certain minimum WS to be sure that decelerating the WTG does not violate speed limits.
Fig. 2. ES/Pr values for all methods at different ranges of WS
In addition, accelerating the WTG at very low WSs intensely reduces the WTG output during normal operation. On the contrary, in Method 2 support mode, the WTG is decelerated below its optimum rotor speed to provide higher output than the available mechanical power by a factor of 2*DF. However, in locations characterized by high average
WS, this advantage is lost due to the tuning of base WS and rotor speed (which are predetermined parameters for Method 2), thus the power surge is reduced (as in Ghareb site). At high WS, Method 1 is almost incapable of providing any support due to the upper limit of rotor speed [3], and overloading the WTG is not allowed. In contrast, in Method 2, the permitted 10% WTG generator overloading margin is effective, and starts earlier when the average WS in the location is higher (As illustrated in Figure 1), hence there is a slight difference between Ghareb and Nabq. At moderate WSs, Method 2 has a slight merit compared to Method 1 that depends on the λH, DF
and the aerodynamics and inertia of WTG. III. FREQUENCY RESPONSE AT PCC
This paper introduces a metric that reflects the ability of the system inertia to withstand sudden unbalance events between generation and demand, at PCC to an HVDC link that connects a large WF. This parameter counts on the procurement of accurate system frequency responses at different events of sudden changes in load (ΔL; rise and drop). Afterwards, curve fitting methods are applied to evaluate the numerical values of A and B in (5) that imitates the frequency behavior at its early stage (i.e. inertia contribution stage) [2]. A and B are two real values that are fixed at certain bus in the system for the given frequency support methods. The time instant at which the frequency drop/rise starts is tevent. Since the focus is on the
inertia response, this equation is valid to the early stage of the frequency excursion (Assumed to be the first 4s), which mainly depends on the natural/virtual inertia responses of the connected generation assets and loads.
(1 ); 4 sec
t
o B
event event
f L
f e t t t onds
A
(5)
It is verified through the mathematical nature of (5), and excessive simulations that, the variation of the supplied power via the HVDC link (i.e. WF production) prior to event initiation, does not have any impact on the system frequency response. It is worth mentioning that B is not the system
inertia, and A is almost the short-circuit capacity of the connected external grid, which represents the synchronous area to which the WF is connected via the HVDC (This is verified through the implemented benchmark system as shown in the next subsection). The values of A and B will change only if the supplied power in response to frequency deviations is changed. Thus, the system response without (Ao, Bo) / with (Ai, Bi) WF
contribution to frequency support are evaluated as explained earlier, and illustrated numerically in the next section to assess frequency stability at PCC.
After A and B values are obtained at different case studies (i.e. different frequency support methods), the Vulnerability to Frequency Deviations (VFD) at PCC is calculated using (6). The shape of the equation reflects the impact of each parameter on the frequency response. Increasing A and B will diminish the frequency nadir, and decelerate the rate of change of frequency. The normalization of A and B to Ao and Bo
respectively, eliminates the need to evaluate a weighting factor to the impact of each parameter on the frequency response. The benefit of (5) does not stop at the assessment of frequency response at PCC, but extends to the tuning of control parameters of frequency support methods by wind power. For example, DF could be selected either to maintain the system
response before wind power integration or to improve it. The majority of the proposed frequency-support methods count on frequency measurements that are provided by Phase Locked Loop (PLL), which yields undesirable errors and delays. Equation (5) mitigates the dependence on frequency measurements through the identification of ∆L (Through voltage and current variations) at the early milliseconds of the frequency excursion then the frequency deviation will follow the pre-defined regime with a Root Mean Square error (RMSE) around 1mHz which is 20 times less than 20mHz (The limit of the frequency drop dead-band for the activation of primary reserves according to ENTSO-E code [7]).
-1
; 1
1
i i
PCC i
o o
worse response
A B
VFD unchanged response
A B
improved response
(6)
A. Evaluation of Ao and Bo
The selected base case study is implemented to evaluate Ao
and Bo that are used as reference values to judge the system
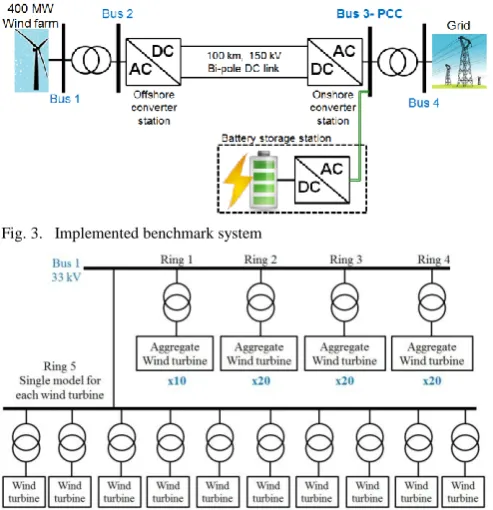
capacity). However, the WTGs connected to the fifth ring are simulated as 10 different models to provide more detailed results. The WF layout is shown in Figure 4. The WTG model is detailed to include the turbine, shaft, PQ controls of converters, and protection devices. These models are already embedded in DIGsILENT 5MW-DFIG template, and the default values of the parameters are applied. Likewise, the HVDC link detailed model embedded model in DIGsILENT library is integrated. The External grid model is used with a 10 GVA short circuit capacity and acceleration factor of 8 s, and it is considered as a slack bus. The synchronous area short circuit ratio with respect to WF capacity is 25, which reflects an average strength grid moderately resistible to frequency deviations [8].
The frequency responses at ΔL of 100, 150, 200, 300 MW are obtained to verify the validity of the values of Ao and Bo
under any sudden load/generation event using DIGsILENT. These frequency responses are obtained when all the primary and secondary responses of conventional plants (i.e. external grid) are deactivated to assure that the frequency decays according to the natural inertia of the system only. The frequency response at 200MW sudden rise in load is processed through MATLAB curve fitting tool applying Trust-Region algorithm with 1000 iterations. For the implemented bench-mark Ao and Bo equal 10270 MVA and 1.16 s respectively with
RMSE of 0.17 mHz. Afterwards, the frequency responses for the first 4s, at the other four events, are estimated using (1). The actual and estimated frequency responses are compared and the maximum average and absolute errors are 2.6 and 6 mHz respectively. This procedure (Illustrated in Fig 5) is repeated at different generation levels of WF and Ao and Bo
[image:4.595.308.529.58.204.2]values kept constant. This returns to the decoupling of WF from frequency changes of the system due to the power electronics interfacing through the HVDC link.
Fig. 3. Implemented benchmark system
Fig. 4. Implemented benchmark system – wind farm layout
Fig. 5. Evaluation process of A and B
IV. IMPACT OF FREQUENCY SUPPORT PROVISION ON VFD
A. Case studies
The value of VFD is obtained at 13 case studies as illustrated in Table I (ΔfS refers to the frequency deviation
threshold at which the frequency support should be activated). All the case studies imply ΔL of 200 MW to obtain a frequency response to estimate the corresponding values of A and B. However, as explained in the previous subsection, the values of A and B at each case study are independent from ΔL. The investigated case studies focused on three aspects; 1- the implemented DF, 2- the WF generation (i.e. the support power
surge is proportional to the WF actual production), and 3- ΔfS.
To expand the developed investigation, two different methods of switching from de-loaded to normal output are compared. In particular, direct switch (i.e. step) is compared to ramped switch (Noted in Table I as Droop de-loading). A simple controller, shown in Figure 6, is developed in DIGsILENT to provide both options. The droop ratio is selected such that the de-loading is completely deactivated when frequency drop reaches 200 mHz (fdropmax) through a linear ramp. The
advanced partial de-loading, Method 1, is not considered, however the de-loading concept adopted by Method 1, in some operation regions, is examined as explained.
TABLE I. IMPLEMENTED CASE STUDIES
No. WF output Applied support method ΔfS
1 120 MW Droop de-loading (DF = 20%) 50mHz
2 200 MW Droop de-loading (DF = 20%) 50mHz
3 280 MW Droop de-loading (DF = 20%) 50mHz
4 400 MW Droop de-loading (DF = 20%) 50mHz
5 120 MW Droop de-loading (DF = 10%) 50mHz
6 400 MW Droop de-loading (DF = 10%) 50mHz
7 120 MW Step de-loading (DF = 10%) 50mHz
8 400 MW Step de-loading (DF = 10%) 50mHz
9 120 MW Droop de-loading (DF = 10%) 20mHz
10 400 MW Droop de-loading (DF = 10%) 20mHz
11 400 MW Step de-loading (DF = 20%) 20mHz
12 200 MW- no frequency
support
Battery bank (20 MW) 50mHz
[image:4.595.36.283.436.691.2]Fig. 6. Integrated de-loading controller to each WTG
It is worth mentioning that the applied de-loading method set the reference power signal fed to the controllers of the power electronics converter to maintain the assigned DF. The
alternative concept of pitch angle de-loading, which counts on increasing the pitch angle above its nominal value (i.e. provided by MPT) to maintain DF is not applied. Hence it
should be faster as there is no mechanical response (i.e. servomotors controlling blades) in the loop. All the case studies acknowledge the frequency measurements problems caused by PLL due to the integration of a typical model of a PLL unit to measure the frequency at PCC. The delay caused by communicating the frequency signal is interpreted by a first order delay of 10 ms as shown in Figure 6.
The possibility of installing an onshore SB nearby the PCC is investigated in Case studies 12 and 13. The WF does not provide any frequency support in these two cases to focus on the impact of the SB and the power electronics controllers that interface the SB to the PCC. The implemented controller to provide active power support through a drooped response is shown in Figure 10 in the Appendix.
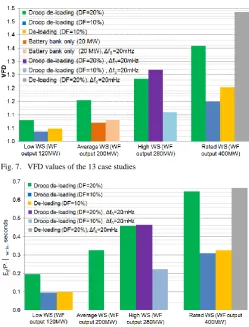
B. Results
The obtained VFD values at the PCC for the 12 case studies are aggregated and compared in Figure 7. Since the de-loading approach is adopted, the cases with higher WF production achieved better results, where the highest VFD coincided with rated production 20% step-switch de-loading, and earlier support (i.e. ∆fS = 2mHz). On the contrary the lowest
improvement in VFD is realized through drooped 10% de-loading at poor WS conditions. The results assure that the DF
plays more important role than the WF production; hence case studies applying higher DF achieve better VFD (Green bars)
although the actual wind power might be lower (Compared to cases of lower DF but at with better WS conditions). The width
of frequency dead-band plays a less critical role, but still with considerable impact. The VFD improved by 0.05, at above-average WS conditions, when the dead-band shrinks from 5mHz to 2mHz. The switching from instant to drooped de-loading has less impact, especially that the droop de-de-loading is done through a steep ramp (de-loading is completely avoided when frequency deviation reaches 0.2Hz). The improvements achieved by the onshore SB are limited (0.079) due to its low rated power that is assumed to be 5% from the installed capacity of the WF in analogy to the dominant range of primary reserve provided by a conventional power plant.
The maximum RMSEs in all case studies occur in the case studies characterized by very high supportive power surge, namely the cases of rated power WF production and 20% de-loading (The highest RMSE is 11 mHz in Case 11). Apart from this, the RMSE is below 1mHz which is convenient for the sake of quantifying the frequency stability at PCC.
V. ASSESSMENT OF ENERGY TO POWER RATIO ON WF LEVEL The values of ES/Pr, and shown in Figure 8, are obtained to
the WF and point-to-point HVDC link as a power plant (From viewpoint of the power system at PCC) in case studies 1 to 11 Likewise, the SB is treated as a power plant in Case studies 12 and 13. The conclusions extracted from the results of VFD are confirmed through the values of ES/Pr. However, the difference
of instant and drooped de-loading is clearer in VFD compared to ES/Pr (Blue and amber bars). All the values ES/Pr assured
satisfactory inertia responses exceeding that of conventional units. For the sake of figure clarity the ES/Pr of WF+HVDC
link are omitted because they are almost identical (deviations in range of 0.005 to 0.01 s), which confirms that the HVDC does not imply any barriers on the provided frequency support and transmits the power surge in a smooth and timely manner. In addition, the communication delays and PLL issues do not affect the virtual inertia. But their impact is emphasized through the VFD index. As an illustration, the amount of supportive energy is not affected by these two factors, but the releasing process is slightly affected by them.
The ES/Pr of SBs as are not included because they are much
[image:5.595.306.556.332.660.2]higher (3.3 and 3.9 s in Case studies 12 and 13 respectively) because the SB does not provide power in normal operation thus the supportive energy to rated power ratio is much higher.
Fig. 7. VFD values of the 13 case studies
VI. CONCLUSIONS AND FUTURE WORK
The literature proposes several control methods that enable the WTGs and WFs to provide frequency support. However, there is still a major need to define universal and simple metrics that compare between the impacts of these methods. This paper proposed two metrics; the first one assesses the virtual inertia of the power electronics interfaced generation assets. The second metric quantify the frequency immunity of certain bus (PCC) in the system through a numerical index. This index quantifies the improvement or the degradation in comparison to the conventional system (Before the provision of frequency support by wind power and/or storage).
Results revealed that the integrated support method plays a key role, namely the implemented 1- de-loading ratio, 2- step or ramp recovery to not de-loaded operation, and 3- dead-band of normal frequency deviations. The impact of WS conditions is slighter. The energy storage achieved remarkable results especially that all its rated power is utilized to provide support; hence its energy-power ratio is much higher compared to other support methods. The HVDC link transmitted the supportive power surge fast and efficiently such that the values of the first metric of the wind farm only, and the combined wind farm and HVDC link are almost identical. It is of note that, the two proposed metrics are completely independent of each other. Thus, error propagation is avoided, but the analysis of their values gives a comprehensive picture for the integrated frequency support methods by wind power or any other power electronics interfaced generation like battery storage systems.
Future work will evaluate these two metrics under different penetration levels of wind power. The two metrics will be developed to estimate the virtual inertia of multi-terminal HVDC network, and low frequency transmission links. Further case studies will be executed to examine the impact of wind speed gusts and severe drops during the provision of virtual inertia. Pitch angle de-loading method will be also examined.
ACKNOWLEDGMENT
This work is supported by the EU FP7 IRPWIND; Grant agreement Number: 609795, and the EPSRC funded project SUPERGEN Wind Energy
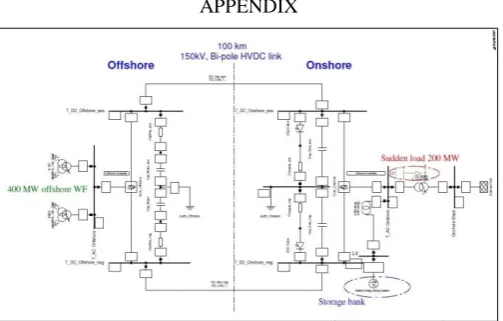
[image:6.595.308.529.53.114.2]APPENDIX
[image:6.595.38.290.532.692.2]Fig. 9. The benchmark system representation in DIGsILENT PowerFactory
Fig. 10.Drooped frequency support controller of the SB in cases 12 and 13
REFERENCES
[1] F. Díaz-González, M. Hau, A. Sumper, and O. Gomis-Bellmunt, "Participation of wind power plants in system frequency control: Review of grid code requirements and control methods," Renewable and Sustainable Energy Reviews, vol. 34, pp. 551-564, 6// 2014. [2] P. Kundur, Power System Stability and Control. New York: McGraw-Hill Inc., 1994.
[3] A. B. T. Attya and T. Hartkopf, "Control and quantification of kinetic energy released by wind farms during power system frequency drops," Iet Renewable Power Generation, vol. 7, pp. 210-224, May 2013.
[4] A. B. Attya and T. Hartkopf, "Wind turbine contribution in frequency drop mitigation - modified operation and estimating released supportive energy," Iet Generation Transmission & Distribution, vol. 8, pp. 862-872, May 2014.
[5] A. B. Attya, "Integrating battery banks to wind farms for frequency support provision–capacity sizing and support algorithms,"
AIP Journal of Renewable and Sustainable Energy, vol. 7, 2015. [6] N. Miller, W. Price, and J. Sanchez-Gasca, "Technical Report-Dynamic modeling of GE 1.5 and 3.6 wind turbine-generators," General Electric Company, 2003.
[7] ENTSO-E, "Supporting document for the network code on load-frequency control and reserve," 2013.
[8] C. Li-Jun and I. Erlich, "Doubly Fed Induction Generator Controller Design for the Stable Operation in Weak Grids," IEEE Transactions on Sustainable Energy, vol. 6, pp. 1078-1084, 2015.
Ayman Attya is a Research Associate in the Institute for Energy and Environment at the University of Strathclyde, UK. He received his BSc and MSc degrees of Electrical power engineering from Ain Shams University, Cairo, Egypt in 2005 and 2008 respectively. He was awarded the DAAD full PhD scholarship in 2010; thereupon he received the title of Doctor Engineer from the Technical University of Darmstadt, Germany in 2014. He is a major investigator in wind integration research projects funded by the EU through the European Energy Research Alliance (EERA). His research interests are power systems stability and modelling, energy conversion, control systems design, and wind power.
Olimpo Anaya-Lara is a Reader in the Institute for Energy and Environment at the University of Strathclyde, UK. Dr. Anaya-Lara is a key participant to the Wind Integration Sub-Program of the European Energy Research Alliance (EERA) Joint Program Wind (JP Wind), leading Strathclyde contributions to this Sub-Program. He is a member of the Scientific Advisory Board of the Norwegian Centre for Offshore Wind Technology. Dr Anaya-Lara is a CI of the EPSRC Supergen Wind Hub and member of the Management Core Team of the EPSRC Centre for Doctoral Training in Wind and Marine Energy Systems at Strathclyde.