REMOTE AUTOMATIC INCIDENT DETECTION
USING INDUCTIVE LOOP DETECTORS
Tom Cherrett, (BSc, PhD, MCILT) Lecturer, Transportation Research Group
Ben Waterson (BSc, MSc)
Lecturer, Transportation Research Group [email protected]
Mike McDonald, (BSc, PhD, CEng, MICE, MIHT, MCILT) Director, Transportation Research Group
The Transportation Research Group, School of Civil Engineering and the Environment,
University of Southampton, Highfield,
Southampton. SO17 1BJ. United Kingdom
ABSTRACT
This paper describes the RAID algorithm, (Remote Automatic Incident Detection) designed to detect abnormal periods of traffic congestion existing over single inductive loop detectors (typically 2m by 1.5m). RAID identifies those detectors which show a critical increase in Average Loop-Occupancy Time Per Vehicle (ALOTPV) coinciding with a critical decrease in Average Time-Gap Between Vehicles (ATGBV) according to a set of rules previously defined by the operator. The rules define the maximum and minimum values of ALOTPV and ATGBV respectively for each detector, which when exceeded for a given duration, trigger a report of a potential traffic flow ‘abnormality’ for that time of day at that particular location on the network. Initial rules are developed by studying the 85th percentile values of ALOTPV returned by the urban traffic control system every 30-seconds.
A real-time trial of RAID took place between 07:00 and 19:00 over 167 consecutive days involving 74 detectors situated along two sections of the A33 Bassett Avenue and A35 Winchester Road in Southampton. Over this period, 181 and 334 RAID triggers were recorded on the A33 and A35 respectively. An independent operator log showed that over the same period, 32 incidents were recorded on the A33 and 49 on the A35. RAID detected 69% and 92% of the verified incidents on the A33 and A35 respectively. The low detection rate on the A33 being mainly due to five incidents which occurred during off-peak periods causing no congestion and were therefore not detected.
INTRODUCTION
With levels of traffic congestion in urban areas set to rise significantly by 20161, the need to manage traffic more effectively becomes acute. The annual cost to business resulting from traffic congestion has been estimated at £20 billion2 whilst road accidents have been estimated to cost the country over £16 billion per annum3. Considerable benefits to society in terms of reduced fatalities and overall network delay could be gained through earlier identification of traffic abnormalities.
signal control meant that RAID could be designed as an ‘added value’ product which could become part of an existing UTC package.
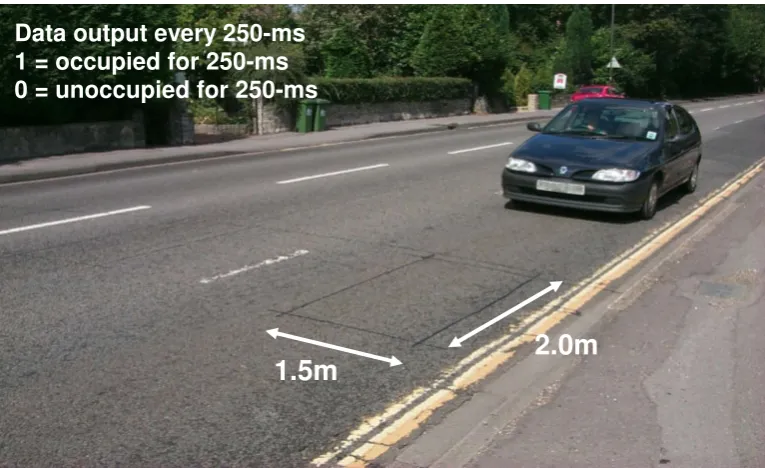
Figure 1. Vehicle detection by single inductive loop
AIMS
The research described in this paper is therefore concerned with identifying abnormal periods of congestion over individual or specific groups of detectors using these 250-ms digital profiles. The study uses single inductive loops situated in single carriageways (2 metres by 1.5 metres, Figure 1) as well as single loops split over two carriageways (2 metres by 6.5 metres) situated on urban roads within the city of Southampton5.
Specific aims using the simplistic 250-ms digital output produced from a single inductive loop detector were:
a) Develop a set of detection rules using historical loop data to identify abnormal periods of congestion existing at individual or multiple detector sites simultaneously.
b) Design a detection system (RAID) using the rule-set to interrogate detectors in real-time through an existing UTC system.
c) Test the accuracy of RAID and its underlying rule-set through an extensive six-month field trial using signalised and non-signalised roads in Southampton.
BASIS FOR THE METHODS DESCRIBED
The occupancy status of an inductive loop detector functioning in a UTC system running an adaptive traffic signal control system (such as SCOOT6 - Split Cycle
Data output every 250-ms 1 = occupied for 250-ms 0 = unoccupied for 250-ms
and Offset Optimisation Technique) is sampled every 250-ms, providing a digital profile of the passing vehicles. These data are used to automatically monitor traffic patterns and optimise signal settings accordingly to reduce vehicle delays and stops.
A detailed description of the methodology for extracting the necessary parameters from the detector data has been described in detail6. In summary, single inductive loop detectors buried in the road surface produce an analog signal which is turned into a digital signal by a detector pad usually located in the controller. A value of 1 indicates the presence (and a value of 0 the absence) of a vehicle over the loop7. The number of successive 1s produced is a combined measure of the active detection length of the loop and the effective metallic length of the vehicle and is inversely proportional to speed5 (Equation 1).
N = 4 * (DL + VL)/VS...Equation (1)
Where:
• N is the number of digital 1s produced, each representing 250-ms of
occupancy
• DL is the detector’s effective magnetic length (metres) • VL is the effective magnetic length of the vehicle (metres) • VS is the vehicle speed (metres/second)
For vehicles travelling over a detector in a given time period, a measure of the combined effects of their speed and length can be obtained by totalling the number of occupancies (repeated 1s) and dividing by the number of vehicles (1/0 or 0/1 ‘switches’ within the data). The parameter produced is the Average Loop-Occupancy Time Per Vehicle (ALOTPV). In the case of a detector being sampled every 250-ms, the ALOTPV for a 30-second period could range from infinity, (no occupancies and therefore no switches) to 119 (119 quarter second intervals of occupancy, 1 quarter second interval of metal absence and hence 1 switch).
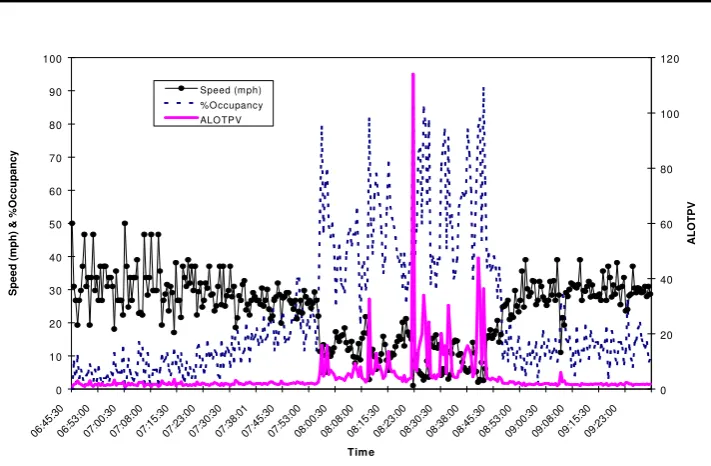
0 10 20 30 40 50 60 70 80 90 100 06:4 5:30 06:5 3:00 07:0 0:30 07:0 8:00 07:1 5:30 07:2 3:00 07:3 0:30 07:3 8:01 07:4 5:30 07:5 3:00 08:0 0:30 08:0 8:00 08:1 5:30 08:2 3:00 08:3 0:30 08:3 8:00 08:4 5:30 08:5 3:00 09:0 0:30 09:0 8:00 09:1 5:30 09:2 3:00 Tim e S p e e d ( m p h ) & % O c c u p a n c y 0 20 40 60 80 100 120 A L O T P V Speed (mph) %Occupancy ALOTPV
Figure 2. Example 30-second ALOTPV, percentage occupancy and average speed data
It is also possible to use the 250-ms periods of zero occupancy to gauge the Average Time-Gap Between Vehicles (ATGBV). The ATGBV is determined by dividing the number of 250-ms vacant periods (successive 0s) by the number of vehicles (1/0 or 0/1 ‘switches’). The parameters of ALOTPV and ATGBV were developed as part of an EPSRC ‘LINK’ funded project8 and are output as part of the U06 operator message produced by the Siemens Traffic Controls Ltd UTC system (UTC systems routinely provide traffic managers with access to a mass of data through a series of event driven messages).
0 2 4 6 8 10 12 14 16 18 20 06:0 0:00 06:1 5:00 06:3 0:00 06:4 5:00 07:0 0:00 07:1 5:00 07:3 0:00 07:4 5:00 08:0 0:00 08:1 5:00 08:3 0:00 08:4 5:00 09:0 0:00 09:1 5:00 09:3 0:00 09:4 5:00 Time A L O T P V 0 20 40 60 80 100 120 140 A T G B V ALOTPV ATGBV
Figure 3. Example 30-second ALOTPV and ATGBV data
[image:5.595.114.451.504.702.2]Figure 3 shows the ALOTPV and ATGBV plotted for a southbound detector on the A33 Bassett Avenue in Southampton between 06:00 and 09:50. The data shown are from a weekday morning during which no traffic incidents were reported along the link (independently verified through CCTV footage). The lack of southbound traffic is evident between 06:00 and 07:15 whilst the carriageway at the detector site operates at its most optimal between 07:40 and 08:05, when both ALOTPV and ATGBV are at a minimum (indicating vehicles travelling at speed with minimum headway).
DEVELOPING A DETECTION RULES SET
As seen in Figure 3, the ‘normal’ values of ALOTPV and ATGBV can potentially vary by individual detector and time of day. From historical incident records and ALOTPV data files collected from detectors within the city of Southampton, it was established that rules based on the 85th percentile value of ALOTPV could be used as an initial threshold at which to trigger incident alarms (Figure 3). Studying the 85th percentile values of ALOTPV from six months of off-peak and peak-time detector data suggested that an appropriate trigger threshold for off-peak periods (19:00 – 07:00 and 09:30 – 16:00) would be 4.3 (4.3, 250-ms periods of occupancy per vehicle every 30-seconds) whereas peak periods (07:00 – 09:30 and 16:00 – 19:00) would be 10 (the average vehicle in a 30-second period taking 2.5 seconds to cross a 2-metre detector).
0 5 10 15 20 25 30 35 40 45 50
0.5 1 1.5 2 2.5 3 3.5 4 4.5 5
Trigger Duration (minutes)
N
u
m
b
e
r
o
f
R
A
ID
A
la
rm
s
N03214A
N03214B
[image:6.595.121.462.449.670.2]N03214D
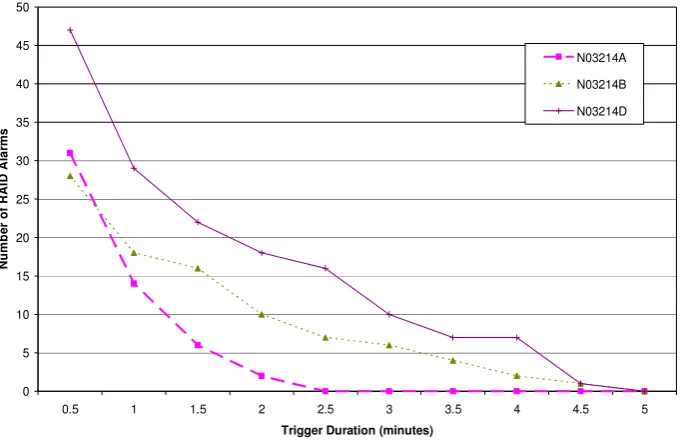
Figure 4. Impact of trigger duration on false alarm rate
and peak ALOTPV trigger thresholds on detector data where high levels of congestion were observed suggested that breaches lasting more than three consecutive minutes during off-peak periods (09:30 – 16:00, 19:00 – 07:00), and four minutes during peak periods (07:00 - 09:30, 16:00 – 19:00) were sufficiently unusual to warrant further investigation by the operator. During the trials, considerable numbers of alarms were raised for both peak (Figure 4) and off-peak values when the trigger duration was less than two minutes. In designing RAID it was considered important to only notify the operator of particularly unusual traffic conditions over the detectors and as a result the trigger durations were set at such a level as to reduce the number of false alarms.
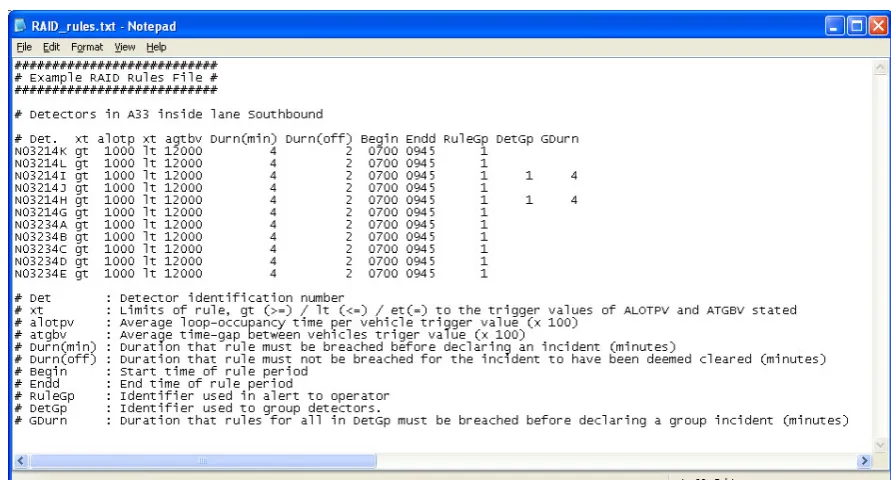
[image:7.595.101.547.309.549.2]A RAID rules file therefore allows the operator to define a set of ALOTPV and ATGBV trigger thresholds and durations for either individual or groups of detectors for different periods of the day (Figure 5).
Figure 5. Example operator defined rules file
DEVELOPING THE RAID ALGORITHM
RAID classifies each detector into one of six operating states:
State 0
The detector is not covered by any rules in the rules file.
State 1
The current value of ALOTPV is less than the trigger value of ALOTPV listed for the particular detector. (No incident).
State 2
The current value of ALOTPV is greater than or equal to the trigger value of ALOTPV but the value of ATGBV is greater than the minimum trigger value for the particular detector. (No incident).
State 3
The current value of ALOTPV is greater than or equal to the trigger value of ALOTPV and the value of ATGBV is less than or equal to the minimum trigger value for the particular detector. (Incident trigger breached).
State 4
State 3 has remained in place for the ‘duration’ period set by the operator for the specific detector. (Single detector Incident alerted)
State 5
State 3 has existed for each of the detectors listed under a defined ‘detector group’ for the group duration time. (Group incident alerted).
RAID alerts the control room operator to detectors reporting traffic conditions that have breached the trigger thresholds listed in the rules file. This is done via a UTC event message (U15) which states the time the alarm trigger threshold was breached, the affected detector and the relevant rule group in the rules file. For example:
-WARN- 13:47:30 detector N03214E incident detected by rule 5.
When the abnormal traffic conditions have cleared, according to the length of time the values of ALOTPV and ATGBV have been maintained below the trigger threshold, the U16 UTC output message alerts the operator. For example:
-GONE- 14:22:30 detector N03214E incident cleared.
• An interface between RAID and the UTC map editor to enable the U15
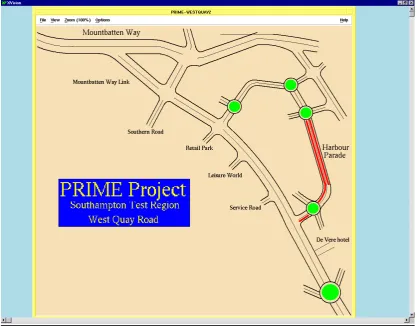
(alarm on) and U16 (alarm off) messages to be represented on maps of the network via flashing detectors or links. When a detector in the area of the map triggers a UTC U15 alarm, the particular road section flashes red (Figure 6). The operator can then (using the mouse) click on the relevant section which takes him/her into a more detailed schematic (Figure 7).
• An interface to link the U15 message to the CCTV automatic positioning
[image:9.595.104.522.273.599.2]system. This enables operators to define camera views that overlook individual or groups of detectors. When RAID produces a U15 message alert, the appropriate CCTV camera will automatically re-position its view to the affected link, alerting the operator.
Figure 7. A detailed ‘inner’ map showing the individual detectors registering a RAID alarm
COMPARISON WITH EXISTING SYSTEMS
An existing incident detection system INGRID9,10 (Integrated Incident Detection), has been available to Local Authorities as part of commercial UTC systems for several years. It uses the output from two algorithms to alert the operator to potential traffic incidents on signalised intersections. Firstly, current values of flow and occupancy are examined for sudden changes against historical reference values stored by ASTRID (Automatic SCOOT Traffic Information Database9). Standard deviations and mean values of historical flow and occupancy data are then used to determine confidence levels against which the current values are evaluated, derived from the detector output each signal cycle. The rules in INGRID state that an incident is likely if the ‘trigger’ conditions exist for one-minute. When these conditions exist for three consecutive minutes, more weight is given to the incident report. To detect incidents INGRID needs to be configured with the network topology and relative detector locations and receive flow and occupancy data from consecutive loops in order to detect incidents in the road space between them.
• RAID uses the more detailed raw 250-ms data produced by UTC detectors
to derive values of ALOTPV and ATGBV every 30-seconds5.
• The use of a rules file rather than historical data allows a greater control
over system sensitivity (both trigger thresholds and required durations) for the operator.
• RAID does not require data from upstream and downstream detectors before
incidents can be detected in the section between. RAID is designed to alert the operator to abnormal conditions existing over individual detectors (or pre-defined groups of detectors where trigger thresholds have been exceeded simultaneously e.g. over roundabouts or arms of a signalised junction) and therefore does not require any information on network topology.
TEST RESULTS
As part of the PRIME project, RAID was installed in the Southampton UTC system operated through the ROMANSE project11 and tested using real-time data from inductive loop detectors situated on roads with and without traffic signals. The trial took place between 17/5/01 and 31/10/01 between 07:00 and 19:00 daily (167 consecutive days) and involved some 74 detectors situated along the A33 Bassett Avenue and A35 Winchester Road. The A33 Bassett Avenue is a major four-lane non-signalised carriageway linking the M3 to Southampton city centre. It has been equipped with single inductive loop detectors fitted at approximately 100m intervals along its 1.5km length. The A35 Winchester Road is a 941m stretch of single carriageway A-class road encompassing six sets of traffic signals, linking Southampton General Hospital on the north side to the largely residential district of Shirley on the south. Both test sites become very congested during peak commuter periods. All incidents, (defined as vehicle-on-vehicle impacts, vehicle breakdowns, illegally parked vehicles and emergency works) detected by RAID were recorded in a database and where possible, verified by the control room operators.
Over the 167 consecutive days, 181 and 334 RAID triggers were recorded on the A33 Bassett Avenue and A35 Winchester Road respectively. The operator log showed that during this period, 32 incidents were recorded on the A33 Bassett Avenue and 49 on the A35 Winchester Road. The RAID detection rate of verified incidents was 69% (22) and 92% (45) respectively. The low detection rate on the A33 was due to five incidents during off-peak periods which caused no congestion and therefore could not be detected by RAID.
beneficial to the control room operators however as one in every 3.8 RAID warnings resulted in either a delay message through Variable Message Signs or a radio traffic bulletin being issued by the control room to the general public.
Thirty three percent (59) and 40% (135) of the A33 and A35 RAID alarms respectively were for other reasons. On the A33, 64% of these (38) resulted from verified detector faults whereas the remainder could not be verified by the control room operator.
CONCLUSIONS
This paper describes an incident detection algorithm, RAID, which identifies single inductive loop detectors (typically 2m by 1.5m in size) which show a critical increase in ALOTPV coinciding with a critical decrease in ATGBV according to a set of rules defined by the operator. The rules define the maximum and minimum values of ALOTPV and ATGBV respectively for each detector, which when exceeded for a given duration denote a potential traffic flow ‘abnormality’ for that time of day at that particular location on the network. The rules file allows the operator to set rules for individual and groups of detectors for different periods of the day.
A RAID alarm could be due to a number of reasons including abnormally heavy congestion, a vehicle-on-vehicle impact, a broken down or illegally parked vehicle, emergency works or a detector fault. When these rules are broken for a set duration, the operator is warned through on-screen text messages and a graphical user interface linked to an automatic CCTV re-positioning system. There are several specific detector faults which can produce similar data to those that would be expected during queuing conditions. It must therefore be remembered that an ‘incident’ does not automatically imply an abnormal traffic situation but can also encompass a range of detector faults which produce similar output to that which would be created by queuing or stationary vehicles.
The need for reduced on-street hardware and low-cost installation configurations have led to the development of RAID as a single-station algorithm (issuing detection alarms based on the measurements from a single detector). This design adds flexibility as it does not require the set up of an ‘incident trap’, an area in which incidents are presumed likely and for which a pair of detectors have been fitted, one at each of the upstream and downstream ends. To overcome the constraint of being a single-station algorithm, RAID uses a library of thresholds set by the local traffic manager. The effectiveness of the algorithm increases with the degree of library detail and the extent to which the thresholds have been defined for the different links and periods of the day.
strategies in response to abnormal traffic conditions. Identifying and verifying these conditions can be difficult when operators are required to monitor the output from multiple detection and surveillance systems simultaneously. In the case of ROMANSE in Southampton, the operator is faced with CCTV information relayed through 56 monitors in addition to the data produced by the UTC system which controls over 120 signalised junctions using 600 loop detectors. RAID is designed to help the operator monitor the network more effectively and in particular, provide information on areas of the network where CCTV coverage maybe more sparse.
Using the existing traffic control infrastructure as its operating platform, RAID is a ‘value added’ service giving the control room operator additional information from an existing data source at no additional capital cost. CCTV based detection systems have the advantage of allowing verification of the detected incident. While the control room operator still has to independently verify a RAID alarm (via CCTV or simple ‘street watch’ schemes where businesses or private houses near detector stations could be contacted to verify alarms raised by the system) the benefits of RAID are in its clear early warning of developing traffic problems.
REFERENCES
[1] Department for Transport. National road traffic forecasts (Great Britain) 1997.
(http://www.dft.gov.uk/stellent/groups/dft_transstrat/documents/page/dft_ transstrat_028332.hcsp)
[2] Freight Transport Association. Roads – Congestion is the real toll. Press release 29th December 2003.
(http://www.fta.co.uk/news/pressreleases/archive/20031229Roads-.htm)
[3] Royal Society for the Prevention of Accidents, Road safety engineering factsheet. Cost effective local safety schemes. 2000. (http://www.rospa.org.uk/cms/STORE/Road%20Safety/2_engineering_fil es/engineering.htm)
[4] http://www.trg.soton.ac.uk/prime/index.htm
[5] Cherrett T.J., Bell H.A. and McDonald M. Traffic management parameters from single inductive loop detectors. Transportation Research Record 1719, 2000, pp 112-120.
[6] The Department of Transport. The ‘SCOOT’ urban traffic control system’
The Department of Transport Traffic Advisory Leaflet 7/99, 1999.
International Conference on Road Traffic Monitoring, London, 1989, pp 24-28.
[8] EPSRC Grant GR/J97724. The estimation of journey times from detector data. 1996.
[9] Bowers D.J. and Bretherton R.D. The ASTRID/INGRID incident detection system for urban areas. Proceedings of the 2nd World Congress on Intelligent Systems, Yokohama, 1995, pp 134 – 139.
[10] Bretherton D. Current developments in SCOOT: Version 3.
Transportation Research Record 1554, 1986, pp 48 – 52.