itself. Please refer to the repository record for this item and our
policy information available from the repository home page for
further information.
To see the final version of this paper please visit the publisher’s website.
access to the published version may require a subscription.
Author(s): Daniel C Eastwood , Andrew Mead , Martin J Sergeant and
Kerry S Burton
Article Title: Statistical modelling of transcript profiles of differentially
regulated genes
Year of publication: 2008
Open Access
Research article
Statistical modelling of transcript profiles of differentially regulated
genes
Daniel C Eastwood*
†, Andrew Mead
†, Martin J Sergeant and Kerry S Burton
Address: Warwick HRI, University of Warwick, Wellesbourne, Warwickshire, CV35 9EF, UK
Email: Daniel C Eastwood* - [email protected]; Andrew Mead - [email protected]; Martin J Sergeant - [email protected]; Kerry S Burton - [email protected]
* Corresponding author †Equal contributors
Abstract
Background: The vast quantities of gene expression profiling data produced in microarray studies, and the more precise quantitative PCR, are often not statistically analysed to their full potential. Previous studies have summarised gene expression profiles using simple descriptive statistics, basic analysis of variance (ANOVA) and the clustering of genes based on simple models fitted to their expression profiles over time. We report the novel application of statistical non-linear regression modelling techniques to describe the shapes of expression profiles for the fungus Agaricus bisporus, quantified by PCR, and for E. coli and Rattus norvegicus, using microarray technology. The use of parametric non-linear regression models provides a more precise description of expression profiles, reducing the "noise" of the raw data to produce a clear "signal" given by the fitted curve, and describing each profile with a small number of biologically interpretable parameters. This approach then allows the direct comparison and clustering of the shapes of response patterns between genes and potentially enables a greater exploration and interpretation of the biological processes driving gene expression.
Results: Quantitative reverse transcriptase PCR-derived time-course data of genes were modelled. "Split-line" or "broken-stick" regression identified the initial time of gene up-regulation, enabling the classification of genes into those with primary and secondary responses. Five-day profiles were modelled using the biologically-oriented, critical exponential curve, y(t) = A + (B + Ct)Rt + ε. This non-linear regression
approach allowed the expression patterns for different genes to be compared in terms of curve shape, time of maximal transcript level and the decline and asymptotic response levels. Three distinct regulatory patterns were identified for the five genes studied. Applying the regression modelling approach to microarray-derived time course data allowed 11% of the Escherichia coli features to be fitted by an exponential function, and 25% of the Rattus norvegicus features could be described by the critical exponential model, all with statistical significance of p < 0.05.
Conclusion: The statistical non-linear regression approaches presented in this study provide detailed biologically oriented descriptions of individual gene expression profiles, using biologically variable data to generate a set of defining parameters. These approaches have application to the modelling and greater interpretation of profiles obtained across a wide range of platforms, such as microarrays. Through careful choice of appropriate model forms, such statistical regression approaches allow an improved comparison of gene expression profiles, and may provide an approach for the greater understanding of common regulatory mechanisms between genes.
Published: 23 July 2008
BMC Molecular Biology 2008, 9:66 doi:10.1186/1471-2199-9-66
Received: 7 August 2007 Accepted: 23 July 2008
This article is available from: http://www.biomedcentral.com/1471-2199/9/66
© 2008 Eastwood et al; licensee BioMed Central Ltd.
Background
Various statistical approaches have been specifically developed to summarise the vast quantities of data that are produced in microarray studies [1-3], employing anal-ysis of variance (ANOVA), clustering and network model-ling. Analysis of variance (ANOVA) has been used to identify those gene expression responses that are most affected by different treatments, often taking account of particular forms of treatment structure, such as the corre-lations between sample times in a time-course study [4]. Approaches for clustering genes with similar responses range from simple methods for observed data, the calcu-lation of correcalcu-lations between genes [5], through to clus-tering based on linear [6] or polynomial regression [7] or spline models [8]. Network models are used to recon-struct transcription factor activity [9] or infer regulatory networks [10], assuming a particular mechanistic model for the behaviour of each regulation function based on observed microarray gene expression data.
This paper aims to use standard statistical non-linear regression models to enhance the biological interpreta-tion of individual gene expression profiles. Such regres-sion models provide accessible methods to describe the shape of each gene expression profile as a function of time, thus providing an insight into the underlying proc-esses rather than simply identifying significant differ-ences. For example, non-linear models can be used to identify the time of a particular event in a gene expression profile, such as the time of rapid up- or down-regulation. Similarly, modelling transcript changes using parametric equations that allow biological interpretation can further allow the comparison or clustering of the shapes of the expression profiles based on biological interpretable parameters. Such non-linear regression techniques are commonly used in agronomic studies to describe responses to a range of quantitative input variables, but are not commonly used in the examination of gene expression data.
The initial model system used to investigate the potential of statistical parametric, non-linear regression approaches for gene profiling was fungal morphogenesis with data provided by quantitative reverse transcriptase PCR (qRT-PCR) which provides a more precise method than either Northern analysis or microarrays [11]. This system encompasses a range of growth forms from vegetative mycelium to multicellular organs which enable the fun-gus to respond to changes in nutrition and environment, and undergo pathogenesis or reproduction. The fruiting
bodies of the basidiomycete fungus Agaricus bisporus, the
cultivated mushroom, are ideal for studying fungal mor-phogenesis as they are macroscopic, the tissues are clearly de-lineated (stipe, caps and gills) and the initiation of
fruiting body morphogenesis is controlled environmen-tally. Differential screening and targeted gene cloning pro-cedures have identified genes up-regulated post-harvest in
A. bisporus fruiting bodies, based on Northern analysis [12-14]. Genes have also been identified which are expressed in developing fruiting bodies of several other
fungi, including Lentinula edodes [15], Pleurotus ostreatus
[16], Flammulina velutipes [17] and Coprinus cinereus
(Coprinopsis cinerea) [18,19].
This study investigated how expression profiles, generated
from qRT-PCR data of differentially regulated genes in A.
bisporus fruiting bodies, could be statistically modelled both to estimate the time of up-regulation and determine similar temporal expression patterns. The five genes cho-sen for profiling are functionally distinct, and therefore unlikely to have obvious common regulatory mecha-nisms: they are cruciform DNA binding protein,
cyto-chrome P450II, β (1–6) glucan synthase, glucuronyl
hydrolase and riboflavin aldehyde-forming enzyme [12,20]. Whilst being functionally distinct, these genes were expected to show broadly similar patterns of expres-sion following harvest, allowing the fitting of a single model form to all five responses. This enables the compar-ison of the profiles via biologically interpretable parame-ters rather than simply clustering genes based on the observed data. To determine the time when transcription first increased for each gene, transcript levels of each gene were examined at 3 h intervals for 24 h. Transcript levels were also measured at 24 hour intervals over 5 days. These profiles were modelled to provide directly interpretable parameter values, offering an insight into the regulation of the genes. Spatial control of gene expression was also assessed by comparing transcription in tissues of the har-vested mushroom during the first 48 hours post-harvest storage.
Furthermore, this study has applied these regression mod-elling approaches to publicly-available microarray data sets from published studies, to identify groups of genes showing similar regulatory patterns. The potential appli-cation of this approach to fully exploit the large quantities of high-throughout data was discussed.
Results
Comparison of methods of measuring gene expression in
A. bisporus
Gene transcript levels were obtained by qRT-PCR and Northern analysis (see Additional file 1) from the same RNA extracts obtained from the mushroom tissues. These data were then compared by calculating correlation coef-ficients and fitting simple linear regression relationships for Northern analysis response as a function of the qRT-PCR response, for each gene separately within each of the three experiments. Northern analysis responses increased with increasing values of the qRT-PCR response, and in most cases linear regression lines fitted well (see Addi-tional file 2). However, the Northern analysis response appears to reach an upper threshold at high values of the qRT-PCR response, e.g. for cruciform DNA-binding enzyme and glucuronyl hydrolase (0–5d and tissues
experiments), and β(1–6) glucan synthase (tissues
experi-ment). Exponential regression curves were then fitted to the responses and for ten of the 15 data sets these curves provided a better fit than the simple linear regression models (see Additional file 3), with the curvature of the response suggesting asymptotic regression, for example, glucuronyl hydrolase, 0–5d experiment (Figure 1).
Transcription in the first 24 hours (A. bisporus)
The different expression patterns for each gene over the first 24 hours following harvest, as obtained using qRT-PCR, are shown in Figure 2. During this period, transcript levels increased significantly, by approximately 10 fold or
more, for all genes except riboflavin aldehyde-forming enzyme (less than 2 fold). Transcript levels of cruciform DNA-binding protein increased shortly after harvest to very high levels, while for cytochrome P450II and glu-curonyl hydrolase the profiles showed an initial period of little change followed by increases in transcript levels (approx. 12 and 18 h after harvest respectively). In
con-trast the transcript levels of β(1–6) glucan synthase
increased continuously during the first 24 hours post-har-vest, with a notable sudden increase at about 9 h.
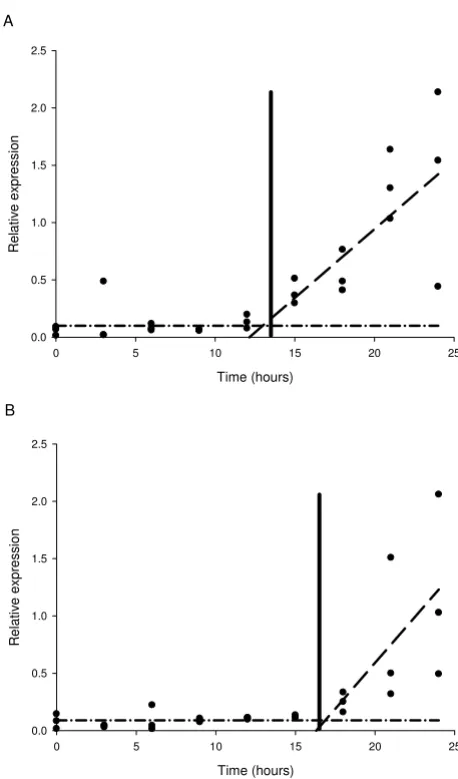
'Split-line' or 'broken-stick' analysis was used to model the transcription profile data from the first 24 hours to esti-mate the time at which an initial increase in transcription occurred. The model was applied successfully to the tran-script data for cytochrome P450II and glucuronyl hydro-lase, with these data sets each described by two separate linear regression line segments, the first line having a slope of zero (Figure 3). More precise estimates of when transcription first increased were determined in these analysis as 13.5 hours (+/- 2.1 hours (95% confidence interval)) for cytochrome P450II (Figure 3A) and 16.5 hours (+/- 2.1 hours (95% confidence interval)) for glu-curonyl hydrolase (Figure 3B). This analytical approach was not successful in describing the transcription profiles
of cruciform DNA-binding protein and β(1–6) glucan
synthase, as there were insufficient early time points to establish an initial baseline response (line with zero slope). Transcripts of riboflavin aldehyde-forming enzyme showed no clear upward trend in the first 24 hours, and so the 'broken-stick' analysis approach was again not successful.
Transcription profiling over 5 days post-harvest (A.
bisporus)
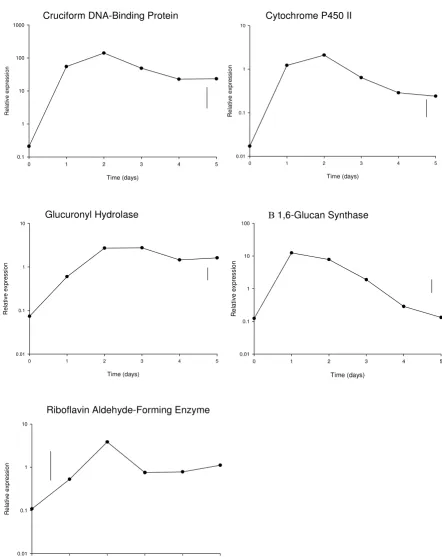
The 5-day transcript profiles, as obtained using qRT-PCR, showed an initial increase in transcript levels for all five genes for 1–2 days, followed by a plateau or a decline (Fig-ure 4). The extent of increase in transcript levels over the first two days ranged from 668 fold for cruciform DNA-binding protein, to 47 fold for riboflavin aldehyde-form-ing enzyme and 36 fold for glucuronyl hydrolase. Gene expression over five days storage, as measured using qRT-PCR, was modelled as a function of storage time by
non-linear regression analysis of log10-transformed data using
a critical exponential curve (Equation 1: y(t) = A + (B +
Ct)Rt + ε). This curve was selected in preference over either
the simpler single exponential curve or more complex double exponential curve, based both on the shape of the response, and a formal comparison of the goodness of fit of each model. This was achieved by comparing each more complex model to the simpler alternative (the criti-cal exponential can be considered a simpler alternative to the double exponential, and the single exponential a sim-pler alternative to the critical exponential). The
improve-Example showing the saturation of Northern-derived signal Figure 1
Example showing the saturation of Northern-derived signal. Exponential regression curve showing the relation-ship between the Northern analysis response (y axis) and the qRT-PCR response (x axis) for glucuronyl hydrolase during 5 days post-harvest storage. Fitted equation is y = 0.0746 – 0.0646 * 0.309x, R2 = 52.5%.
Relative expression (QPCR)
0 1 2 3 4 5 6
R
e
la
ti
v
e
ex
p
res
s
io
n
(
N
or
th
e
rn)
Gene expression during the first 24 hours post-harvest sampling at 3 hourly intervals Figure 2
Gene expression during the first 24 hours post-harvest sampling at 3 hourly intervals. Mean qRT-PCR (log10 -trans-formed) measurements of gene expression of the 5 selected genes during the first 24 hours post-harvest storage, sampling at 3 hourly intervals. Vertical lines show LSD (5%, 16d.f.) for comparing means at different times, as calculated from the residual mean square obtained from the ANOVA.
Cruciform DNA-Binding Protein Cytochrome P450 II
Glucuronyl Hydrolase Β 1,6-Glucan Synthase
Riboflavin Aldehyde-Forming Enzyme
Time (hours)
0 3 6 9 12 15 18 21 24
R
e
la
ti
v
e
ex
p
res
s
ion
1 10 100 1000
Time (hours)
0 3 6 9 12 15 18 21 24
R
e
la
ti
ve
e
x
p
re
ssi
o
n
0.01 0.1 1 10
Time (hours)
0 3 6 9 12 15 18 21 24
R
e
la
ti
v
e
ex
pre
s
s
ion
0.01 0.1 1 10
Time (hours)
0 3 6 9 12 15 18 21 24
R
e
la
ti
v
e
ex
p
res
s
io
n
0.1 1 10 100
Time (hours)
0 3 6 9 12 15 18 21 24
R
e
lati
v
e
ex
pr
es
s
ion
ment in fit was assessed using an F-test to identify the significance of the ratio of the change in residual variance between models to the residual variance for the more complex model.
For all genes, there was a significant improvement in the fit when choosing the critical exponential rather than the single exponential, but no significant improvement when choosing the double exponential over the critical expo-nential (data not shown). Simultaneous fitting of the crit-ical exponential curve to the data for all five genes allowed a comparison of the fitted parameters, and hence the
detection of degrees of commonality between the patterns of expression for the genes. This analysis identified that there was no significant improvement to the fit when
allowing parameter R (related to the curvature of the
response) to be different for the five genes, and so this parameter could be constrained to be the same. However, constraining the other three parameters to be the same across all five genes resulted in significantly worse fits, though for some pairs of genes the fitted (and derived) parameters did suggest some similarities (Table 1). The different parameters (both fitted and derived) can be interpreted in terms of particular features of the shape of
the response. The size of parameter C indicates the
magni-tude of the decline from the maximum expression
response, whilst the ratio of B over C is related to the time
to the maximum response. Parameter A measures the
asymptotic response level after lengthy storage, A + B is
the response at time t = 0, and the maximum response is dependent on all four parameters, obtained by inserting the time of maximum response into the critical exponen-tial equation (Equation 1).
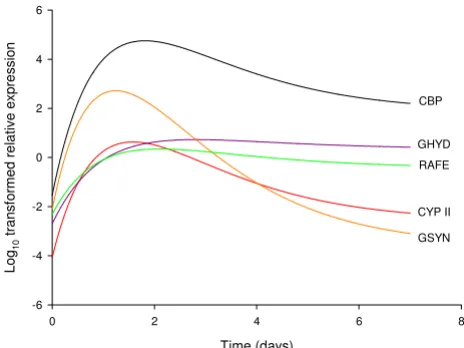
The analysis identified three distinct regulatory patterns (Figure 5). Cruciform DNA-binding protein and cyto-chrome P450II were identified as having similar shaped
curves (similar values of C) and similar times of peak
tran-script levels (similar ratios of B over C), despite large
dif-ferences in transcript magnitudes during this five-day
period (different values of both A and A+B). Similarly, the
transcript profiles of glucuronyl hydrolase and riboflavin aldehyde-forming enzyme shared a common curve shape
(similar values of C) and similar transcript values for both
the initial and asymptotic parts of the curve (similar
val-ues of both A and A+B). The time of maximum transcript
level of each of these genes was later than for the other
genes examined (larger ratios of B over C). The 5 day β(1–
6) glucan synthase profile had a different curve shape with
the earliest peak of transcript level (smallest ratio of B over
C) followed by a rapid decline (largest value of C, smallest
value of A).
Transcript expression between tissues (A. bisporus)
Transcript levels of each gene were measured in stipe, cap and gill tissues of harvested mushrooms over 2 days stor-age, using qRT-PCR (Figure 6). Differences in transcript levels, between tissues, between storage times and due to the interaction of these two factors, were assessed using ANOVA. Average transcript levels of cruciform DNA-bind-ing protein, cytochrome P450II, glucuronyl hydrolase and
β (1–6) glucan synthase in stipe and cap tissues were
sim-ilar and significantly higher than in the gills. For ribofla-vin aldehyde-forming enzyme, transcript levels were significantly higher in the stipe tissue compared with the cap or gills, which had similar levels. Despite differences in transcript levels observed between the tissues, all genes
[image:6.612.58.287.83.473.2]Broken-stick analysis showing the point of increased tran-scription
Figure 3
Broken-stick analysis showing the point of increased transcription. A) cytochrome P450II (CYPII) at 13.5 hours (+/- 2.13 hours) and B) glucuronyl hydrolase (GHYD) at 16.5 hours (+/- 2.05 hours) in A. bisporus fruiting bodies over the first 24 hours following harvest, sampling at 3 hourly inter-vals.
Time (hours)
0 5 10 15 20 25
Rel
a
tiv
e
ex
pr
essio
n
0.0 0.5 1.0 1.5 2.0 2.5
Time (hours)
0 5 10 15 20 25
R
e
lat
iv
e
e
x
pr
ess
ion
0.0 0.5 1.0 1.5 2.0 2.5
A
Gene expression over 5 days post-harvest development Figure 4
Gene expression over 5 days post-harvest development. Mean qRT-PCR (log10-transformed) measurements of gene expression of the 5 selected genes during 5 days post-harvest storage, sampling at 24 hour intervals. Vertical lines show LSD (5%, 10d.f.) for comparing means at different times, as calculated from the residual mean square obtained from the ANOVA.
Cruciform DNA-Binding Protein Cytochrome P450 II
Glucuronyl Hydrolase Β 1,6-Glucan Synthase
Riboflavin Aldehyde-Forming Enzyme
Time (days)
0 1 2 3 4 5
R
e
la
ti
ve
e
x
p
re
ssio
n
0.1 1 10 100 1000
Time (days)
0 1 2 3 4 5
R
e
la
ti
v
e
ex
pr
e
s
s
ion
0.01 0.1 1 10
Time (days)
0 1 2 3 4 5
R
e
la
ti
v
e
ex
pr
e
s
s
ion
0.01 0.1 1 10
Time (days)
0 1 2 3 4 5
Re
la
ti
v
e
ex
pre
s
si
o
n
0.01 0.1 1 10 100
Time (days)
0 1 2 3 4 5
R
e
la
ti
v
e
ex
pr
es
s
ion
showed an increased level of expression in all tissues from day 0 to 2.
Application of regression approaches to microarray
datasets (E. coli and R. norvegicus)
Regression analyses were applied to time course profiles obtained from two published microarray datasets [21,22].
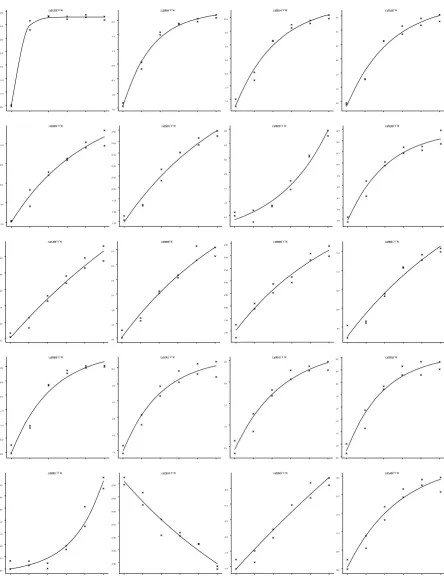
Gene responses of E. coli to treatment with paraquat [21]
were analysed by fitting an exponential function. From over 10,000 features on the microarray the profiles for
11% were described well by the exponential function, with significance levels of p < 0.05; 2% of the gene profiles fitted with significance levels of p < 0.001 (Figure 7).
The critical exponential function was fitted to the gene time-course responses in the rat liver tissue to the
corticos-teroid, methylprednisolone, [22]. The R. norvegicus
micro-array (Affymetrix GeneChips Rat Genome U34A) consisted of 7000 full length sequences and over 1000 expressed sequence tagged clusters. From over 8000 fea-tures on the microarray, the profiles for over 25% were described well by the critical exponential (p < 0.05), with over 9% with significant levels of p < 0.001 (Figure 8).
For both studies the chosen functions allow the descrip-tion of a number of distinct forms of response. The fitted responses for the 20 most significant fits from each study demonstrate the variety of profiles that can be described by each of these models (Figures 7 and 8).
Discussion
[image:8.612.55.553.110.242.2]Gene expression studies were conducted to investigate the benefit of applying statistical regression approaches to the fitting of mathematical models for the analysis of tran-scriptional data. In this study these approaches have been developed using precisely measured transcript levels for a small number of genes and application of the approaches has been further demonstrated for microarray datasets. As microarray technologies continue to be developed, the variability of gene expression data from such technologies will be reduced, leading to the widespread application of the regression modelling techniques developed in this study, thus allowing the comparative analysis of larger numbers of gene expression profiles. A range of statistical regression techniques, both linear and non-linear, are readily available. The selection of appropriate techniques is critically dependent on the specific question being addressed and the data that are collected.
Table 1: Critical exponential curve models for the transcription patterns of the 5 genes during long-term A. bisporus fruitbody post-harvest storage.
Fitted parameters Derived descriptors
A B C A+B -B/C Time of
maximum response (days)
Maximum response
CBP 1.886 -3.426 7.801 -1.540 0.439 1.814 1.753
CYP II -2.572 -1.500 7.350 -4.072 0.204 1.579 0.633
GHYD 0.348 -3.049 2.125 -2.701 1.435 2.810 0.727
GSYN -3.592 1.473 11.350 -2.119 -0.130 1.245 2.717
RAFE -0.423 -1.896 2.585 -2.319 0.733 2.108 0.344
Fitted parameters for five genes (CBP = cruciform DNA-binding protein, CYP II = cytochrome P450II, GHYD = glucuronyl hydrolase, GSYN = β (1–6) glucan synthase, and RAFE = riboflavin aldehyde-forming enzyme) with parameter R constrained to be common across all five genes (R = 0.4832 (s.e. = 0.0288)). Additional descriptors of response shape derived from the fitted parameters.
Critical exponential curve models for transcription patterns during 5 days post-harvest development
Figure 5
Critical exponential curve models for transcription patterns during 5 days post-harvest development. Sampling was conducted at 24 hour intervals. Models for log10-transformed qRT-PCR gene expression as given by Equation 1, with fitted parameters as given in Table 1. CBP (black line) = cruciform DNA-binding protein, CYPII (red line) = cytochrome P450II, GHYD (blue line) = glucuronyl hydrolase, GSYN (orange line) = β (1–6) glucan synthase, and RAFE (green line) = riboflavin aldehyde-forming enzyme.
Time (days)
0 2 4 6 8
Lo
g10
t
ra
n
sf
orm
e
d re
la
ti
ve expre
ssi
on
-6 -4 -2 0 2 4 6
CBP
[image:8.612.57.289.427.601.2]Gene expression in stipe, cap and gill tissues post-harvest Figure 6
Gene expression in stipe, cap and gill tissues post-harvest. Mean qRT-PCR (log10-transformed) measurements of gene expression of the 5 selected genes at 24 hour intervals post-harvest for 2 days, where mushrooms were dissected into stipe (N), cap (n) and gill (s) tissue. Vertical lines show LSD (5%, 16d.f.) for comparing means for different combinations of time
and tissue, as calculated from the residual mean square obtained from the ANOVA. Time (days)
0 1 2
Re
la
ti
v
e
e
x
p
re
s
s
io
n
0.1 1 10 100 1000
Time (days)
0 1 2
R
e
la
ti
v
e
expr
ess
io
n
0.01 0.1 1 10
Time (days)
0 1 2
R
e
la
ti
v
e
e
x
pr
e
ssi
on
0.001 0.01 0.1 1 10
Time (days)
0 1 2
R
e
la
ti
v
e
expr
es
si
o
n
0.01 0.1 1 10 100
Time (days)
0 1 2
R
e
lat
iv
e
e
x
pr
es
s
ion
0.001 0.01 0.1 1 10
Cruciform DNA-Binding Protein Cytochrome P450 II
Glucuronyl Hydrolase Β 1,6-Glucan Synthase
Gene expression profiles from E. coli microarray study Figure 7
Gene expression profiles from E. coli microarray study. Fitted exponential curves for the 20 best fitting profiles together with observed data. Horizontal axis is time in minutes, vertical axis is log (base 2) expression value.
Gene expression profiles from Rattus norvegicus microarray study Figure 8
Gene expression profiles from Rattus norvegicus microarray study. Fitted critical exponential curves for the 20 best fitting profiles together with observed data. Horizontal axis is time in hours, vertical axis is log (base 10) expression value.
For A. bisporus, the increases in transcript levels in the first 24 hours following harvest are largely due to transcription rather than losses due to mRNA turnover. 'Split-line or 'broken-stick' regression analysis was used to calculate the time when transcription was initiated, at 13.5 h post-har-vest for cytochrome P450II and 16.5 h post-harpost-har-vest for glucuronyl hydrolase. The novel application of this approach to transcript profiling demonstrates the poten-tial value of this simple mathematical model which has been used previously in such diverse applications as esti-mating the thresholds for patch size in ecological studies [23], humidity levels in plant pathogen germination experiments [24] and the mineral density of bones [25]. Successful application of the 'split-line' or 'broken-stick'
model for cruciform DNA-binding protein and β (1–6)
glucan synthase would require more sampling points to be made in the first 6 hours to provide sufficient time points to allow the fitting of the baseline response, zero-slope line, and hence allow estimation of the time of ini-tial transcription. For the riboflavin aldehyde-forming enzyme further data are needed beyond 24 hours (but still at 3-hour intervals) to allow estimation of the second lin-ear regression segment, and to again allow calculation of the time of initial transcription.
The time of increased transcription for at least 4 of the 5 tested genes occurs at different times in the first 24 hours post-harvest. This suggests that the response of the mush-room to harvest is not under the control of a single regu-latory pathway, such as the signal transduction pathways described for fungal oxidative and osmotic stress responses [26]. The controlling events in the mushroom are likely to be affected by a range of stimuli, such as stress, nutrient limitation, continued maturation and spore formation, which might illicit both primary or immediate responses, and secondary responses. Here we observed increased transcription first of cruciform
DNA-binding protein (approximately 3–6 h), followed by β (1–
6) glucan synthase (approximately 9 h), cytochrome P450II (13.5 h), glucuronyl hydrolase (16.5 h) and ribo-flavin aldehyde-forming enzyme (> 24 h). Cruciform
DNA-binding protein and β (1–6) glucan synthase may
be part of a primary response, while cytochrome P450II, glucuronyl hydrolase and riboflavin aldehyde-forming enzyme are from a secondary response or caused by a later stimulus.
Statistical regression modelling showed similar
expres-sion patterns for two A. bisporus genes, glucuronyl
hydro-lase and riboflavin aldehyde-forming enzyme, the latter of which is known to be up-regulated during the develop-ment of the non-harvested mushroom [20]. Further study is required to determine whether the common pattern observed between the genes post-harvest is also observed in the morphogenesis of the non-harvested fruiting body.
The pattern of β (1–6) glucan synthase gene expression
during 5 days storage was different from the other genes studied, with transcript levels falling greatly after 2 d fol-lowing an initial increase in gene expression. The gene has been hypothesised to be involved in cell wall synthesis [12]. The initial increase in gene expression coincides with the period when hyphae in the cap and stipe elongate, i.e. in the first 2 days post-harvest, a process for which cell wall synthesis is important. Similarly, the reduction in expression after day 2 coincides with the cessation of cell wall synthesis following the full extension of the cap [27,28].
The fitted critical exponential models for the 5-day pro-files of cruciform DNA-binding protein and cytochrome P450II had similar shapes, whilst the times of initial tran-scriptional increase for these two genes, as determined by split-line regressions, were markedly different (3–6 h and 13.5 h respectively). This apparent paradox illustrates the importance of considering transcript responses over a number of different time-scales. The precise function of cruciform DNA-binding protein is not known, however, it is unlikely to be involved in recombination as transcript levels are low in the gill tissue where meiosis occurs. In other organisms, proteins with similar cruciform DNA-binding activity (i.e. HMG proteins) cause the increased and decreased transcription of genes [29,30]. It is possible that the early and abundant transcription of cruciform
DNA-binding protein in A. bisporus fruiting bodies acts to
regulate the expression of other genes.
The use of a statistical non-linear regression approach to model the gene expression profiles over an extended period offers the opportunity to compare the shapes of the response curves between genes. The critical exponen-tial curve, selected by the observed response shapes and goodness of fit, can be explained in terms of the combina-tion of two processes, in this case RNA synthesis and deg-radation. A more complex model for such a situation would be the double exponential curve, which is a natural function for a two-timescale process. The critical exponen-tial is the degenerate case of this model and occurs when two processes in a system have the same timescale. In this case, however, there was no evidence for choosing the more complex model. Choice of an appropriate model can be important, but many common non-linear models are based on functional forms derived from observed bio-logical processes. Increased gene transcription is responsi-ble for the initial rapid increase in transcript levels between days 0 to 2. Transcript levels continue to rise until a maximum is reached, followed by a decline towards a steady level, possibly as a consequence of a balance between transcription and degradation (transcript turno-ver).
The critical exponential model was successful in identify-ing genes with quantitatively similar patterns of response, which could not have been predicted from their putative protein functions. This approach, therefore, offers a new method by which a large number of genes could be classi-fied according to their initial transcription regulation and subsequent turnover.
Our approach to first model and then cluster allows more genes to be considered and potentially a greater insight to understand the system. The application of this approach to a microarray dataset allows the screening of genes to identify responses that can be described by a particular mathematical function. Thus each gene profile is reduced from noisy observations to a smaller set of biologically-interpretable parameters. In the analysis of the microarray datasets, different shapes of profiles fitted by the exponen-tial or critical exponenexponen-tial functions can be identified (Fig-ures 7 &8), allowing the grouping of genes based on the parameter values. Eliminating the inherent variability in the data through the regression modelling approach allows a more precise comparison of gene profiles and
thus improved clustering. For example, the 9% of R.
nor-vegicus genes identified that followed the critical exponen-tial curve at the p < 0.001 level represents approx 720 genes compared with the 200 genes identified and
mod-elled by Jin et al (2003) [22]. The groupings of genes then
generated by the improved clustering propose hypotheses of regulatory association between genes. For example, the
aim of the E. coli microarray study was to identify those
which was demonstrated to have an exponential-type response following the application of paraquat [21]. By using an initial regression analysis to identify the subset of genes that can be described by an exponential function, subsequent cluster analyses can focus on this subset of genes with similar, but not identical (see Figure 7), shapes of expression profiles. The fitted exponential function parameters for this gene subset could then be used to bet-ter identify those genes most closely co-regulated with
soxS. Whilst our study demonstrates the application of a
regression modelling approach to describe gene expres-sion profiles, this approach can be expanded to fully exploit microarray datasets. Application of a wider range of functional forms (for example including functions with similar shapes but also some temporal variation or time delays) offers the potential to develop regulatory net-works based on relationships between the shapes of expression profiles as captured by the fitted parameters. Further interpretation of the parameters, alongside knowledge of gene function, might allow the identifica-tion of the stimuli driving the observed gene expression responses.
Compared with standard clustering for gene profiles of microarray data, the statistical regression modelling of mathematical functions to describe these profiles elimi-nates the inherent variability in the data and allows the direct comparison of profile shapes.
Conclusion
the expression of these genes. Comparison of the parame-ters and expression profiles for a set of genes could then indicate that a sub-set of these genes are co-regulated, with the potential to hypothesise a common regulatory mech-anism. Hence, consideration of a wide range of non-linear regression models could provide building blocks for the development of more biologically realistic models of gene expression profiles.
Methods
Agaricus bisporus strain A15 (Sylvan, UK) was used throughout the study. Mushrooms were grown on com-posted wheat straw according to commercial practice at the Warwick HRI BioConversion Unit. Mushrooms were harvested at morphogenetic stage 2 [31] and were either frozen immediately under liquid nitrogen, termed time 0, or stored for a specified period in a controlled environ-ment, 18°C and 95–95% relative humidity, before freez-ing under liquid nitrogen. Stored mushrooms were sampled for gene expression profiling over i) 0 to 24 hour time course post-harvest (three hourly intervals), ii) 0 to 5 day time course following harvest (24 hourly intervals), and iii) 0 to 48 hours post-harvest (24 hour intervals), with mushrooms dissected into stipe, cap and gill tissues. Three replicate mushrooms were taken for each sampling point and frozen samples were stored at -80°C.
RNA isolation
RNA was isolated from mushroom tissues according to established phenol/chloroform extraction protocols [35]. Absorbance measurement at 260 nm and 280 nm were used to assess RNA concentration and purity. RNA integ-rity was determined with formaldehyde agarose gel elec-trophoresis [36]. For experiments involving reverse transcriptase, RNA samples were treated with RQ1 RNAse-free DNAse enzyme (Promega, Southampton, UK) according to manufacturer's instructions
Quantitative RT-PCR (qRT-PCR)
Transcript levels were determined using the ABI Prism
7900 HT sequence detector (TaqMan™) and SYBR® Green
fluorescent reporter dye. Reverse transcription was carried out using the Thermoscript™ RT-PCR system (Invitrogen,
Life Technologies, Paisley, UK) in 20 μl volumes
contain-ing 50 ngμl-1 random hexamers, 1 μg total RNA, 1 μl
Ther-moscript reverse transcriptase (15 U μl-1), 4 μl 5×
Thermoscript™ buffer, 1 μl 0.1 M DTT and 1 μl
RNa-seOUT™ (40 U μl-1). Reactions were carried out at 25°C
for 10 minutes, followed by 50 minutes at 50°C and ter-minated at 85°C for 5 minutes. Each cDNA sample was treated with RNAse H according to manufacturer's
instruc-tions and diluted to 100 μl final volume. cDNA samples
were taken from three replicate mushrooms per time point.
PCR reactions were performed in 15 μl volumes
consist-ing of 1 μM of each primer, 20 ng of cDNA sample and 7.5
μl of 2× SYBR® Green PCR Mix (Applied Biosystems,
War-rington, UK). All sample and standard reactions were car-ried out in triplicate. PCR cycling conditions consisted of one cycle of 50°C for 2 min and 95°C for 10 min fol-lowed by 40 cycles 95°C 15 sec and 60°C for 1 min. This was followed by a dissociation step of 95°C for 15 sec, 60°C for 15 sec and increase to 95°C with a 2% ramp rate. The dissociation step was used for melting curve analysis in order to detect primer dimers and non-specific prod-ucts in the reaction. Standard curves were generated for
each gene using cDNA (0.625 ngμl-1 to 20 ngμl-1) from a
whole 2-day stored mushroom, which contains large amounts of target transcripts. The primer sets used (Table 2) were designed from cDNA sequence information for
each gene [12] using the Primer Express® software version
2.0 Applied Biosystems, Warrington, UK).
Data analysis utilised the ABI PRISM sequence detector®
software (SDS) (version 2.0) to determine the cycle threshold of each sample (Ct-Target) which was normal-ised to the cycle threshold of the 18S rRNA qRT-PCR
prod-uct (Ct-Control) for the same sample [37,38]. The ΔCt
equation (ΔCt = 2(CtControl-CtTarget)) was used to calculate
the amount of each target transcript relative to the amount of 18S rRNA.
The control treatments were (a) water control using steri-lised diethylpyrocarbonate (DEPC)-treated water in the place of the cDNA sample to detect environmental DNA contamination and primer-based artefacts (b) DNAse-treated RNA to assess for contaminating DNA in the RNA samples, and (c) the absence of primers during the reverse transcription step, but present during PCR, to detect con-taminating DNA and the possibility of active reverse tran-scriptase present during PCR.
Northern hybridisation analysis
Total RNA, ~10 μg, from each sample was separated by
formaldehyde agarose gel electrophoresis and immobi-lised onto nylon membranes as per established protocols [35]. Hybridisation was carried out using randomly
primed [α-32P]dCTP probes and post-hybridisation
washes carried out using established protocols [35]. To produce the probes, phagemid clones containing the
cDNAs were restricted with HindIII and BamHI and
frag-ments separated by agarose gel electrophoresis, excised and purified using the Qiagen gel purification protocol. Purified fragments were used as templates for random
priming incorporating [α-32P]dCTP (Rediprime kit,
Amer-sham Pharmacia Biotech., Buckinghamshire, UK).
determined using scanning densitometry (Personal Den-sitometer SI, Molecular Dynamics, CA, USA). Transcript levels for each gene were calculated relative to the hybrid-isation intensity recorded for the 28S rRNA gene probe for each sample tested. Northern analysis was performed on total RNA from two replicate mushrooms per time sample or time × tissue sample for transcripts of each gene exam-ined.
Statistical analysis
Comparisons of the transcript levels, as determined by Northern analysis scanning densitometry and qRT-PCR, were made for each gene by calculating correlation coeffi-cients, and by fitting linear and exponential regression responses to explain the Northern analysis measurements in terms of those from the qRT-PCR. Within each experi-ment, two replicate Northern analysis measurements were paired with the qRT-PCR values obtained from the same replicate mushroom RNA extracts (note that for one repli-cate of each sampling point within each experiment no Northern analysis measurement was obtained).
Quantitative RT-PCR data of transcription levels for each gene were analysed using analysis of variance (ANOVA) for each experiment (0–24 h, 0–5d and 0–48 h between different tissues) separately. Three replicate mushrooms were assayed at each time or for each tissue-by-time com-bination. Prior to analysis, the data were subjected to a logarithm (base 10) transformation to satisfy the ANOVA assumption of homogeneity of variance. The significance of the overall treatment effects (time only in two experi-ments, time, tissue and the interaction between these
fac-significance of differences between individual treatment means was assessed by comparison with appropriate standard errors of differences (SEDs). Treatment differ-ences noted in the text are significant at the 5% level unless stated otherwise.
For the qRT-PCR data only, regression analyses were used to model the gene expression changes over time. 'Split-line' or 'broken-stick' regression analysis of transcription levels from 0–24 h was applied to estimate the time when the up-regulation of each gene commenced. The 'broken-stick' model consists of two linear regression segments fit-ted to distinct subsets of the data, with separate estimates of slope and intercept for each segment. In this case the first line segment was constrained to have a slope of zero. A sequence of models was fitted to the data for each gene,
splitting the data set into two parts (time ≤x hours: time
> x hours, for each of the observed values of x). The best
model for each gene was chosen as the one with the min-imum sum of residual sums of squares for the two regres-sions. The time point where the two lines crossed was postulated as the time when increased gene transcription began.
The long-term gene transcript profiles (0–5d) were mod-elled using the critical exponential curve (Equation 1),
fit-ted to the log10-transformed data.
y(t) = A + (B + Ct)Rt + ε (Equation 1)
where A, B, C and R are parameters, y is the gene
[image:15.612.55.559.99.322.2]expres-sion response (log10 transformed), t is storage time, and ε
Table 2: Oligonucleotides used in the qPCR for the selected Agaricus bisporus genes
Gene Oligonucleotide Amplicon
length (bp)
Cruciform DNA-binding protein Forward: 5'-CGCTGGTGAAGCTGAGAACA-3' 74 Reverse: 5'- CAGCGATTTGGTCCGTCATA-3'
Cytochrome P450II Forward: 5'-GCCGATATTTTGCTCTGAATGC-3' 75 Reverse: 5'- GCGCAGGCTTGATATCGAA-3'
β(1–6) Glucan synthase Forward: 5'-TCAATCTTCTTGATGCTCATTGC-3' 70 Reverse: 5'- TGCGCAAACAACCTATTCC-3'
Glucuronyl hydrolase Forward: 5'-TGATGGAATTGTACCATGGGATT-3' 74 Reverse: 5'- AGCGATAGTTGCTGCTGAAGAA-3'
Riboflavin aldehyde-forming enzyme Forward: 5'-CGGCAGCGGAGACCATT-3' 65 Reverse: 5'- TGACTTTCACGTATTTGCTTTGT-3'
18S rRNA Forward: 5'-ACAACGAGACCTTAACCTGCTAA-3' 78
bution with mean zero and a constant variance. This form of curve was selected following an initial graphing of the responses, as it can be used to describe a rapidly increasing phase followed by a decline or plateau, and after assess-ment of how well it fitted the observed data compared with both the simpler exponential model and the more complex double exponential model. The parameters of this non-linear response can be interpreted in terms of a postulated mechanism driving the observed gene expres-sion responses, in this case potentially quantifying the relationship between transcript synthesis and degrada-tion. The fitted parameters, and hence the shapes of the fitted curves, were compared between genes using a paral-lel curves analysis, either constraining each parameter to be the same across all five genes, or allowing variation in the values taken by each parameter between genes. This analysis provides a basis for comparing a sequence of pos-sible models, and assessment of the change in residual variance between models allows the most appropriate model for the observed data to be determined.
Application of regression modelling to microarray datasets The regression modelling approach was applied to pub-licly-available microarray datasets from different
organ-isms (E. coli and R. norvegicus), previously published
[21,22]. The datasets were selected as having an appropri-ate time course with a fixed time point at which a treat-ment was applied generating an expression response, with evidence that gene profiles could be described by a
stand-ard response function. For the E. coli study [21] the master
regulatory gene soxS demonstrated an exponential-type
response to the application of paraquat. To identify all genes with a similar exponential shape of response, an exponential function was fitted using the regression mod-elling approach to all gene expression profiles from this microarray study, and the significance of each fit was
determined. Similarly, a number of genes from R.
norvegi-cus liver tissue treated with corticosteroid displayed
pro-files appearing to follow the same critical exponential
curve as fitted to the A. bisporus data (Equation 1) [22].
The critical exponential function was thus fitted to all genes in this dataset to determine the proportion of gene profiles that were adequately described by this function.
Authors' contributions
DCE participated in the design of the study, prepared all samples, carried out molecular genetic studies and drafted the manuscript. AM carried out statistical analysis and helped draft the manuscript. MJS participated in the design of the study and aided in molecular genetic studies. KSB conceived of the study, participated in its design and helped to draft the manuscript.
Additional material
Acknowledgements
Funding was provided by the UK Government Department for Food and Rural Affairs (DEFRA) project HH2116SMU.
References
1. Dopazo J, Zanders E, Dragoni I, Amphlett G, Falciani F: Methods and approaches in the analysis of gene expression data. J Immunol Methods 2001, 250(1–2):93-112.
2. Tamames J, Clark D, Herrero J, Dopazo J, Blaschke C, Fernandez JM, Oliveros JC, Valencia A: Bioinformatics methods for the analy-sis of expression arrays: data clustering and information extraction. J Biotechnol 2002, 98:269-283.
3. Reimers M: Statistical analysis of microarray data. Addict Biol 2005, 10:23-35.
4. Tai YC, Speed TP: A multivariate empirical Bayes statistic for replicated microarray time course data. Ann Stat 2006,
34(6):2387-2412.
5. Manfield IW, Jen CH, Pinney JW, Michalopoulos I, Bradford JR, Gil-martin PM, Westhead DR: Arabidopsis Co-expression Tool (ACT): web server tools for microarray-based gene expres-sion analysis. Nucleic Acids Res 2006, 34:504-509.
6. Persson S, Wei H, Milne J, Page GR, Somerville CR: Identification of genes required for cellulose synthesis by regression
analy-Additional file 1
Northern hybridizations for all five genes in each experiment. (A) 0– 24 hr experiment, (B) 0–5 day experiment, (C) tissues over 2 day exper-iment. 28S rRNA = loading control, CBP = cruciform DNA-binding pro-tein, CYP II = cytochrome P450II, GHYD = glucuronyl hydrolase, GSYN = β (1–6) glucan synthase, and RAFE = riboflavin aldehyde-forming enzyme
Click here for file
[http://www.biomedcentral.com/content/supplementary/1471-2199-9-66-S1.doc]
Additional file 2
Comparison of gene expression responses measured using Northern analysis and qRT-PCR: correlation coefficient. Summary of linear regression and exponential regression fits (larger values indicate a better fit), and minimum and maximum values of gene expression as measured by qRT-PCR. (CBP = cruciform DNA-binding protein, CYP II = cyto-chrome P450II, GHYD = glucuronyl hydrolase, GSYN = β (1–6) glucan synthase, and RAFE = riboflavin aldehyde-forming enzyme).
Click here for file
[http://www.biomedcentral.com/content/supplementary/1471-2199-9-66-S2.doc]
Additional file 3
Relationships between Northern analysis response and qRT-PCR measurements. Exponential regression curve showing the relationship between the Northern analysis response (y axis) and the qRT-PCR response (x axis) for all five genes and all three experiments. Column 1 is for the 0–24 hr experiment, column 2 is for the 0–5 day experiment, col-umn 3 is for the tissues over 2 day experiment. Each row is for a different gene: CBP = cruciform DNA-binding protein, CYP II = cytochrome P450II, GHYD = glucuronyl hydrolase, GSYN = β (1–6) glucan syn-thase, and RAFE = riboflavin aldehyde-forming enzyme
Click here for file
Publish with BioMed Central and every scientist can read your work free of charge "BioMed Central will be the most significant development for disseminating the results of biomedical researc h in our lifetime."
Sir Paul Nurse, Cancer Research UK
Your research papers will be:
available free of charge to the entire biomedical community
peer reviewed and published immediately upon acceptance
cited in PubMed and archived on PubMed Central
yours — you keep the copyright sis of public microarray data sets. Proc Natl Acad Sci USA 2005,
102(24):8633-8638.
7. Conesa A, Neuda MJ, Ferrer A, Talön M: maSigPro: A method to identify significantly differential expression profiles in time-course microarray experiments. Bioinformatics 2006,
22(9):1096-1102.
8. Heard NA, Holmes CC, Stephens DA: A quantitative study of gene regulation involved in the immune response of Anopheline mosquitoes: An application of Bayesian hierar-chical clustering of curves. J Am Stat Assoc 2006, 101(473):18-29. 9. Kahnin R, Vinciotti V, Mersinias V, Smith CP, Wit P: Statistical reconstruction of transcription factor activity using Michae-lis-Menten kinetics. Biometrics 2007, 63(3):816-823.
10. Nachman I, Regev A, Friedman N: Inferring quantitative models of regulatory networks from expression data. Bioinformatics 2004, 20(suppl 1):i248-i256.
11. Liss B: Improved quantitative real-time RT-PCR for expres-sion profiling of individual cells. Nucleic Acids Res 2002,
30(17):89-98.
12. Eastwood DC, Kingsnorth CS, Jones HJ, Burton KS: Genes with increased transcript levels following harvest of the sporo-phore of Agaricus bisporus have multiple physiological roles. Mycol Res 2001, 105(10):1223-123.
13. Kingsnorth CS, Eastwood DC, Burton KS: Cloning and post-har-vest expression of serine proteinase transcripts in the culti-vated mushroom Agaricus bisporus. Fungal Gen Biol 2001,
32:135-144.
14. Wagemaker MJM, Eastwood DC, Wellboren W, Burton KS, Drift C Van Der, Jetten MSM, Van Griensven LJLD, Op Den Camp HJM:
Argininosuccinate synthetase and argininosuccinate lyase: two ornithine cycle enzymes from Agaricus bisporus. Mycol Res 2007, 111:493-502.
15. Miyazaki Y, Nakamura M, Babasaki K: Molecular cloning of devel-opmentally specific genes by representational difference analysis during fruiting body formation in the basidiomycete Lentinula edodes. Fungal Gen Biol 2005, 42:493-505.
16. Lee S-H, Kim B-G, Kim K-J, Lee J-S, Yun D-W, Hahn J-H, Kim G-H, Lee K-H, Suh D-S, Kwon S-T, Lee C-S, Yoo Y-B: Comparative analysis of sequences expressed during liquid-cultured myc-elia and fruit body stages of Pleurotus ostreatus. Fungal Gen Biol 2002, 35:115-134.
17. Yamada M, Sakuraba S, Shibata K, Taguchi G, Inatomi S, Okazaki M, Shimosaka M: Isolation and analysis of genes specifically expressed during fruiting body development in the basidio-mycete Flammulina velutipes by fluorescence differential dis-play. FEMS Microbiol Lett 2006, 254:165-172.
18. Kues U: Life history and developmental processes in the basidiomycete Coprinus cinereus. Microbiol Mol Biol Rev 2000,
64(2):316-353.
19. Kamada T: Molecular genetics of sexual development in the mushroom Coprinus cinereus. BioEssays 2002, 24:449-459. 20. Sreenivasaprasad S, Eastwood DC, Browning N, Lewis SMJ, Burton
KS: Differential expression of a putative riboflavin-aldehyde-forming enzyme (raf) gene during development and post-harvest storage and in different tissue of the sporophore in Agaricus bisporus. Appl Microbiol Biotechnol 2006, 70:470-476. 21. Blanchard JL, Wholey W-Y, Conlon EM, Pomposiello PJ: Rapid
changes in gene expression dynamics in response to super-oxide reveal SoxRS-dependent and independent transcrip-tional networks. PLoS ONE 2007, 2(11):e1186.
22. Jin JY, Almon RR, Dubois DC, Jusko J: Modelling of corticosteroid pharmacogenomics in rat liver using gene microarrays. J Pharmacol Exp Ther 2003, 307:93-109.
23. Bascampte J, Rodriguez MA: Habitat patchiness and plant spe-cies richness. Ecol Lett 2001, 4:417-420.
24. Carroll JE, Wilcox WF: Effects of humidity on the development of grapevine powdery mildew. Phytopathology 2003,
93:1137-1144.
25. Price RI, Walters MJ, Retallack RW, Henderson NK, Kerr D, Henzell S, Dhaliwal S, Prince RL: Impact of the analysis of a bone density reference range on determination of the T-score. J Clin Densi-tom 2003, 6(1):51-62.
26. Ikner A, Shiozaki K: Yeast signalling pathways in oxidative stress response. Mutat Res-Fund Mol Mech Mutagen 2005, 569(1– 2):13-27.
27. Umar MH, van Griensven LJLD: Morphological studies on the life span, development stages, senescence and death of fruiting bodies of Agaricus bisporus. Mycol Res 1997, 101:1409-1422. 28. Braaksma A, van Doorn AA, Kieft H, van Aelist AC: Morphometric
analysis of ageing mushrooms (Agaricus bisporus) during post-harvest development. Postharvest Biol Technol 1998,
13:71-79.
29. Ge H, Roeder RG: The high-mobility group protein HMG1 can reversibly inhibit class-II gene-transcription by interaction with the TATA-binding protein. J Biol Chem 1994,
269(25):17136-17140.
30. Stros M, Ozaki T, Bacikova A, Kageyama H, Nakagawara A: HMGB1 and HMGB2 cell-specifically down-regulate the p53-and p-73-dependant sequence-specific transactivation from the human Bax gene promoter. J Biol Chem 2002, 277(9):7157-7164. 31. Hammond JBW, Nichols R: Changes in respiration and carbohy-drates during the post-harvest storage of mushrooms ( Agar-icus bisporus). J Sci Food Agric 1975, 26:835-842.
32. Stekel D: Microarray Bioinformatics Cambridge University Press, Cam-bridge, UK; 2003.
33. Rangel C, Angus J, Ghahramani Z, Lioumi M, Sotheran E, Gaiba A, Wild DL, Falciani F: Modelling T-cell activation using gene expression profiling and state-space models. Bioinformatics 2004, 20(9):1361-1372.
34. Beal MJ, Falciani F, Ghahramani Z, Rangel C, Wild DL: A Bayesian approach to reconstructing genetic regulatory networks with hiddenfactors. Bioinformatics 2005, 21(3):349-356. 35. Sambrook J, Russell DW: Molecular cloning: a laboratory manual 3rd
edition. Cold Spring Harbor Laboratory Press, Cold Spring Harbor, NY; 2001.
36. Rosen KM, Villa-Komaroff L: An alternative method for the vis-ualization of RNA in formaldehyde agarose gels. Focus 1993,
12(2):23-24.
37. Goidin D, Mamessier A, Statquet M.-J, Schmitt D, Berthier-Vergnes O: Ribosomal 18S RNA prevails over Glyceraldehyde-3-phosphate dehydrogenase and β-actin genes as internal standards for quantitative comparison of mRNA levels in invasive and noninvasive human melanoma cell subpopula-tions. Anal Biochem 2000, 295(1):17-21.
38. Lekanne Deprez RH, Fijnvandraat AC, Ruijter JM, Moorman AFM:
Sensitivity and accuracy of quantitative real-time polymer-ase chain reaction using SYBR green I depends on cDNA syn-thesis conditions. Anal Biochem 2002, 307(1):63-69.