This document is confidential and is proprietary to the American Chemical Society and its authors. Do not copy or disclose without written permission. If you have received this item in error, notify the sender and delete all copies.
A transcription factor-based biosensor for detection of itaconic acid
Journal: ACS Synthetic Biology
Manuscript ID sb-2018-000576.R2
Manuscript Type: Article
Date Submitted by the Author: n/a
Complete List of Authors: Hanko, Erik; University of Nottingham
Minton, Nigel; University of Nottingham, Synthetic Biology Research Centre Malys, Naglis; University of Nottingham, School of Life Sciences
A r a b in o s e c o n c e n t r a t i o n
R on
a
te
n
rfp itcR
ItcR RFP Pccl
ACS Paragon Plus Environment
A transcription factor-based biosensor for detection of itaconic acid
12
Erik K. R. Hanko1, Nigel P. Minton1 and Naglis Malys1*
3
4
1
BBSRC/EPSRC Synthetic Biology Research Centre (SBRC), School of Life Sciences, Centre for 5
Biomolecular Sciences, The University of Nottingham, Nottingham, NG7 2RD, United Kingdom 6
7
*Author to whom correspondence should be addressed; E-Mail: [email protected] 8
9
Abstract
1
Itaconic acid is an important platform chemical that can easily be incorporated into polymers and 2
has the potential to replace petrochemical-based acrylic or methacrylic acid. A number of 3
microorganisms have been developed for the biosynthesis of itaconate including Aspergillus terreus,
4
Escherichia coli and Saccharomyces cerevisiae. However, the number of strains and conditions that 5
can be tested for increased itaconate titers are currently limited due to the lack of high-throughput 6
screening methods. Here we identified itaconate-inducible promoters and their corresponding LysR-7
type transcriptional regulators from Yersinia pseudotuberculosis and Pseudomonas aeruginosa. We
8
show that the YpItcR/Pccl inducible system is highly inducible by itaconic acid in the model
9
gammaproteobacterium E. coli and the betaproteobacterium Cupriavidus necator (215- and
105-10
fold, respectively). The kinetics and dynamics of the YpItcR/Pccl inducible system are investigated and
11
we demonstrate, that in addition to itaconate, the genetically encoded biosensor is capable of 12
detecting mesaconate, cis-, and trans-aconitate in a dose-dependent manner. Moreover, the
13
fluorescence-based biosensor is applied in E. coli to identify the optimum expression level of cadA,
14
the product of which catalyzes the conversion of cis-aconitate into itaconate. The fluorescence
15
output is shown to correlate well with itaconate concentrations quantified using high-performance 16
liquid chromatography coupled with ultraviolet spectroscopy. This work highlights the potential of 17
the YpItcR/Pccl inducible system to be applied as biosensor for high-throughput microbial strain
18
development to facilitate improved itaconate biosynthesis. 19
Keywords: itaconic acid, inducible gene expression, fluorescence-based biosensor, Yersinia
20
pseudotuberculosis, Pseudomonas aeruginosa, macrophage infection 21
22
The use of biological processes for the production of chemicals and fuels is a promising alternative to 1
the traditional approach of chemical manufacture.1 They offer the opportunity to convert renewable
2
or waste feedstocks into higher value compounds of industrial interest.2 Although many biological
3
processes have the potential to replace synthetic chemistry, product titers and productivity often 4
remain to be optimized in order to achieve economically competitive conversion rates.1, 3 To
5
facilitate and expedite the implementation of biocatalysts with improved performance, low-cost and 6
high-throughput microbial engineering strategies need to be developed. 7
Itaconic acid is an attractive platform chemical with a wide range of industrial applications, 8
such as in rubber, detergents, or surface active agents.4 In 2004, it was reported by the US
9
Department of Energy to be one of the top twelve building block chemicals from biomass.5 The
C5-10
dicarboxylic acid can be converted into poly(acrylamide-co-itaconic acid) which is used as a
11
superabsorbent for aqueous solutions, or poly(methyl methacrylate), also known as Plexiglas.6
12
Itaconate is a naturally occurring metabolite formed by decarboxylation of aconitate, an 13
intermediate of the citric acid cycle. A number of microorganisms, including Aspergillus terreus,7
14
Ustilago maydis (also known as U. zeae)8 and Candida sp.,9 have been described as natural producers 15
of itaconic acid. It is also produced as an antimicrobial compound by macrophages, mammalian 16
immune cells.10, 11 In A. terreus and macrophages, itaconate is synthesized from the tricarboxylic acid
17
cycle intermediate cis-aconitate through the action of a cis-aconitate decarboxylase (CadA). In
18
contrast, in U. maydis it is produced via the unusual intermediate trans-aconitate.12 Heterologous
19
expression of the A. terreuscadA gene has demonstrated that the biosynthesis of itaconic acid can
20
be achieved in different host organisms than the natural producer.13 So far, the highest titer of
21
biotechnologically produced itaconate has been obtained by fermentation of A. terreus.14-16
22
However, due to feedback inhibition of itaconate biosynthesis at higher concentrations,17
23
considerable research efforts have been directed towards developing alternative microbial 24
biocatalysts. Other microorganisms that have been investigated for the biosynthesis of itaconic acid 25
include Pseudozyma antarctica, Corynebacterium glutamicum, Escherichia coli, Saccharomyces
26
cerevisiae, Yarrowia lipolytica and species of Candida and Ustilago.9, 18-24 Although some of these 1
microorganisms exhibit beneficial traits, such as a high tolerance to itaconate and a low pH,19, 22
2
production titers need to be considerably improved. 3
Genetically encoded biosensors have gained increasing interest as molecular tools enabling 4
high-throughput strain development.25 They are composed of transcription-based inducible gene
5
expression systems linked to a reporter or an antibiotic resistance gene.26, 27 By using a fluorescent
6
reporter gene, changes in intracellular metabolite concentrations can easily be monitored by a 7
fluorescence output enabling the screen of millions of single-cells in a rapid manner.25 Biosensors
8
have been successfully applied to increase products titers of platform chemicals such as acrylate, 3-9
hydroxypropionate (3-HP) and glucarate.26, 28 To date, no itaconate biosensor has been developed
10
which could facilitate the screening process for both metabolically engineered strains and 11
alternative feedstocks, such as biomass hydrolysates, to improve yields and decrease production 12
costs.29 13
This study was aimed to identify an itaconate-inducible gene expression system and 14
construct a fluorescence-based biosensor. Several natural compounds were screened for biosensor 15
induction and induction kinetics measured. Moreover, the developed biosensor was exploited in the 16
optimization of itaconate production in E. coli and its output compared to analytically determined
17
itaconate titers. 18
19
Results and Discussion
1
Identification of an itaconic acid-inducible system
2
To build an itaconate biosensor, which can be applied across different species, both elements of a 3
transcription-based inducible system, a transcriptional regulator (TR) and the corresponding 4
inducible promoter, are needed. Bacterial degradation pathways, which are often activated 5
exclusively in the presence of the compound to be degraded, represent a rich source of inducible 6
promoters. Even though the pathway for itaconate catabolism had been known for more than 50 7
years,30 and a few bacteria including Pseudomonas spp., Salmonella spp., and Micrococcus sp. have
8
been shown to possess enzymatic activities for itaconate degradation,31 the genes encoding these
9
enzymes have only recently been identified in Yersinia pestis and Pseudomonas aeruginosa.32 The
10
pathway comprises three enzymatic reactions (Figure 1A). The first reaction is catalyzed by itaconate 11
CoA transferase (Ict) which converts itaconate to itaconyl-CoA. The CoA ester is subsequently 12
hydrated to (S)-citramalyl-CoA by itaconyl-CoA hydratase (Ich) which is then cleaved into acetyl-CoA
13
and pyruvate by (S)-citramalyl-CoA lyase (Ccl). The production of the Ict and Ich homologs (RipA and
14
RipB, respectively) by Salmonella enterica was shown to be strongly induced after macrophage
15
infection.33 The upregulation of ripA and ripB was suggested by Sasikaran and coworkers to result
16
from macrophagic itaconate secretion as part of the defence mechanism against pathogenic 17
bacteria.32, 34 Most likely, the promoters of the gene clusters encoding the enzymes for itaconate
18
catabolism in Y. pestis and P. aeruginosa harbor regulatory elements required for transcription of
19
these genes in the presence of itaconate. Interestingly, a gene encoding a LysR-type transcriptional 20
regulator (LTTR, here termed ItcR) is located in the opposite direction of both the Y. pestisccl-ich-ict
21
operon (also referred to as ripABC operon) and the P. aeruginosa putative six-gene operon encoding
22
Ich, Ict, Ccl, and three other proteins (Figure 1B). The genes coding for LTTRs are occasionally 23
transcribed in divergent orientation with respect to the cluster of genes they regulate,35 which led to
24
the hypothesis that transcription of the Y. pestis and P. aeruginosa itaconate degradation pathway
25
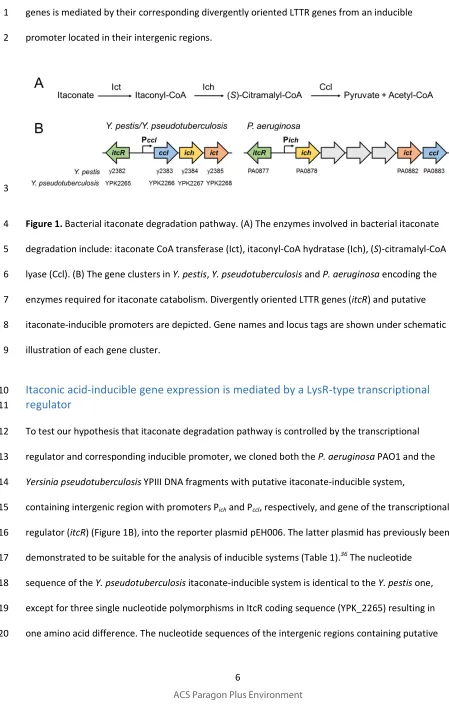
genes is mediated by their corresponding divergently oriented LTTR genes from an inducible 1
promoter located in their intergenic regions. 2
[image:8.612.68.517.62.766.2]3
Figure 1. Bacterial itaconate degradation pathway. (A) The enzymes involved in bacterial itaconate 4
degradation include: itaconate CoA transferase (Ict), itaconyl-CoA hydratase (Ich), (S)-citramalyl-CoA
5
lyase (Ccl). (B) The gene clusters in Y. pestis, Y. pseudotuberculosis and P. aeruginosa encoding the
6
enzymes required for itaconate catabolism. Divergently oriented LTTR genes (itcR) and putative
7
itaconate-inducible promoters are depicted. Gene names and locus tags are shown under schematic 8
illustration of each gene cluster. 9
Itaconic acid-inducible gene expression is mediated by a LysR-type transcriptional
10
regulator
11
To test our hypothesis that itaconate degradation pathway is controlled by the transcriptional 12
regulator and corresponding inducible promoter, we cloned both the P. aeruginosa PAO1 and the
13
Yersinia pseudotuberculosis YPIII DNA fragments with putative itaconate-inducible system, 14
containing intergenic region with promoters Pich and Pccl, respectively, and gene of the transcriptional
15
regulator (itcR) (Figure 1B), into the reporter plasmid pEH006. The latter plasmid has previously been
16
demonstrated to be suitable for the analysis of inducible systems (Table 1).36 The nucleotide
17
sequence of the Y. pseudotuberculosis itaconate-inducible system is identical to the Y. pestis one,
18
except for three single nucleotide polymorphisms in ItcR coding sequence (YPK_2265) resulting in 19
one amino acid difference. The nucleotide sequences of the intergenic regions containing putative 20
itaconate-inducible promoters are provided in Figure S1. To investigate the potential applicability of 1
the two putative itaconate-inducible systems across different species, red fluorescent protein (RFP) 2
reporter gene expression in response to itaconate was measured by fluorescence output in the 3
model gammaproteobacterium E. coli MG1655 and the betaproteobacterium Cupriavidus necator
4
H16. The latter is a model chemolithoautotroph with the ability to produce energy and chemicals 5
from carbon dioxide and is therefore of interest in biotechnological applications. Single time point 6
fluorescence measurements for E. coli and C. necator harboring the putative itaconate-inducible
7
systems, composed of transcriptional regulator and inducible promoter (ItcR/P), were performed in 8
the absence and presence of itaconate (Figure 2). In both microorganisms, reporter gene expression 9
from the Y. pseudotuberculosis (Yp) inducible system (pEH086) is induced significantly (p<0.01) six
10
hours after supplementation with 5 mM itaconate (215-fold in E. coli and 105-fold in C. necator,
11
Figure 2A and 2B, respectively). In contrast, the P. aeruginosa (Pa) inducible system PaItcR/Pich
12
(pEH177) does not mediate reporter gene expression in response to itaconate in E. coli, whereas in
13
C. necator it demonstrates an 18.5-fold induction. In comparison, in E. coli MG1655, the level of 14
induction mediated by the Y. pseudotuberculosis itaconate-inducible system is considerably higher
15
than the commonly used L-arabinose-inducible system which is subject to catabolite repression. A 16
culture of E. coli MG1655 harboring pEH006 demonstrated a 39-fold increase in RFP expression six
17
hours after addition of L-arabinose to a final concentration of 0.1% (w/v) in minimal medium. 18
[image:9.612.86.523.579.723.2]19
Table 1. Plasmids used and generated in this study. 20
Plasmid Characteristic Reference or source
pBBR1MCS-2-PphaC-eyfp-c1 Kanr; broad host range vector used to
amplify the origin of replication
37
pEH006 Cmr; modular vector for the evaluation of
inducible systems; ParaC-araC-TrrnB1 and
ParaBAD-T7sl-EcRBS-rfp-Tdbl
36
pEH006E Cmr; promoterless pEH006 36
pEH086 Cmr; PitcR-itcR-TrrnB1 and Pccl-rfp-Tdbl from Y.
pseudotuberculosis YPIII genomic DNA
This study
pEH164 Cmr; ParaC-araC-Tdbl, ParaBAD-T7sl-Ec
RBS-TrrnB2, YpPitcR-YpitcR-TrrnB1 and YpPccl-rfp
-This study
Tdbl
pEH165 Cmr; ParaC-araC-Tdbl, ParaBAD-T7sl-Ec
RBS-cadA-TrrnB2, YpPitcR-YpitcR-TrrnB1 and YpPccl -rfp-Tdbl
This study
pEH172 Cmr; P
ccl-rfp-Tdbl from Y.
pseudotuberculosis YPIII genomic DNA
This study
pEH177 Cmr; PitcR-itcR-TrrnB1 and Pich-rfp-Tdbl from
P. aeruginosa PAO1 genomic DNA
This study
pEH178 Cmr; Pich-rfp-Tdbl from P. aeruginosa PAO1
genomic DNA
This study
1
2
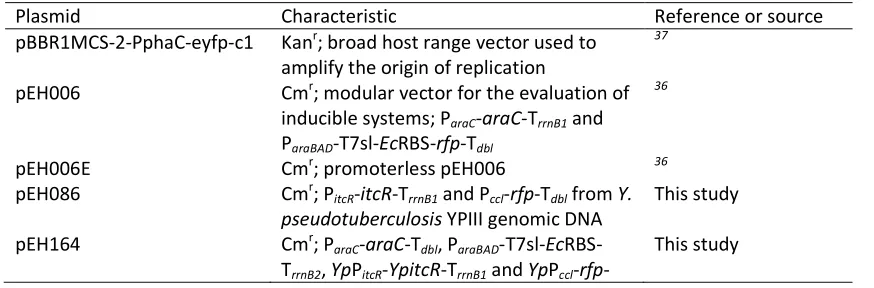
[image:10.612.64.516.67.773.2]3
Figure 2. Influence of ItcR on inducible gene expression. Absolute normalized fluorescence (in 4
arbitrary units) of (A) E. coli MG1655 and (B) C. necator H16 harboring the Y. pseudotuberculosis (Yp)
5
and P. aeruginosa (Pa) itaconate-inducible systems composed of promoter and transcriptional 6
regulator (ItcR/P), and promoter-only (P) implementation in the absence and presence of 5 mM 7
itaconate. Single time point fluorescence measurements were taken six hours after inducer addition. 8
The promoterless reporter plasmid pEH006E was employed as negative control. Error bars represent 9
standard deviations of three biological replicates. Asterisks indicate statistically significant induction 10
values for p<0.01 (unpaired t test).
11
12
To confirm that itaconate-inducible reporter gene expression is indeed controlled by the 13
episomally encoded ItcR, their coding sequences were removed from the vectors containing 14
YpItcR/Pccl and PaItcR/Pich. Single time point fluorescence measurements were repeated for E. coli
15
and C. necator solely harboring the itaconate-inducible promoters in the absence and presence of 16
itaconate (Figure 2). Without YpItcR, induction of reporter gene expression from the Y.
1
pseudotuberculosis itaconate-inducible promoter (YpPccl, pEH172) is abolished in both
2
microorganisms. This confirms that transcription of the Y. pseudotuberculosis itaconate degradation
3
pathway genes is mediated by their divergently oriented itcR gene and that neither of the two tested
4
microorganisms encodes cross-activating TR homologs. In E. coli, the level of normalized
5
fluorescence from PaPich (pEH178) and PaItcR/Pich (pEH177) is higher than the negative control,
6
indicating that the promoter itself is active. However, the normalized fluorescence levels are of 7
equal height, suggesting that the TR might not be produced or able to interact with its cognate 8
operator sequence to activate gene expression in the presence of the effector. Interestingly, in C.
9
necator, even though the coding sequence of PaItcR was removed from the plasmid, reporter gene 10
expression from PaPich (pEH178) is induced significantly (p<0.01) after addition of itaconate. A PaItcR
11
homology search in C. necator revealed the presence of several chromosomally encoded LTTRs
12
exhibiting 40-50% protein sequence identity (96-98% coverage). One of the LTTR genes is located 13
within close proximity to the cluster that includes genes potentially involved in itaconate 14
degradation similar to P. aeruginosa (Figure S2). C. necator ItcR homologs can potentially activate
15
gene expression from the heterologous P. aeruginosa itaconate-inducible promoter even in the
16
absence of its corresponding LTTR. However, since both the induction level, and the absolute 17
normalized fluorescence in the presence of itaconate, are higher in the plasmid carrying PaItcR/Pich
18
(pEH177) than the one carrying PaPich (pEH178) alone (by 3.5- and 52-fold, respectively), it can be
19
concluded that PaItcR is involved in activation of gene expression of the itaconate degradation
20
cluster of genes in P. aeruginosa and therefore enables persistence in macrophages. The finding that
21
expression of the genes encoding enzymes involved in itaconate catabolism is mediated by their 22
divergently oriented LTTR genes may aid in developing new antimicrobial agents. 23
Sensor characterization
1
Due to its functionality in both tested microorganisms, regulator-dependent orthogonality and high 2
level of induction, the itaconate-inducible system from Y. pseudotuberculosis was selected to be
3
further characterized. The sensor was evaluated for its kinetics – the time that is required for the 4
system to respond to a change in itaconate levels; dynamics – the range of inducer concentration 5
that mediates a linear fluorescence output; and inducer-dependent orthogonality – the specificity 6
towards itaconate. 7
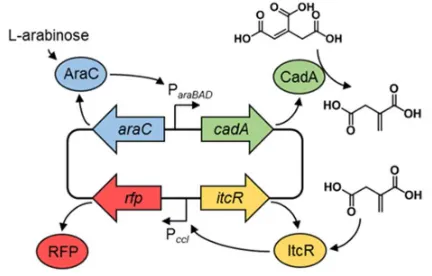
E. coli MG1655 was transformed with the plasmid harboring the YpItcR/Pccl inducible system
8
(pEH086), cultivated in M9 minimal medium, and fluorescence output was monitored over time 9
after supplementation with different concentrations of itaconate. As can be seen from the 10
fluorescence curve of induction kinetics, reporter gene expression is activated immediately after 11
inducer addition, taking into account the time that is required for RFP maturation (Figure 3A).38 This
12
immediate response suggests, that the system is solely controlled by ItcR and that it is not affected 13
by host-originating TRs. Furthermore, it suggests that itaconate is a primary inducing molecule, 14
which starts instantly to be uptaken by or diffused into the E. coli cells in minimal medium. It should
15
be noted that the growth was similar for all itaconate concentrations tested. 16
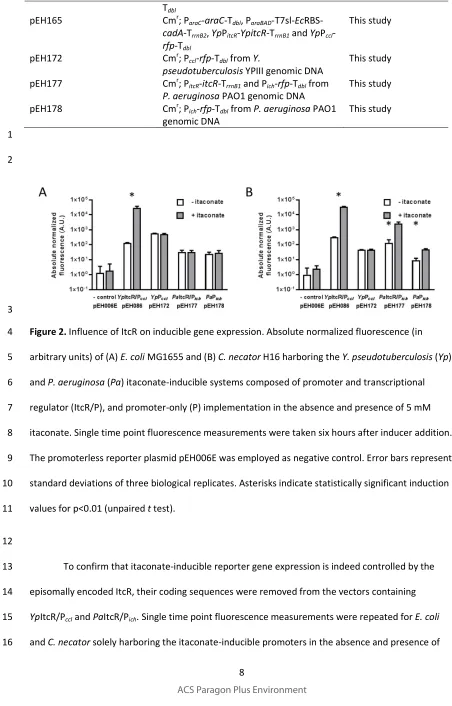
[image:12.612.61.508.60.729.2]17
Figure 3. Kinetics and dynamics of the YpItcR/Pccl inducible system. (A) Absolute normalized
18
fluorescence of E. coli MG1655 harboring the YpItcR/Pccl inducible system (pEH086) in response to
19
different concentrations of itaconate added at time zero. The standard deviation of three biological 20
replicates is shown as lighter colour ribbon displayed lengthwise the induction kinetics curve. For the 21
lower concentrations, the standard deviation is too small to be visible. (B) Dose response curve of 1
the YpItcR/Pccl inducible system in E. coli MG1655, illustrating the correlation between inducer
2
concentration and fluorescence output four and eight hours post induction (hpi) with itaconate. 3
Error bars represent standard deviations of three biological replicates. 4
5
The correlation between extracellular inducer concentration and fluorescence output, four 6
and eight hours after itaconate supplementation, is illustrated in the dose response curve (Figure 7
3B). It indicates that gene expression can be tuned in the range of approximately 0.07 to 0.7 mM for 8
a linear fluorescence output. The minimum concentration of exogenously added itaconate required 9
for activation of the system is approximately 0.016 mM. The dose response curve indicates a 10
saturation of the YpItcR/Pccl inducible system for itaconate levels above 2.5 mM. However, in order
11
for this system to be applied as biosensor for concentrations of more than 2.5 mM, its elements 12
require modification. This is commonly accomplished by promoter or protein engineering, both 13
strategies aiming to alter the binding affinity of the TR for either the operator sequence or the ligand 14
itself.39-41 Notably, the concentration of exogenously added itaconate required to induce the system
15
in E. coli MG1655 is lower in LB medium than in M9 minimal medium. Four hours after addition of 16
0.016 mM itaconate, reporter gene expression is induced 7.7-fold in LB medium compared to a 17
culture without itaconate (Figure S3). This is in contrast to a 1.4-fold induction in M9 minimal 18
medium. The dose response curve indicates that the itaconate concentration, required for a linear 19
fluorescence output in LB medium, ranges between approximately 0.016-0.16 mM (Figure S3). 20
Despite a 5-fold reduced induction threshold for itaconate, the linear output range of the YpItcR/Pccl
21
inducible system spans one order of magnitude, similar to what is observed in M9 minimal medium. 22
This suggests that different growth conditions can contribute to the variation of both, lower and 23
upper induction thresholds, whereas the magnitude of system response is likely to remain constant. 24
In addition, the analysis of extracellular and intracellular itaconate by using high-25
performance liquid chromatography (HPLC) coupled with ultraviolet (UV) spectroscopy shows no 26
significant change in the itaconate concentration during 12-hour period in the actively growing E. coli
1
culture (Table 2). This demonstrates that itaconate is not metabolized and therefore is a primary 2
inducing molecule. Moreover, the analysis confirms that itaconate is taken up by or diffuses into the 3
E. coli cell and reaches a relatively high concentration of at least 1.3 mM after 6 hours. It should be 4
noted that the actual intracellular molar concentration could be even higher, since our 5
approximation uses assumption that the intracellular cell volume is equal to the total cell volume 6
including the space occupied by cell membranes, lipids, etc. Interestingly, the intracellular itaconate 7
concentration becomes reduced when E. coli cells reach the stationary phase (12-hour time point,
8
Table 2), however the total itaconate concentration in the culture remains unchanged. 9
[image:14.612.65.519.57.699.2]10
Table 2. Extracellularly added and intracellularly produced itaconate distribution between 11
supernatant and cells in E. coli culture grown in LB medium.
12
Itaconate extracellularly added
Time (h)
Molar concentration
(mM)a Concentration in cell culture (mg/l)
Total Extracellular Intracellular
Resulting from
supernatant Resulting from cells
0 2.5b ndc 325.253 nd 325.253
6
2.454 ± 0.050
1.309 ±
0.132 319.242 ± 6.437 0.685 ± 0.067
319.927 ± 6.437
12
2.462 ± 0.059
0.551 ±
0.058 320.243 ± 7.715 0.411 ± 0.074
320.654 ± 7.715 Itaconate intracellularly produced
Time (h)
Molar concentration (mM)
Normalized concentration in cell culture (mg/l/OD)
Total Extracellular Intracellular
Resulting from supernatant (% of
total)
Resulting from cells (% of total)
0 nd nd nd nd nd
18
0.071 ± 0.021
0.145 ± 0.008
2.149 ± 0.638
(98.67) 0.029 ± 0.003 (1.33) 2.178
36
0.242 ± 0.117
0.241 ± 0.181
7.010 ± 2.506
(99.38) 0.044 ± 0.028 (0.62) 7.054
a
Arithmetic mean ± standard deviation is derived using data of three biological replicates. 13
b
Itaconate concentration added to cell culture at 0-hour time point. 14
b
Not detected (nd). 15
1
Sensor specificity
2
The YpItcR/Pccl inducible system was analyzed for cross-induction by metabolites that may activate
3
reporter gene expression in the absence of the primary inducing molecule itaconate. These can be 4
exogenously added compounds or intermediates naturally involved in cellular metabolism. 5
Compounds that were investigated for cross-induction mainly include citric acid cycle intermediates 6
and structurally similar variants thereof (Figure 4A). Evaluation of these molecules may shed light on 7
structural features required for TR-binding and TR affinity towards itaconate. Furthermore, 8
screening potential candidate compounds might expand the list of metabolites to be detected by TR-9
based controllable systems and offer the possibility to be utilized as analogue inducers to control 10
gene expression. 11
12
Figure 4. Inducer-dependent orthogonality of the YpItcR/Pccl inducible system. (A) Compounds that
1
were investigated for cross-induction with the YpItcR/Pccl inducible system: itaconic acid (1), succinic
2
acid (2), D-malic acid (3), L-malic acid (4), fumaric acid (5), oxaloacetic acid (6), L-aspartic acid (7), 3
methylsuccinic acid (8), mesaconic acid (9), citraconic acid (10), α-ketoglutaric acid (11), L-glutamic 4
acid (12), acetic acid (13), propionic acid (14), butyric acid (15), 3-butenoic acid (16), valeric acid (17), 5
acrylic acid (18), methacrylic acid (19), tiglic acid (20), citric acid (21), cis-aconitic acid (22), trans
-6
aconitic acid (23), tricarballylic acid (24), isocitric acid (25). (B) Normalized fluorescence (in %) of E.
7
coli MG1655 harboring the YpItcR/Pccl inducible system twelve hours after addition of different
8
compounds at a final concentration of 5 mM, relative to the fluorescence output obtained by adding 9
5 mM itaconate. (-), uninduced sample. Error bars represent standard deviations of three biological 10
replicates. Asterisks indicate statistically significant induction values for p<0.01 (unpaired t test).
11
12
The fluorescence output from cultures of E. coli MG1655 harboring the YpItcR/Pccl inducible
13
system, and cultivated in M9 minimal medium, was monitored over time after individual addition of 14
each compound at a final concentration of 5 or 10 mM. Normalized fluorescence levels (in %), 15
relative to the output obtained by adding 5 mM itaconate, were determined twelve hours after 16
compound supplementation. In addition to the primary inducer itaconate and under the assumption 17
that all tested metabolites are able to enter the cell, the compounds succinate (2), methylsuccinate 18
(8), mesaconate (9), α-ketoglutarate (11), propionate (14), butyrate (15), 3-butenoate (16), acrylate 19
(18), methacrylate (19), cis-aconitate (22), and trans-aconitate (23) induce reporter gene expression
20
at a final concentration of 5 mM with high statistical significance (p<0.01) (Figure 4B). Of these 21
eleven compounds, succinate, mesaconate, propionate, butyrate, 3-butenoate, cis-aconitate and
22
trans-aconitate demonstrated a significant increase in RPF expression at a final concentration of 10 23
mM (Figure S4). Increased activation of reporter gene expression suggests that these inducers may 24
exhibit a weak binding to TR inducing the system to some extent. The highest level of cross-25
induction is mediated by trans-aconitate. At a concentration of 10 mM, it reached 9.9% of the
26
absolute normalized fluorescence that was achieved by using 5 mM itaconate. Since E. coli has not 1
been reported to encode a trans-aconitate decarboxylase, converting trans-aconitate into itaconate,
2
induction of reporter gene expression from YpPccl is more likely to be caused by ItcR promiscuity
3
rather than by decarboxylation of trans-aconitate forming itaconate.
4
Cis- and trans-aconitate showed more than a two-fold change in induction level when
5
inducer concentration was two-fold increased from 5 to 10 mM suggesting that these compounds 6
may activate the system at higher concentrations. To obtain a more accurate resolution of their dose 7
responses, the YpItcR/Pccl inducible system was subjected to a range of concentrations of cis-, and
8
trans-aconitate. Since mesaconate has been previously shown to act as CoA acceptor by YpIct, with 9
second lowest Km after itaconate,32 this compound was also included in the dose response
10
experiment. 11
A saturation in fluorescence output when using mesaconate, cis-, or trans-aconitate as
12
inducer was not possible to obtain. All three inducers demonstrated some degree of toxicity 13
inhibiting cell growth at higher concentrations. However, based on a phenomenological model for 14
metabolite biosensors,41 it can be postulated that the maximal dynamic range of an inducible
15
system, which is the maximal level of expression relative to basal promoter activity, is not affected 16
by metabolite-TR affinity. Therefore, the maximal dynamic range calculated for itaconate as inducer 17
was employed to fit the dynamic range data for mesaconate, cis-, and trans-aconitate using a Hill
18
function (Figure S5). The resulting Ki, the extracellularly added-inducer concentration which
19
mediates half-maximal RFP expression, is different for each of these compounds. They reveal that 20
mesaconate, cis-, and trans-aconitate Ki values are higher (45.2 mM, 31.1 mM, and 13.2 mM,
21
respectively) and therefore activate the YpItcR/Pccl inducible system at much higher extracellular
22
concentrations than itaconate (Ki= 0.43 mM). The structural characteristics may contribute to the
23
ability of metabolites to interact with ItcR and act as inducers. Indeed, mesaconate, cis-, and trans
-24
aconitate have structural similarities to itaconate, with last two harboring the complete itaconate 25
element. However, the observation that all three compounds have a much higher Ki than itaconate
26
suggests, that for maximal activation of the YpItcR/Pcclinducible system, the unmodified itaconate
1
structure is indispensable. It also suggests that the binding affinity of the TR to a specific ligand may 2
play an important role. Consequently, protein engineering of ItcR may be used to change the binding 3
affinity for itaconate. On the other hand, it cannot be excluded that the change in inducer dynamic 4
range is affected by the differential uptake of these compounds by the E. coli cell.
5
It should be noted that acetate, propionate, butyrate, methylsuccinate, and mesaconate 6
have previously been demonstrated to act as CoA acceptors by YpIct, albeit at a much higher Km than
7
itaconate,32 suggesting that these compounds might be secondary inducers of the YpItcR/Pccl
8
inducible system. Interestingly, their level of induction correlates with their ability to act as CoA 9
acceptors, with acetate, propionate and butyrate having a higher, and mesaconate having a lower 10
Km.32 Furthermore, the catalytic efficiency (kcat/Km) of YpIct with itaconate, mesaconate,
11
methylsuccinate, butyrate, propionate, and acetate,32 shows a high level of direct correlation with
12
level of induction by these compounds. This suggests there might be structural evolutionary link 13
between enzyme (YpIct) and transcriptional regulator (ItcR), where both proteins have co-evolved
14
enabling a hierarchical ranking of metabolites as enzyme substrates and TR activators in the 15
following order: itaconate > mesaconate > methylsuccinate > butyrate > propionate > acetate. The 16
direct correlation between catalytic efficiency and level of induction potentially ensures that the 17
hierarchy is supported at the gene expression and enzyme activity levels by securing the highest 18
level of YpIct synthesis and highest catalytic efficiency when itaconate is present in the environment.
19
Overall, the YpItcR/Pccl inducible system demonstrates a high specificity towards itaconate and may
20
therefore be used in combination with other inducible systems to orthogonally control gene 21
expression in biosynthetic pathways composed of multiple genes. 22
Biosensor-assisted optimization of itaconic acid production
23
Itaconic acid can be synthesized by decarboxylation of the citric acid cycle intermediate cis-aconitic
24
acid. This reaction is catalyzed by cis-aconitate decarboxylase (CadA). The A. terreuscadA gene has
25
previously been expressed in E. coli for the biosynthesis of itaconate by using either a constitutive 1
promoter, or an inducible T7 polymerase-based expression system.13, 20, 42 Overexpression of cadA
2
was reported to impair cellular growth,42 suggesting that fine-tuning of CadA levels is essential to
3
ensure optimal metabolic flux. Even though the pathway for itaconate biosynthesis in E. coli solely
4
requires the introduction of one additional gene, balancing its expression and quantitatively 5
evaluating its impact on itaconate production can be laborious when using standard analytical 6
techniques. We decided to apply the YpItcR/Pccl inducible system to monitor itaconate production by
7
fluorescence output in response to different levels of CadA. 8
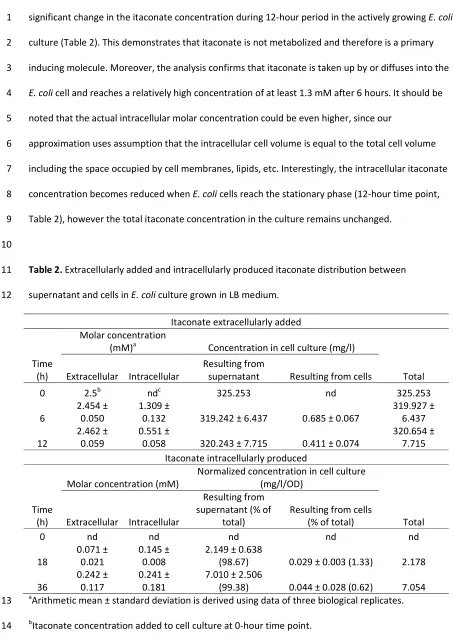
A single plasmid (pEH165) was constructed that contains two modules: one for itaconate 9
production and one for itaconate sensing (Figure 5). The A. terreuscadA (ATEG_09971) coding
10
sequence was cloned downstream of the arabinose-inducible system and a T7 mRNA stem-loop 11
structure sequence, which was incorporated to enhance cadA mRNA stability.43 The itaconate
12
sensing module contains the YpItcR/Pccl inducible system in combination with the rfp reporter gene.
13
Addition of L-arabinose to cells harboring this plasmid was expected to initiate cadA expression,
14
resulting in biosynthesis of itaconate and subsequent activation of reporter gene expression. E. coli
15
TOP10 was transformed with plasmid pEH165 and cells in early exponential growth phase were 16
transferred to a 96-well microtiter plate. Subsequently, growth and fluorescence were monitored 17
over time after supplementation with different concentrations of L-arabinose ranging from 1 to 1000 18
µM. As it can be seen in the fluorescence curve of induction kinetics, higher concentrations of L-19
arabinose mediate a faster fluorescence output (Figure 6A). Reporter gene expression above 20
background levels can be observed 150 minutes after addition of 100 µM L-arabinose, whereas 10 21
µM require about one hour more. The dose response curve indicates that maximum absolute 22
normalized fluorescence is achieved by supplementation with 250 µM L-arabinose (Figure 6B). This 23
suggests that expression of cadA can be fine-tuned when using inducer concentrations in the range
24
between 1 and 100 µM. L-arabinose concentrations of 0.5 and 1 mM, however, appear to negatively 25
impact reporter gene expression, indicating a drop in itaconate levels. The negative effect of high 26
inducer levels becomes even more evident from the absorbance data, showing that L-arabinose 1
concentrations of 250 µM and more reduce cell density considerably (Figure 6C). Most likely, this 2
behaviour results from an increased metabolic burden caused by overproduction of CadA, as 3
mentioned earlier.42
4
[image:20.612.200.416.168.306.2]5
Figure 5. Schematic illustration of the plasmid containing both an itaconate production and sensing 6
module. Exogenous addition of L-arabinose initiates synthesis of the cis-aconitate decarboxylase
7
CadA which converts cis-aconitate into itaconate. RFP reporter gene expression is subsequently
8
mediated by ItcR in the presence of itaconate. 9
10
1
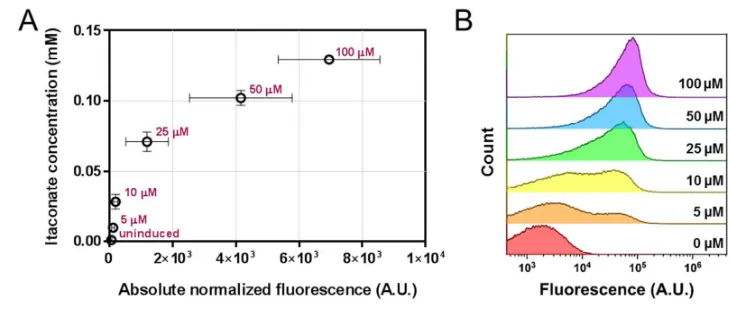
Figure 6. Biosensor-assisted optimization of itaconate production. (A) Absolute normalized 2
fluorescence of E. coli TOP10 harboring pEH165, grown in microtiter plates, in response to 1-100 µM
3
of L-arabinose supplemented at time zero. The means of three biological replicates are presented. 4
Error bars are too small to be visible. (B) Dose response curve of E. coli TOP10 harboring pEH165,
5
grown in microtiter plates, 6, 9, 12, and 15 hours post induction (hpi) with 1-1000 µM of L-arabinose. 6
The means of three biological replicates are presented. Error bars are too small to be visible. (C) 7
Absorbance at 600 nm of E. coli TOP10 harboring pEH165, grown in microtiter plates, in response to
8
50-1000 µM of L-arabinose supplemented at time zero. The means of three biological replicates are 9
presented. The standard deviation for 50 µM of inducer is illustrated as lighter colour ribbon 10
displayed lengthwise the growth curve. The error bars for the other inducer concentrations are too 11
small to be visible. (D) Itaconate titers of E. coli TOP10 harboring pEH165, grown in small-volume 1
cultures, 0, 9, 18, and 48 hours post induction with 5, 10, 25, 50, 100, 250, and 1000 µM of L-2
arabinose. Error bars represent standard deviations of three biological replicates. (E) Flow 3
cytometric analysis of E. coli TOP 10 harboring pEH165, grown in small-volume cultures, in response
4
to 100 µM of L-arabinose. Samples were taken 0, 3, 6, 12, 18 and 24 hours after inducer addition. 5
For the time points T=6, T=12, T=18 and T=24, fluorescence from more than 99% of cells are 6
displayed in the histogram, whereas for time points T=0 and T=3, less than 25% of cells are below 7
429 A. U. fluorescence threshold in the histogram. (F) Fluorescence intensity (median) and 8
percentage of uninduced and induced cells corresponding to the data presented in panel E. Error 9
bars represent standard deviations of three biological replicates. 10
11
To quantitatively validate the data which was generated from cultures grown in microtiter 12
plates, the experiment was repeated in small culture volumes. E. coli TOP10 pEH165 was grown in
13
50-mL culture tubes and expression of cadA was initiated by supplementation with different
14
concentrations of L-arabinose. To determine itaconate titers, samples were subjected to the analysis 15
using HPLC-UV. The highest itaconate concentration was achieved in cultures containing 100 µM L-16
arabinose, resulting in 0.78 ± 0.31 mM itaconate 48 hours after inducer addition (Figure 6D). This 17
represents a 4.3-fold improvement over cultures containing only 5 µM L-arabinose. It should be 18
noted that these and data in Table 2 demonstrate that the intracellularly synthesised itaconate was 19
actively excreted or diffused into the media. 20
Addition of an excessive amount of 1 mM inducer also decreased itaconate levels by 1.3-21
fold. Therefore, the quantitative data obtained from the small-volume cultures match well with the 22
fluorescence output measured in the microtiter plate (compare Figure 6B and 6D). Particularly when 23
itaconate titers are OD-normalized, 250 µM L-arabinose results in the highest OD-normalized 24
itaconate titer (Figure S6). This experiment illustrates that cadA expression needs to be carefully
25
fine-tuned to guarantee both optimal metabolic flux and viability of cells. 26
Moreover, using 100 µM of L-arabinose yields itaconate concentrations of 0.24, 0.56 and 1
0.78 mM after 9, 18 and 48 hours post induction, respectively (Figure 6D). These itaconate 2
concentrations fall within the linear range of dose response (Figure 3B) and result in a fluorescence 3
output with a unimodal distribution suggesting that almost all cells in the population were activated 4
(Figure 6E and 6F). As demonstrated here, the itaconate biosensor can be employed to facilitate a 5
fluorescence-based high-throughput screen to evaluate various conditions for their impact on 6
itaconate biosynthesis. 7
Correlation between biosensor output and itaconate concentration
8
In addition to HPLC-UV analysis, the samples from the small-volume cultures of E. coli TOP10 pEH165
9
were analyzed for fluorescence output. The obtained data were used to evaluate whether 10
quantitatively determined itaconate titers correlate with reporter gene expression from the 11
biosensor. The five tested inducer concentrations that did not impair bacterial growth produced a 12
59-fold range in fluorescence after six hours (Figure 7A). The addition of 25, 50 and 100 µM L-13
arabinose resulted in itaconate titers that were sufficiently high to be detected by the biosensor. 14
Notably, in the linear response range of the YpItcR/Pccl inducible system, the fluorescence output
15
shows a high level of correlation with HPLC-UV-measured extracellular itaconate titers (Figure 7A) 16
and unimodal fluorescence distribution in the cell population (Figure 7B). L-arabinose concentrations 17
of 5 and 10 µM result in a bimodal fluorescence response, suggesting an all-or-none induction in 18
which intermediate inducer concentrations give rise to subpopulations. However, when different 19
levels of itaconate are synthesized in the range between 0.1 and 0.78 mM, which corresponds to the 20
linear response range, the fluorescence output becomes unimodal (Figures 6D, 6E and 7A). This 21
confirms that for itaconate levels in the linear range, the YpItcR/Pccl inducible system mediates a
22
homogenous induction of cells, exemplifying its potential to fine-tune gene expression across cell 23
populations and to be utilized as a quantitatively reliable biosensor. 24
1
Figure 7. Correlation between biosensor output and itaconate concentration. (A) Absolute 2
normalized fluorescence values of E. coli TOP10 pEH165 are correlated with their corresponding
3
itaconate concentration in the culture supernatant. Samples were taken six hours after inducer 4
addition. The different concentrations of exogenously added L-arabinose, ranging from 5 to 100 µM, 5
are highlighted. Error bars represent standard deviations of three biological replicates. (B) Flow 6
cytometric analysis of samples from panel A. For L-arabinose (inducer) concentrations of 25, 50, and 7
100 µM, fluorescence from more than 99% of cells are displayed in the histogram, whereas for 8
concentrations of 10, 5 and 0 µM, less than 2, 10 and 25% of cells, respectively, are below 429 A. U. 9
fluorescence threshold in the histogram. 10
11
Methods
1
Base strains and media
2
E. coli TOP10 (Invitrogen) was used for cloning, plasmid propagation, and biosynthesis of itaconate. 3
RFP fluorescence assays for biosensor characterization were performed in wild type E. coli MG1655
4
(DSMZ 18039) and C. necator H16 (ATCC 17699). Bacterial strains were propagated in LB medium.
5
For reporter gene assays, E. coli MG1655 was cultivated in M9 minimal medium44 supplemented
6
with 1 µg/L thiamine, 20 µg/mL uracil45 and 0.4% (w/v) glucose, unless otherwise indicated. C.
7
necator reporter gene assays were performed in minimal medium46 containing 0.4% (w/v) sodium 8
gluconate. Antibiotics were added to the growth medium at the following concentrations: 25 µg/mL, 9
or 50 µg/mL chloramphenicol for E. coli, or C. necator, respectively. E. coli TOP10 was grown at 30 or
10
37°C. For comparison, both E. coli MG1655 and C. necator were cultivated at 30°C.
11
Cloning and transformation
12
Plasmid minipreps were carried out using the New England BioLabs (NEB) Monarch® Plasmid 13
Miniprep Kit. Microbial genomic DNA was extracted employing the GenEluteTM Bacterial Genomic
14
DNA Kit (Sigma). For cloning, DNA was amplified by PCR using Phusion High-Fidelity DNA polymerase 15
from NEB in 50 µL reactions under recommended conditions. Restriction enzymes and NEBuilder Hifi 16
DNA assembly master mix were purchased from NEB and reactions were set up according to the 17
manufacturer’s protocol. The NEB Monarch® DNA Gel Extraction Kit was used to extract gel purified 18
linearized DNA which was subsequently used for cloning. 19
Chemical competent E. coli were prepared and transformed by heat shock as previously
20
described.44 Electrocompetent C. necator were prepared and transformed as reported by Ausubel et
21
al.47
22
Plasmid construction
1
Oligonucleotide primers were synthesized by Sigma-Aldrich (Table S1). Plasmids were constructed by 2
employing either the NEBuilder Hifi DNA assembly method according to the manufacturer’s protocol 3
or by restriction enzyme-based cloning procedures.44 Constructs were verified by DNA sequencing
4
(Source BioScience, Nottingham, UK). The nucleotide sequences of pEH086 and pEH177 have been 5
deposited in the public version of the ACS registry (https://acs-registry.jbei.org) under the accession
6
number ACS_000716 and ACS_000717, respectively. 7
The itaconate-inducible systems YpItcR/Pccl and PaItcR/Pich were amplified with
8
oligonucleotide primers EH191_f and EH190_r, EH312_f and EH311_r, respectively, from Y.
9
pseudotuberculosis YPIII (Yp) and P. aeruginosa PAO1 (Pa) genomic DNA and cloned into pEH006 by 10
AatII and NdeI restriction sites (resulting in plasmids pEH086 and pEH177). The itaconate-inducible 11
promoters YpPccl and PaPich were amplified with oligonucleotide primers EH191_f and EH302_r,
12
EH312_f and EH313_r, respectively, from Y. pseudotuberculosis YPIII and P. aeruginosa PAO1
13
genomic DNA and cloned into pEH006 by AatII and NdeI restriction sites (resulting in plasmids 14
pEH172 and pEH178). 15
Vector pEH164 contains both the itaconate-reporter system composed of YpItcR-Pccl-rfp and
16
the L-arabinose-inducible system including restriction sites for subsequent integration of the cis
-17
aconitate decarboxylase cadA gene (ATEG_09971) downstream of ParaBAD. It was constructed by
18
employing the NEBuilder Hifi DNA assembly method. Oligonucleotide primers EH011_f and EH075_r, 19
EH015_f and EH012_r, EH078_f and EH190_r, EH083_f and EH079_r were used to amplify the 20
replication origin and the chloramphenicol resistance gene, YpItcR-Pccl-rfp, and the
L-arabinose-21
inducible system from pBBR1MCS-2-PphaC-eyfp-c1, pEH086, and pEH006, respectively.36, 37
22
Vector pEH165 contains both the itaconate-production system AraC-ParaBAD-cadA and the
23
itaconate-reporter system YpItcR-Pccl-rfp. Oligonucleotide primers EH294_f and EH293_r, EH296_f
24
and EH295_r were used to amplify exon 1 and exon 2 of ATEG_09971 from A. terreus NIH2642
25
genomic DNA. The PCR products were combined with BglII/SbfI digested pEH164 and constructed by 1
employing the NEBuilder Hifi DNA assembly method. 2
RFP fluorescence assay
3
RFP fluorescence was measured with an Infinite® M1000 PRO (Tecan) micro plate reader using 585 4
nm as excitation and 620 nm as emission wavelength. The gain factor was set manually to 100%. 5
Absorbance was determined at 600 nm to normalize fluorescence by optical density. Fluorescence 6
and absorbance readings at a single time point, and over time, were performed as described 7
previously.36 The absolute normalized fluorescence was calculated by dividing the absolute
8
fluorescence values by their corresponding absorbance values. Prior normalization, both values were 9
corrected by the auto-fluorescence and -absorbance of the culture medium. 10
Production of itaconate and HPLC-UV analysis
11
Real-time biosynthesis of itaconate was monitored quantitatively by high-performance liquid 12
chromatography (HPLC) in combination with ultraviolet (UV) absorbance at 210 nm and by 13
fluorescence output in E. coli T10 harboring pEH165. Single colonies of freshly transformed cells
14
were used to inoculate five mL LB medium. The preculture was incubated for 18 hours at 37°C and 15
200 rpm. Subsequently, it was diluted 1:100 in six mL fresh LB medium. The main cultures were 16
grown in 50-mL Falcon tubes at 30°C and 225 rpm. At an OD600 of 0.5, 50 µL of L-arabinose stock
17
solutions were added to achieve the final concentrations of 5, 10, 25, 50, 100, 250 and 1000 µM. 18
One sample per biological replicate remained uninduced. Samples of 0.5 mL were taken 19
immediately, 6, 9, 12, 18, 24, and 48 hours after inducer supplementation. They were directly used 20
for evaluation by flow cytometry, OD600 and fluorescence measurement. The remaining sample was
21
centrifuged for 5 min at 16,000 × g, and the cell-free supernatant was subjected to HPLC-UV analysis
22
as reported previously.36
23
Metabolite extraction
1
To determine intracellular itaconate concentrations when added extracellularly or synthesized 2
intracellularly, cultures of E. coli TOP10 harboring pEH164 or pEH165 were grown overnight to
3
saturation and diluted 1:100 in 200 mL LB medium. The main cultures were grown in 1-L shake flasks 4
at 30°C and 225 rpm. At an OD600 of 0.5, inducers were added at final concentrations of 2.5 mM
5
itaconate or 100 µM L-arabinose to cultures of E. coli TOP10 harboring pEH164 or pEH165,
6
respectively. Samples of cells containing pEH164 were taken 0, 6 and 12 hours after addition of 7
itaconate. Samples of cells containing pEH165 were taken 0, 18 and 36 hours after addition of L-8
arabinose. Each time, the culture volume corresponding to an OD600 of 50 was centrifuged for 10 min
9
at 16,000 × g. The supernatant was removed and stored at -80°C for HPLC analysis. Subsequently,
10
the cell pellet was washed once in 1 mL of phosphate buffered saline (PBS), transferred to a 11
microcentrifuge tube and centrifuged as before. The supernatant was completely removed, the 12
pellet was weighed using fine balance and frozen overnight at -80°C. 13
The extraction of intracellular metabolites including itaconate was performed as described 14
previously48 with modifications as described below. Briefly, 250 µL of -40°C cold methanol-water
15
solution (60% v/v) was added to the wet cell pellet with the volume of 50-70 µL. Subsequently, the 16
sample was mixed vigorously using vortex until completely resuspended. The cell suspension was 17
frozen at -80°C for 30 min, thawed on ice and vortexed vigorously for 1 min. This step was repeated 18
three times before the sample was centrifuged at -10°C and 26,000 × g for 20 min. The supernatant
19
was collected and kept at -80°C. To the pellet, another 250 µL of -40°C cold methanol-water solution 20
(60% v/v) was added. The cells were resuspended completely using vortex, three freeze-thaw cycles 21
performed as above and centrifuged as before. The supernatant was pooled with the first one and 22
stored at at -80°C until subjected to HPLC analysis. 23
Calculation of intracellular itaconate concentration in cell culture
1
The total cell volume (Vpellet) in the sample was calculated by dividing the weight of wet cell pellet by
2
the cell density of 1.105 g/mL.49 Together with the volume of extraction solvent added to the
3
sample, Vpellet was used to calculate the dilution factor required to determine the intracellular molar
4
concentration of itaconate. Subsequently, the intracellular itaconate concentration in the cell culture 5
(Cintracellular/CC) was calculated using equation:
6
/ =
∙ ∙
The remaining parameters correspond to the formula weight of itaconic acid (FWitaconic acid), the
7
intracellular molar concentration of itaconate determined by HPLC-UV (Cmolar) and the culture
8
volume sampled (Vculture).
9
Flow cytometry
10
Cells were analyzed for induction homogeneity by flow cytometry. The culture sample was 11
centrifuged for 4 min at 5,000 × g. Subsequently, the cell pellet was resuspended in cold and sterile
12
filtered PBS to an OD600 of 0.01 and kept on ice until analyzed using an Astrios EQ flow cytometer
13
(Beckman Coulter) equipped with a 561 nm laser and a 614/20 nm emission band-pass filter. The 14
voltage of photomultiplier tube (PMT) was set to 400 volts. The area and height gain was adjusted to 15
1.0. For each sample, at least 100,000 events were collected. The data was analyzed using software 16
Kaluza 1.5 (Beckman Coulter). To determine the percentage of induced cells, gating was performed 17
on the uninduced sample to include 99% of cells. The same gate was subsequently applied to each 18
induced sample. 19
Calculation of half-maximal RFP expression
20
Due to toxicity at higher levels, the concentrations of mesaconate, cis-, and trans-aconitate, which
21
mediate half-maximal RFP expression (Ki), were predicted using a phenomenological model as
22
described previously.41 The model describes the change in dynamic range of an inducible system as a
23
function of inducer concentration. It assumes that: 1) the maximum dynamic range of a biosensor 1
(µmax) remains constant as long as the genetic context does not change, and 2) Ki is dependent on
2
metabolite-TR affinity. 3
The dynamic range (µ, also referred to as induction factor) for each concentration of
4
itaconate was calculated using the absolute normalised fluorescence values from the time course 5
experiment six hours after itaconate addition. After subtraction of the basal output, the resulting 6
dynamic range was fit to the corresponding inducer concentration using the Hill function: 7
= ∙
∙
The remaining parameters correspond to concentration of inducer (I), and the Hill coefficient (h).
8
Subsequently, the itaconate µmax was used as fixed parameter to calculate Ki for mesaconate, cis-,
9
and trans-aconitate employing the same Hill function. The fitted data is illustrated in Figure S5. 10
Calculations were performed using Prism GraphPad software version 7.03. 11
12
Associated content
1
Supporting information
2
Further experimental details for plasmid construction and additional figures described in the main 3
text. 4
Author information
5
Corresponding author
6
E-mail: [email protected] 7
Author contribution
8
E.H. and N.M designed the study. E.H. performed the experiments. E.H., N.M. and N.P.M. analyzed 9
the data and wrote the manuscript. 10
Conflict of interest
11
The authors declare that they have no competing interests. 12
Acknowledgements
13
This work was supported by the Biotechnology and Biological Sciences Research Council [grant 14
number BB/L013940/1] (BBSRC); and the Engineering and Physical Sciences Research Council 15
(EPSRC) under the same grant number. We thank University of Nottingham for providing SBRC-16
DTProg PhD studentship to E.H., Swathi Alagesan for preliminary work on itaconate production in C.
17
necator H16, Matthew Abbott and David Onion for assistance with HPLC analysis and flow 18
cytometry, Thomas Millat for discussion on data analysis, Amy Slater, Carolina Paiva, Matthias Brock 19
and Elena Geib for gifting Y. pseudotuberculosis, P. aeruginosa and A. terreus genomic DNA and all
20
members of SBRC who helped to carry out this research. 21
22
References
1
[1] Clomburg, J. M., Crumbley, A. M., and Gonzalez, R. (2017) Industrial
2
biomanufacturing: The future of chemical production.
Science
355
(6320),
3
aag0804.
4
[2] Latif, H., Zeidan, A. A., Nielsen, A. T., and Zengler, K. (2014) Trash to treasure:
5
production of biofuels and commodity chemicals via syngas fermenting
6
microorganisms.
Curr. Opin. Biotechnol.
27
, 79-87.
7
[3] Keasling, J. D. (2010) Manufacturing molecules through metabolic engineering.
8
Science
330
(6009), 1355-1358.
9
[4] Okabe, M., Lies, D., Kanamasa, S., and Park, E. Y. (2009) Biotechnological
10
production of itaconic acid and its biosynthesis in
Aspergillus terreus
.
Appl.
11
Microbiol. Biotechnol.
84
(4), 597-606.
12
[5] Werpy, T., Petersen, G., Aden, A., Bozell, J., Holladay, J., White, J., Manheim, A.,
13
Eliot, D., Lasure, L., and Jones, S. (2004) Top value added chemicals from
14
biomass. Volume 1-Results of screening for potential candidates from sugars
15
and synthesis gas, Department of Energy Washington DC.
16
[6] Choi, S., Song, C. W., Shin, J. H., and Lee, S. Y. (2015) Biorefineries for the
17
production of top building block chemicals and their derivatives.
Metab. Eng.
18
28
, 223-239.
19
[7] Bentley, R., and Thiessen, C. P. (1957) Biosynthesis of itaconic acid in Aspergillus
20
terreus: I. Tracer studies with C
14-labeled substrates.
J. Biol. Chem.
226
(2),
21
673-687.
22
[8] Haskins, R., Thorn, J., and Boothroyd, B. (1955) Biochemistry of the Ustilaginales:
23
XI. Metabolic products of
Ustilago zeae
in submerged culture.
Can. J.
24
Microbiol.
1
(9), 749-756.
25
[9] Tabuchi, T., Sugisawa, T., Ishidori, T., Nakahara, T., and Sugiyama, J. (1981)
26
Itaconic acid fermentation by a yeast belonging to the genus
Candida
.
Agric.
27
Biol. Chem.
45
(2), 475-479.
28
[10] Strelko, C. L., Lu, W., Dufort, F. J., Seyfried, T. N., Chiles, T. C., Rabinowitz, J. D.,
29
and Roberts, M. F. (2011) Itaconic acid is a mammalian metabolite induced
30
during macrophage activation.
J. Am. Chem. Soc.
133
(41), 16386-16389.
31
[11] Cordes, T., Michelucci, A., and Hiller, K. (2015) Itaconic acid: the surprising role
32
of an industrial compound as a mammalian antimicrobial metabolite.
Annu.
33
Rev. Nutr.
35
, 451-473.
34
[12] Geiser, E., Przybilla, S. K., Friedrich, A., Buckel, W., Wierckx, N., Blank, L. M., and
35
Bölker, M. (2016)
Ustilago maydis
produces itaconic acid via the unusual
36
intermediate
trans
-aconitate.
Microb. Biotechnol.
9
(1), 116-126.
37
[13] Li, A., van Luijk, N., Ter Beek, M., Caspers, M., Punt, P., and van der Werf, M.
38
(2011) A clone-based transcriptomics approach for the identification of genes
39
relevant for itaconic acid production in
Aspergillus
.
Fungal Genet. Biol.
48
(6),
40
602-611.
41
[14] Kuenz, A., Gallenmüller, Y., Willke, T., and Vorlop, K.-D. (2012) Microbial
1
production of itaconic acid: developing a stable platform for high product
2
concentrations.
Appl. Microbiol. Biotechnol.
96
(5), 1209-1216.
3
[15] Hevekerl, A., Kuenz, A., and Vorlop, K.-D. (2014) Filamentous fungi in microtiter
4
plates—an easy way to optimize itaconic acid production with
Aspergillus
5
terreus
.
Appl. Microbiol. Biotechnol.
98
(16), 6983-6989.
6
[16] Krull, S., Hevekerl, A., Kuenz, A., and Prüße, U. (2017) Process development of
7
itaconic acid production by a natural wild type strain of
Aspergillus terreus
to
8
reach industrially relevant final titers.
Appl. Microbiol. Biotechnol.
101
(10),
9
4063-4072.
10
[17] Kanamasa, S., Dwiarti, L., Okabe, M., and Park, E. Y. (2008) Cloning and
11
functional characterization of the cis-aconitic acid decarboxylase (CAD) gene
12
from
Aspergillus terreus
.
Appl. Microbiol. Biotechnol.
80
(2), 223-229.
13
[18] Levinson, W. E., Kurtzman, C. P., and Kuo, T. M. (2006) Production of itaconic
14
acid by
Pseudozyma antarctica
NRRL Y-7808 under nitrogen-limited growth
15
conditions.
Enzyme Microb. Technol.
39
(4), 824-827.
16
[19] Otten, A., Brocker, M., and Bott, M. (2015) Metabolic engineering of
17
Corynebacterium glutamicum
for the production of itaconate.
Metab. Eng.
30
,
18
156-165.
19
[20] Harder, B.-J., Bettenbrock, K., and Klamt, S. (2016) Model-based metabolic
20
engineering enables high yield itaconic acid production by
Escherichia coli
.
21
Metab. Eng.
38
, 29-37.
22
[21] Blazeck, J., Miller, J., Pan, A., Gengler, J., Holden, C., Jamoussi, M., and Alper, H.
23
S. (2014) Metabolic engineering of
Saccharomyces cerevisiae
for itaconic acid
24
production.
Appl. Microbiol. Biotechnol.
98
(19), 8155-8164.
25
[22] Blazeck, J., Hill, A., Jamoussi, M., Pan, A., Miller, J., and Alper, H. S. (2015)
26
Metabolic engineering of
Yarrowia lipolytica
for itaconic acid production.
27
Metab. Eng.
32
, 66-73.
28
[23] Guevarra, E. D., and Tabuchi, T. (1990) Accumulation of itaconic,
2-29
hydroxyparaconic, itatartaric, and malic acids by strains of the genus
Ustilago
.
30
Agric. Biol. Chem.
54
(9), 2353-2358.
31
[24] Zambanini, T., Tehrani, H. H., Geiser, E., Merker, D., Schleese, S., Krabbe, J.,
32
Buescher, J. M., Meurer, G., Wierckx, N., and Blank, L. M. (2017) Efficient
33
itaconic acid production from glycerol with
Ustilago vetiveriae
TZ1.
Biotechnol.
34
Biofuels
10
(1), 131.
35
[25] Rogers, J. K., Taylor, N. D., and Church, G. M. (2016) Biosensor-based
36
engineering of biosynthetic pathways.
Curr. Opin. Biotechnol.
42
, 84-91.
37
[26] Rogers, J. K., Guzman, C. D., Taylor, N. D., Raman, S., Anderson, K., and Church,
38
G. M. (2015) Synthetic biosensors for precise gene control and real-time
39
monitoring of metabolites.
Nucleic Acids Res.
43
(15), 7648-7660.
40
[27] Raman, S., Rogers, J. K., Taylor, N. D., and Church, G. M. (2014) Evolution-guided
41
optimization of biosynthetic pathways.
Proc. Natl. Acad. Sci. U.S.A.
111
(50),
42
17803-17808.
43