Article
Customized in Situ Functionalization of
Nanodiamonds with Nanoparticles for Tuned
(Bio)Sensing Platforms
Raquel Montes1, Gerard Sánchez2, Jingjing Zhao3, Cristina Palet3, Julio Bastos-Arrieta4,* and Mireia Baeza2,*
1GENOCOV Research Group, Department of Chemical, Biological and Environmental Engineering, School of Engineering, Universitat Autònoma de Barcelona, Carrer de les Sitges, 08193 Bellaterra (Cerdanyola del Vallès), Barcelona, Spain. Email: [email protected] (R.M)
2 GENOCOV Research Group, Department of Chemistry, Faculty of Science, Edifici C-Nord, Universitat Autònoma de Barcelona, Carrer dels Til·lers, 08193 Bellaterra (Cerdanyola del Vallès), Barcelona, Spain. Email: [email protected] (G.S),
3 GTS-UAB Research Group, Department of Chemistry, Facultat de Ciències, Universitat Autònoma de Barcelona, Carrer dels Til·lers, 08193, Cerdanyola del Vallès, Catalunya, Spain. Email:
[email protected] (J.Z.), [email protected] (C.P)
4 Physical Chemistry TU Dresden, Zellescher Weg 19, 01069 Dresden, Germany
* Correspondence: [email protected] (J.B-A), [email protected] (M.B)
Abstract: The incorporation of nanomaterials on (bio)sensors based on composite materials has led to important advances in analytical chemistry field due to the extraordinary properties that these materials offer. Nanodiamonds (NDs) are a novel type of material that has raised much attention, as they have the possibility of being produced on large scale by using relatively inexpensive synthetic methodologies. Moreover, NDs present some other interesting features as suitability for fluorescence due to surface functionalization and a proved biocompatibility, which makes them well suited for biomedical applications. In addition, NDs can be modified with metallic nanoparticles (NP), such as silver or gold, in order to combine the special features of both. The aim of this research work is the nanostructuration of novel sensing devices using NDs combined with silver (Ag@NDs) and gold (Au@NDs) nanoparticles. A complete morphological and electrochemical characterization as function of the prepared nanocomposite composition have been performed in order to improve the electroanalytical properties of the developed (bio)sensors.
Keywords: Carbon nanostructures; nanodiamonds; metal nanoparticles; functionalization electrochemical (bio)sensor; nanocomposites
Graphical Abstract
1. Introduction
Nanocomposite materials composed of different carbon nanallotropic forms present electrochemical improvements [1,2] over conventional solid electrodes, such as robustness, renewable surface or a small background current, among others. Additionally, the ease of modification is another important feature. Composite electrodes allow the modification with a variety of nanomaterials due to its plastic nature. These modifying reagents include electrocatalysts, enzymes, functional metal nanoparticles(NPs), quantum dots, proteins, ligands, or chemical (bio)recognition agents [3,4]. Besides, they can be either modified within the bulk (polymeric material) or on the surface. The customization of these nanocomposite sensors has included a variety nanomaterials aiming to enhance their electrocatalytical performance.
Nanodiamonds (NDs) have recently been widely introduced as components of biosensing platforms due to their cost effective large scale production with narrow size distribution, biocompatibility and their surface chemistry, that make them suitable for further customization with different functional moieties [5]. Even though bulk diamonds are well known isolators, features attributed to nanoscale make NDs to be electrochemically active[6,7]. This is can be explained because of the existence of discrete electronic states within NDs band gap (overlapping of molecular orbitals), which provides NDs a surface suitable to undergo redox reactions, and consequently have electrochemical response [8].
All these characteristics, make interesting to evaluate the effect of the customization of NDs to carbon nanocomposite (bio)sensors by three different routes [9]: a) covalent or non-covalent functionalization of the NDs with the modifiers and their subsequently mix within the polymer; b) directly introduce the modifiers in the carbon/polymer matrix during the preparation, which remain embedded or trapped in the nanocomposite; and c) immobilization of the (bio)species on the surface of the already prepared nanocomposite electrode.[10]
The characterization of the electrodes based on nanocomposite materials is a very important step to consider when working in analytical chemistry. This is due to the fact that the final electrochemical properties of the composites and nanocomposites electrodes have a very high influence on the electroanalytical response they offer[11]. Recently, it has been established complementary strategies of characterization which demonstrates that if the composite proportions are optimized, the response of the electrode will be improved [10,12].
Electrochemical impedance spectroscopy (EIS) is a powerful technique which offer information about the electron-transfer rate (Rct), the double- layer capacitance (Cdl), contact resistance and
resistance of the solution (RΩ) [13]. The electroanalytical properties required by an electrode in order
to ensure enough sensitivity, a high signal-to-noise ratio and low detections limits; are: high
transfer rate, the lowest ohmic resistance and double-layer capacitance. Using EIS technique, it is possible to determine the optimal composite composition that exhibits these electrochemical properties associated with the improvement of the electroanalytical performance. Complementary techniques such as cyclic voltammetry(CV) allows to obtain supplementary information obtained by EIS[14].
In this work, we report the construction and characterization of nanocomposites based on graphite-epoxy and modified nanodiamonds functionalized with metallic NPs (Ag@NDs and Au@NDs). The electrochemical properties of such electrodes have been studied in order to optimize the electrochemical behavior. Finally, the electroanalytical response of the optimized nanocomposites has been evaluated using two reference analytes such as hydrogen peroxide and glucose.
2. Materials and Methods 2.1. Apparatus
EIS and voltammetric measurements (CV) were performed using a computer controlled Autolab PGSTAT12 potentiostat/galvanostat (EcoChemie, Utrech, The Netherlands) with a three-electrode configuration. A platinum-based electrode 53-671 (Crison Instruments, Alella, Barcelona, Spain), an AgCl covered silver wire and the constructed graphite nanocomposite electrodes were used as a counter, reference, and working electrodes, respectively.
Linear-sweep voltagrams were performed using a computer controlled Autolab PGSTAT12 potentiostat/galvanostat (EcoChemie, Utrech, The Netherlands) with a three-electrode configuration. A single junction reference electrode Ag/AgCl Orion 900100 (Thermo Electron Corporation, Beverly, MA, USA) with 3.0 M KCl as internal reference solution and platinum-based electrode were used as reference and auxiliary, respectively, and graphite nanocomposite electrodes as working electrodes.
Amperometric measurements were done using an amperimeter LC-4C (Bio analytical Systems Inc., West Lafayette, IN, USA). Electroanalytical experiments were carried out using three-electrode configuration. A single junction reference electrode Ag/AgCl Orion 900100 (Thermo Electron Corporation, Beverly, MA, USA) with 3.0 M KCl as internal reference solution and platinum-based electrode were used as reference and auxiliary, respectively. The graphite nanocomposites electrodes were used as working electrode. A magnetic stirrer at constant rpm provided the convective transport during the amperometric measurements.
Transmission electron microscopy (TEM) images were obtained by High Resolution Transmission Electron Microscopy (HR-TEM) technique using JEOL JEM-1400, unit with an acceleration voltage of 120 kV. At the same time, Energy Dispersive Spectroscopy (EDS) analysis was used for the qualitative determination of NPs presence.
Scanning electron microscopy (SEM) images were obtained with the Zeiss EVO® MA 10 unit with an acceleration voltage of 15 kV.
2.2. Chemical reagents
Graphite powder (average particle size of 50 μm) was received from Merck Millipore (Darmstadt,
Germany) and the epoxy resin EpoTek H77 with the corresponding hardener supplied by Epoxy Technologies (Billerica, MA, USA). Nanodiamonds (>87%) were obtained from PlasmaChem (Germany). Potassium chloride (99.5%), potassium ferrocyanide trihydrate (>99%), potassium ferricyanide (III) (99%), nitric acid (99.5%), potassium nitrate (99%), potassium hydrogenphosphate (99.5%), potassium dihidrogenpohsphate (99.5%), silver nitrate (≥99%), gold chloride trihydrate (≥99.9%), sodium chloride (99.5%), sodium borohydride, chloroauric acid (≤99.9), hydrogen peroxide
(30%), glucose oxidase VII from Aspergillus niger (174400 units/g), D-(+)-Glucose (≥99.5%) and bovine
water. All the dissolutions were prepared using deionized water from Milli-Q system (Millipore, Billerica, MA, USA).
2.3. Synthesis of Ag@NDs and Au@NDs
Functionalization of NDs with silver (Ag@NDs) and gold nanoparticles (Au@NDs) were carried out following a Intermatrix Synthesis approach reported in previous works [15,16], which is based on ion exchange and reduction stages to obtain a favorable distribution of nanoparticles. NDs surface was activated with carboxylic groups by dispersing them in a 2.5 M nitric acid and placing all in an ultrasound bath for 2 h. These groups were converted to the Na+ form by treating them with
1.0 M NaCl solution with mechanical stirring for 2h (see equation 1).
[NDs–COO−H+] + Na+→ [NDs–COO−Na+] + H+ (1)
Firstly, Ag-NPs precursor (Ag+) is fixed on the NDs, by an ion exchange stage with AgNO3,
following equation 2:
[NDs-COO- Na+] + Ag+→ [NDs-COO- Ag+]+ Na+ (2)
Then, the appearance of the Ag0-NPs is achieved after the addition of NaBH4 (as the reducing
agent). This reaction, leads the NDs to their Na+ form again, making suitable further synthesis of Ag0
-NPs by this approach (as can be seen in equation 3).
[NDs-COO- Ag+]+ NaBH4→ [NDs-COO- Na+] + 7/2 H2 + B(OH)3 +Ag0-NPs (3)
For the preparation of Au@NDs, a galvanic replacement strategy is needed, as the commonly used precursor of the Au0-NPs is negatively charged (AuCl4-) and therefore, its fixation on the
carboxylic moieties is not possible. Thus, the difference of redox potentials between Au and Ag can be exploited, leading to a highly spontaneous galvanic replacement process to obtain Au0-NPs using
the previously prepared Ag0-NPs as sacrificial templates (equation 4) [17].
Ag0-NPs + AuCl4-→ Au0-NPs + 4Cl- + 3Ag+ (4)
2.4. Fabrication of the electrodes
The preparation of the nanocomposite material was done handmade by mixing polymer Epotek H77A and its corresponding H77B hardener in a 20:3 (w/w) ratio and adding the conducting filler nanomaterial, graphite. The composition was fixed at 17% of graphite loading as an optimal composition for the development of amperometric (nano)composites based on previous studies [18,19]. The composite was homogenized for 30 minutes. After the homogenization time, the nanomaterial has been incorporated, either raw NDs (1% (w/w)), NDs functionalized with gold nanoparticles (1%, 2% and 3.5% (w/w)) or NDs functionalized with silver nanoparticles (1%, 2% and 3% (w/w)). The composite paste was homogenized for 15 minutes more to assure the integration of the nanomaterial. The final nanocomposite paste electrode was allowed to harder during 24 hours at 60ºC. Finally, the electrode surface was polished with different sandpapers of decreasing grain size. The final electrode dimensions were 28 mm2 and 3 mm for its geometric area and thickness,
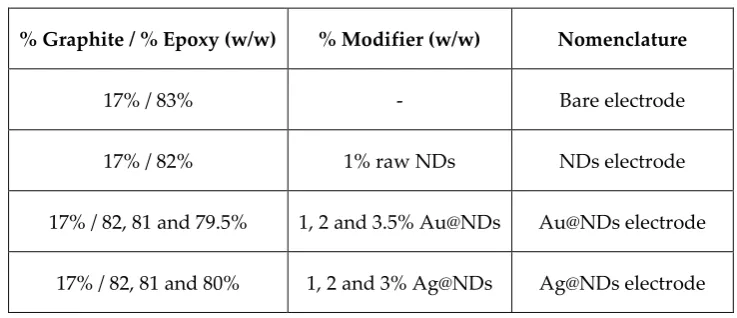
Table 1. Composition summary of fabricated nanocomposite electrodes.
% Graphite / % Epoxy (w/w) % Modifier (w/w) Nomenclature
17% / 83% - Bare electrode
17% / 82% 1% raw NDs NDs electrode
17% / 82, 81 and 79.5% 1, 2 and 3.5% Au@NDs Au@NDs electrode
17% / 82, 81 and 80% 1, 2 and 3% Ag@NDs Ag@NDs electrode
2.5. Electrochemical procedure
EIS and CV measurements were carried out in 0.1 M potassium chloride solution containing 0.01 M potassium ferricyanide/ferrocyanide under quiescent condition. The optimal polarization potential of the studied analytes for each prepared (nano)composite electrodes were obtained by linear scan voltammetry. This technique consists in registering the intensity while a potential sweep is done in a determined direction at a constant scan rate. The sweeps are carried out in the without stirring. For each of the studied analytes a sweep potential between 0 V and 1.5 V was applied at a scan rate of 10 m·V·s-1. First of all, a potential sweep is done on a 20 mL solution containing the
support electrolyte, PBS at pH 7.0, and then successive sweeps are carried out on the same electrolytic solution after adding, in consecutive way, different micro-volumes of a solution containing the analyte of interest. For hydrogen peroxide measurements, consecutive micro-volumes of a solution of 1 M hydrogen peroxide solution were added until a final concentration in the electrolytic media of
27 mM H2O2. For glucose measurements consecutive micro-volumes of 1 M glucose solution were
added until a final concentration in the electrolytic media of 100 mM glucose.
Amperometric detection of the different reference analytes (hydrogen peroxide and glucose) was made under force convection by stirring the electrolyte solution with magnetic stirrer.
2.6. Surface modification of the nanocomposite electrodes with glucose oxidase
For the surface modification of the electrodes with glucose oxidase by direct contact method, a stock solution is prepared from 15 mg of GOD and 300 μl of the bovine serum albumin (BSA) solution at 1% (p/v) in PBS. The electrode was incubated with the GOD solution using a thermomixer (Thermomixer comfort, Eppendorf AG, Hamburg, Germany) at 600 rpm and 20 ºC. Three different contact times were evaluated: 30 minutes, 1 hour and 24 hours.
3. Results
3.1. Characterization of the modified NDs containing composites
Figure 1. Scheme of the functionalization process (A), NDs TEM image and EDS (B), Ag@NDs TEM image and EDS (C) and Au@NDs TEM image and EDS (D).
3.2. Morphological characterization by SEM
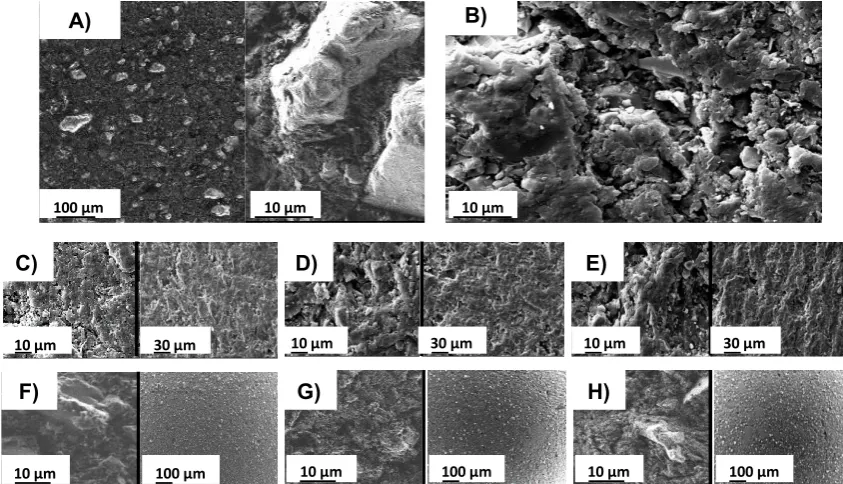
The SEM images allowed observing qualitatively the roughness and the porosity of the nanocomposites surface constructed. Figure 2 shows SEM images obtained for each NDs containing nanocomposite, in comparison to the bare electrode based on graphite-epoxy (Figure 2A) at different magnification levels. It can be seen that the incorporation of the different nanomaterials to the matrix at different amounts of gold and silver NPs; NDs (Figure 2B), Au@NDs (Figure 2 C-E) and Ag@NDs (Figure 2 F-H); does not modify the morphology and that in all cases, the surface presents high homogeneity and certain roughness. This homogeneity assures better reproducibility during the analytical application.
Figure 2. SEM images at different magnification levels of the graphite/epoxy electrode (A), the electrode containing 1% NDs (B), the electrodes containing 1%, 2% and 3.5% of Au@NDs (C-E) and the electrodes containing 1%, 2% and 3% of Ag@NDs (F-H).
Ag C
Au C
C
A) B)
C) D)
ii.
i. iii.
i. Loading of Ag ions (NP precursor) ii. Redox Stage: synthesis of Ag-NPs iii. Galvanic Replacement: Au-NPs
-COO
-Ag+
-COO-Ag
+
100 m
A)
B)
C)
D)
E)
F)
G)
H)
10 µm 10 µm
100 µm
30 µm 10 µm
100 µm
10 µm 10 µm 100 µm 10 µm 100 µm
30 µm 10 µm
3.3 Impedimetric characterization
By means of EIS technique, the electrochemical parameters of the different nanocomposite electrodes developed have been evaluated. The obtained values for RΩ, Rct and Cdl allow predicting
the electrochemical behavior as function of the amount of nanomaterial (raw NDs, Au@NDs or Ag@NDs) incorporated to the matrix. These properties have been compared to the ones of the bare electrode. The electroanalytical properties required by an electrode are high electron-transfer rate (lower Rct) and the lowest resistance of the solution (RΩ) together with the lowest double- layer
capacitance (Cdl), in order to ensure high sensitivity and high signal-to-noise ratio and, therefore, low
detections limits. The results were obtained by fitting the impedance spectra to an equivalent Randles circuit (see Figure S1, supplementary material). This circuit was sufficiently suitable in order to adjust and obtain the values of RΩ, Rct and Cdl, from the point of view of the interfacial phenomena that takes
places in the electrochemical cell [20]. Results for Au@NDs or Ag@NDs are presented separately.
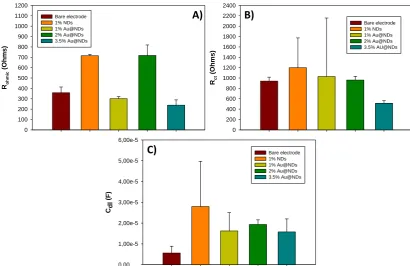
Figure 3 presents the values for RΩ, Rct and Cdl and shows the comparison between the bare
electrode containing 17% graphite and the modified electrodes with 17% graphite plus 1% raw NDs
and 17% graphite plus 1%, 2% and 3.5% Au@NDs. An increase on the electrochemical parameters’
values are observed when 1% of raw NDs are incorporated to the matrix. This increase is associated to the separation in the conductive particles present on the surface electrodes. When it is related to the electrodes with different amounts of Au@NDs, the electrode with 17% graphite plus 3.5% Au@NDs is the one with the lowest ohmic resistance (238.64 Ω) and charge-transfer resistance (513.54
Ω). Regarding the double-layer capacitance values, no significant difference between the three electrode compositions containing gold is observed. According to these results, the one containing 3.5% Au@NDs would be the optimal in this case due to this composition that presents the lowest ohmic resistance, charge-transfer resistance and double-layer capacitance.
Figure 3. Graphs and values for the RΩ (A), Rct (B) and Cdl (C) of electrodes 17% graphite (bare
electrode), 17% graphite plus 1% raw NDs and 17% graphite plus 1%, 2% and 3.5% Au@NDs with their corresponding standard deviation (n = 3). Values were extracted from the adjustment of the impedance spectrum that were obtained in a 0.1 KCl solution with an equimolar concentration of [Fe(CN)6]3- / [Fe(CN)6]4- 0.01 M. Frequencies interval: 100 KHz – 100 mHz.
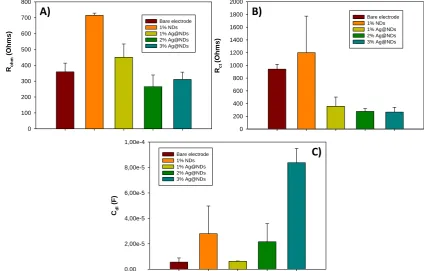
Figure 4 compares the values for RΩ, Rct and Cdl of the 17% graphite electrode, 17% graphite plus
1% raw NDs electrode and 17% graphite plus 1%, 2% and 3% Ag@NDs electrodes. Looking at the resistances values, there is a decrease on the ohmic resistance and charge-transfer resistance when the amount of Ag@NDs increases. The charge-transfer resistance compared to the bare electrode is lower, so the incorporation of the Ag@NDs on the matrix produces an enhancement on the electrode sensitivity and response time. Taking into the account these values, it could be determined that the electrode with 17% graphite plus 2% Ag@NDs would be the optimal composition, but it is necessary to consider the double-layer capacitance values too. There is an increase on this value when the
amount of Ag@NDs increases too. Compared to the bare electrode (5.62·10-6 F), electrode with 2%
Ag@NDs (2.16·10-5 F) has a high value of this parameter (greater than the 1% Ag@NDs, 6.23·10-6 F)
and it could lead to high signal-to-noise ratio or even mask the faradic signal. According to these results 1% Ag@NDs electrode would be the optimal since there is not much difference in the resistance values (RΩ and Rct), and the double-layer capacitance value is half of the 2% Ag@NDs.
Figure 4. Graphs and values for the RΩ (A), Rct (B) and Cdl (C) of electrodes 17% graphite (bare
electrode), 17% graphite plus 1% raw NDs and 17% graphite plus 1%, 2% and 3.5% Ag@NDs with their corresponding standard deviation (n = 3). Values were extracted from the adjustment of the impedance spectrum that were obtained in a 0.1 M KCl solution with an equimolar concentration of [Fe(CN)6]3- / [Fe(CN)6]4- 0.01 M. Frequencies interval: 100 KHz – 100 mHz.
The comparison between the optimal Au@NDs proportion (3.5%) and the optimal Ag@NDs proportion (1%) was made in order to evaluate the effect of both compositions of metallic load. Looking at the RΩvalues it can be seen a slight difference between them, 238.64 Ω for the optimal
with Au@NDs and 450.57 Ω for the optimal with Ag@NDs, that could make the electrode with 1% of
Au@NDs present better sensitivity and low response time. But when is compared the Rct value, for
the Au@NDs electrode (513.54 Ω) is higher than the resistance of Ag@NDs electrode (357.85 Ω). The
Cdl value of the Au@NDs (1.57·10-5 F) electrode is twice the Ag@NDs (6.23·10-6 F) electrode’s
capacitance. For this reason and taking into the account the properties required for electroanalytical purposes, such as a rapid response time, low limit of detection and high sensitivity, the 1% Ag@NDs electrode is better than the 3.5% Au@NDs in terms of electrochemical properties.
3.4. Cyclic voltammetry measurements
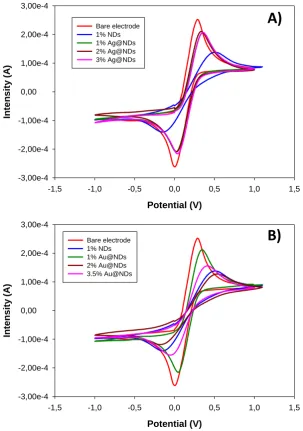
Cyclic voltammograms were taken for the different NDs containing (nano)composite electrodes and have been compared to the bare electrode based on graphite-epoxy (Figure 5).
In Figure 5A we can see the comparison of the cyclic voltammograms regarding with electrodes containing raw NDs and Ag@NDs, and their comparison to the bare electrode. It can be seen a slight difference between the voltamperograms. However, when comparing 1% Ag@NDs electrode to the 1% raw NDs electrode, the oxidation-reduction peaks are closer for Ag@NDs than for raw NDs. If the oxidation peak and the reduction peak are very close to each other, it indicates a macroelectrode array behavior [21], in which the lineal diffusion is dominant. On the contrary, if both peaks are separated one from the other, it indicates a microelectrode array behavior [21,22] and the radial diffusion will control the mass transport. When developing this kind of transducers, the microelectrode behavior is the interesting one since this will provide an optimal particle distribution that at the same time will assure lower noise levels because there is less active area. In this case, the variations from one peak to the other are not very significant (small variations) so it can be concluded that all these electrodes have a microelectrode array behavior.
Figure 5. A) Superposition of the CV obtained for the electrodes 17% graphite, 17% graphite plus 1%, 2% and 3% Ag@NDs. B) Superposition of the CV obtained for electrodes 17% graphite, 17%
graphite plus 1% raw NDs and 17% graphite plus 1%, 2% and 3.5% Au@NDs. Scan rate: 10 mV·s-1.
Potential (V)
-1,5 -1,0 -0,5 0,0 0,5 1,0 1,5
In
te
n
si
ty
(A
)
-3,00e-4 -2,00e-4 -1,00e-4
0,00 1,00e-4 2,00e-4 3,00e-4
Bare electrode 1% NDs 1% Ag@NDs 2% Ag@NDs 3% Ag@NDs
A)
Potential (V)
-1,5 -1,0 -0,5 0,0 0,5 1,0 1,5
In
te
n
si
ty
(A
)
-3,00e-4 -2,00e-4 -1,00e-4
0,00 1,00e-4 2,00e-4 3,00e-4
Bare electrode 1% NDs 1% Au@NDs 2% Au@NDs 3.5% Au@NDs
Figure 5B presents the comparison between the bare electrode and the electrodes modified with different proportions of Au@NDs and raw NDs, obtaining the same trend of the previous case. However, an increase on the amount of Au@NDs is causing an offset between the cathode and anodic peak. The voltemperograms present a behavior more similar to the one with raw NDs than to the bare electrode. In general, these results indicate that the electrodes with different proportions of Au@NDs and Ag@NDs developed present good reproducibility and similar electrochemical behavior.
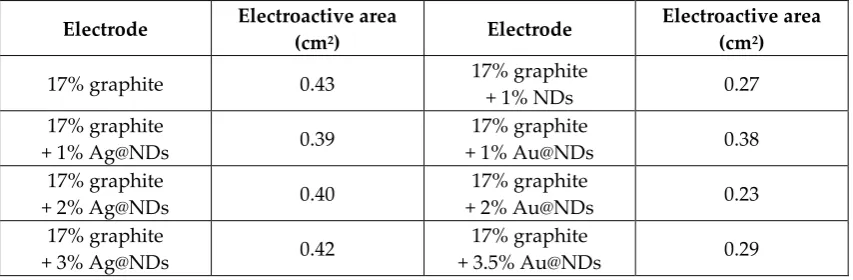
From the cyclic voltamperograms, different parameters as the peak intensity, the separation potential (between the oxidation and reduction peak) and the active area of the electrode can be extracted. The active area of the electrodes can be estimated from the values of the peak intensities obtained by Randles–Sevčik (Equation 5) [20]: where α corresponds to the transference coefficient (0.5), Dred is the diffusion coefficient of the reduced specie (6.32·10-6 cm2·s-1), ʋ is the scanning speed
(0.01 V·s-1), A is the electroactive area and C*red is the bulk concentration of the electroactive species
(0.01 M).
Ip = 3.01 · 105 n3/2(α Dredʋ)1/2 A C*red (5)
The values for the electroactive area of each electrode are listed on Table 2. The bare electrode containing only graphite presents an electroactive area of 0.43 cm2 but when it is modified with a 1%
of eaw NDs there is a decrease on the electroactive area (down to 0.27 cm2) as the NDs are separating
the conductive particles present on the matrix. When the matrix is modified with different proportions of Ag@NDs, there is a clear upward trend: the more Ag@NDs percentage the higher electroactive area the electrode presents. This is due to the incorporation of conducting particles are introduced into the matrix, although this fact modifies the spatial separation and inner distribution of the conductive particles.
Table 2. Values of the electroactive area for the different developed electrodes.
Electrode Electroactive area
(cm2) Electrode
Electroactive area (cm2)
17% graphite 0.43 17% graphite
+ 1% NDs 0.27
17% graphite
+ 1% Ag@NDs 0.39
17% graphite
+ 1% Au@NDs 0.38
17% graphite
+ 2% Ag@NDs 0.40
17% graphite
+ 2% Au@NDs 0.23
17% graphite
+ 3% Ag@NDs 0.42
17% graphite
+ 3.5% Au@NDs 0.29
For electrodes with Au@NDs, it seems that ed higher percentages of Au@NDs are needed to increase the electroactive area with respect to the 1% raw NDs electrode. This may be due to the lager diameter of AuNPs that would separate more the graphite conducting particles in the matrix and thus, reduce the electroactive area. To compensate this problem, it may be necessary a higher percentage of conducting material (Au NPs), to obtain an electroactive area that is similar to the case of 1% raw NDs.
Taking into the account the results obtained by EIS and CV techniques, it is suggested that the nanocomposite modified with 1% of Ag@NDs seems to be the optimal proportion in terms of the electrochemical response features.
3.5. Electroanalytical evaluation
properties of the electrode were evaluated and compared to the ones for the bare electrode. Firstly, the characterization was done by the determination of hydrogen peroxide as model analyte.
3.5.1. Evaluation of the working potential
To study the catalytic effect of introducing small amounts of Ag@NDs in the electrodes matrix, firstly the polarization potential for hydrogen peroxide has to be determined. To do so, a study using linear sweep voltammetry (LSV) technique was carried out at different concentrations of analyte and in absence of analyte for two of the electrodes: the one containing 1% Ag@NDs, which was found to present optimal electrochemical properties, and the one without any modifier (bare electrode).
On Figure S2 (see Supplementary Material) is showed both lineal voltamperograms for electrode containing only the graphite-epoxy (17% graphite) and the Ag@NDs containing electrode (17% graphite plus 1% Ag@NDs). It can be observed that the oxidation of the hydrogen peroxide using the bare electrode is obtained at 900 mV. However, for the electrode modified with Ag@NDs the potential is reduced to 750 mV. So, the introduction of the Ag@NDs in the nanocomposite matrix enhances the electrochemical detection of this analyte reducing the working potential 17%. This fact confers selectivity to the sensor because it decreases the number of species that can be oxidized.
3.5.2. Electroanalytical parameters of response
The electroanalytical parameters of response such as sensitivity and limit of detection have been compared for both sensors (bare and 1% Ag@NDs). Measurements were carried out using hydrodynamic amperometry technique at 750mV as working potential. These measurements were performed by triplicate and the limit of detection (LOD) was calculated as the minimum concentrations that can be experimentally quantified under the experimental conditions. By adding 1% Ag@NDs to the composite transducers, no significant differences have been observed regarding the sensitivity, 0.01µ A·L·mg-1 for bare electrode and 0.09 µ A·L·mg-1 for1% Ag@NDs. A similar trend
is observed regarding to the limit of detection for hydrogen peroxide, 0.068±0.001 and 0.095±0.003 mg·L-1 for bare electrode and 1% Ag@NDs, respectively. However, what this modified electrode offer
is the possibility of working at lower potentials and thus reduce the interferences due to the presence of other analytes that can be oxidized at the same potential, as mentioned previously. The reduction of the working potential is a considerable improvement since one of the main problems of amperometric (bio)sensors is the fact that high working potentials are needed unless a redox mediator is used. The introduction of this kind of nanoparticles could be an alternative to the redox mediators. Besides, this lessen of the polarization potential reduces the possible interferences since at a lower potential less species will be oxidized.
3.6. Evaluation of the analytical response to glucose
Optimized nanocomposites electrodes with 1% Ag@NDs, have been modified with glucose oxidase enzyme in order to evaluate the analytical response to glucose. Firstly, it has been evaluated the working potential for glucose detection after the incorporation of the enzyme by LSV (see Figure S3, Supplementary Material). This study was carried out in presence of glucose after the 1% Ag@NDs electrode was incubated with glucose oxidase for 30 minutes. The results showed that the oxidation potential is to 820 mV. Compared to the working potentials for enzymatic biosensors for glucose determination on the literature, the potential is improved by the incorporation of the nanomaterials from 1050 mV [18] to 820 mV, so it was reduced significantly.
In order to optimize the experimental conditions, an evaluation of the influence of the contact time in the electroanalytical parameters of response has been done. The times studied were 30 min, 1h and 24 h. Figure 6 shows the calibration curve (A) and the linear range (B) for the electrode 17% graphite plus 1% Ag@NDs for an incubation with GOD of 30 minutes and 1 hour. When the electrode
24 hours of contact time are not necessary in order to obtain good sensitivity, low detection limits and a wide linear range.
Figure 6. Response of the 17% graphite plus 1% Ag@NDs electrodes after being mixed with glucose oxidase in the thermomixer for 30 minutes and 1 hour for glucose concentration between 0-60 mM (A). Linear concentration range for t = 30 minutes and t = 1h (B).
On Table 3 are detailed the analytical parameters such as detection limit and sensitivity. It can be determined that there is no significant difference observed on sensitivity and detection limit when the time contact increases from 30 minutes to 1 hour. However, the increase on the contact time produces higher enzyme saturation at lower glucose concentration (Figure 6A). According to these results, and in order to reduce the contact time, 30 minutes were considered as the optimal contact time.
Table 3. Calibration parameters obtained with the hydrodynamic amperometry technique for the electrode 1% graphite + 1% Ag@NDs modified with GOD by direct contact method at different contact time, using glucose as analyte. Experimental error was calculated as confidence interval.
Time Sensitivity
(µA·mM-1) LOD (mM)
Saturation Concentration (mM)
30 min 0.058±0.002 0.08±0.01 12.98
1 h 0.041±0.003 0.08±0.01 7.16
24 h - - 0.70
In order to evaluate the specific adsorption of glucose oxidase on the electrode surface, the bare electrode was incubated for the optimal time of 30 minutes with the enzyme solution. No changes on the current were observed after the glucose additions. So, this means that the specific adsorption of the glucose oxidase on the surface of the electrode only takes place when there are Ag@NDs are incorporated to the electrode matrix, as expected.
4. Conclusions
In this work, nanocomposite sensors containing different proportions of Ag@NDs and Au@NDs were constructed and characterized by means of electrochemical impedance spectroscopy and cyclic voltammetry in order to optimize their analytical response in terms of high signal-to-noise ratio, rapid response and low limit detection. In this sense, EIS and CV allowed us to optimize the nanocomposite composition regarding ohmic resistance (related to percolation theory), charge-transfer resistance (associated to heterogeneous electron-charge-transfer, which depends on the electrochemical active surface) and double-layer capacitance (correlated to the background current and consequently to the signal/noise ratio). In the present work the optimal composition for Au@NDs
[glucose] (mM)
0 10 20 30 40 50 60 70
Cu
rr
en
t (
A)
0,00 0,05 0,10 0,15 0,20 0,25 0,30 0,35
30 min 1 h
[glucose] (mM)
0,0 0,5 1,0 1,5 2,0 2,5 3,0 3,5 4,0 4,5
Cu
rr
en
t (
A)
0,00 0,05 0,10 0,15 0,20 0,25 0,30
present on the nanocomposite matrix is 3.5% and the one for Ag@NDs is 1%. When comparing both optimal modifier compositions, 1% Ag@NDs on the electrode turned out to be the best one since despite presenting a higher ohmic resistance it offered a lower charge-transfer resistance and double-layer capacitance.
The electroanalytical experiments showed that the incorporation of 1% Ag@NDs on the graphite/epoxy matrix allow to reduce the working potential for the hydrogen peroxide from 0.9 V using the bare electrode to 0.750 V that is an important feature in amperometric measurements in order to minimize the interferences.
Good results were obtained in the immobilization of GOD enzyme on the electrode’s surface by
direct contact. The electroanalytical evaluation of glucose using the nancomposite sensor allowed to reduce the working potential from 1050 mV to 820 mV, achieving a good detection limit and sensitivity.
In conclusion, we developed an easy to develop, cheap and robust electrochemical sensor based on nanocomposite material formed of 17% graphite and 1% Ag@NDs. This kind of electrodes could become an universal platform in terms of sensing, as long as the enzymatic reaction taking place on its surfaces produces hydrogen peroxide (any type of oxidase) that will be oxidized directly on the
electrode’s surface. Moreover, further research could be addressed to enlarge this line of interest in terms of a different functionalization of the electrodes’ surface to widen the detection possibilities
and applications.
Supplementary Materials: The following are available online, Figure S1: Scheme of the equivalent circuit. Figure
S2: Linear sweep voltamperograms using hydrogen peroxide as analyte. Figure S3: Linear sweep voltamperogram obtained for the 1% Ag@NDs electrode modified with GOD
Author Contributions: Funding acquisition, Mireia Baeza; Investigation, Raquel Montes, Gerard Sanchez,
Jingjing Zhao, Cristina Palet and Julio Bastos Arrieta ; Project administration, Mireia Baeza; Supervision, Raquel Montes, Cristina Palet, Julio Bastos Arrieta and Mireia Baeza; Writing – original draft, Raquel Montes, Gerard Sanchez, Jingjing Zhao, Cristina Palet, Julio Bastos Arrieta and Mireia Baeza; Writing – review & editing, Raquel Montes, Cristina Palet, Julio Bastos Arrieta and Mireia Baeza.
Funding: This research was funded by Spanish Ministerio de Economía y Competitividad y Fondo Europeo de
Desarrollo Regional (MINECO/FEDER, UE) grant RTI2018-099362-B-C21
Conflicts of Interest: The authors declare no conflicts of interest.
References
1. Baeza, M.; Olivé-Monllau, R.; Esplandiu, M. J. ADVANCES ON RIGID CONDUCTING COMPOSITES FOR ELECTROANALYTICAL APPLICATIONS. In Resin Composites: Properties, Production and Applications; Deborah B. Son, Ed.; Nova Science Publishers, Inc., 2011; pp. 153–211 ISBN 9781612091297. 2. Esplandiu, M. J.; Baeza, M.; Olive-Monllau, R.; Cespedes, F.; Bartroli, J. Development of Tunable Nanocomposites Made from Carbon Nanotubes for Electrochemical Applications. In Advances in Composite Materials for Medicine and Nanotechnology; Attaf, B., Ed.; InTech, 2011; p. 289 ISBN
978-953-307-235-7.
3. Murray, R. W. Nanoelectrochemistry: metal nanoparticles, nanoelectrodes, and nanopores. Chem. Rev.
2008, 108, 2688–720, doi:10.1021/cr068077e.
4. Hugelmann, M.; Hugelmann, P.; Lorenz, W. J.; Schindler, W. Nanoelectrochemistry and nanophysics at electrochemical interfaces. Surf. Sci. 2005, 597, 156–172, doi:10.1016/j.susc.2004.08.045.
5. Mochalin, V. N.; Shenderova, O.; Ho, D.; Gogotsi, Y. The properties and applications of nanodiamonds. Nat. Nanotechnol. 2011, 7, 11–23, doi:10.1038/nnano.2011.209.
Escosura-Muñiz, A.; Guix, M.; Maltez-da Costa, M.; Marin, S.; Merko, A.; Ambrosi, A.; De, A.; Guix, M.; Maltez, M.; Marin, S. Nanomaterials for Electroanalysis. Encycl. Anal. Chem. 2010, doi:10.1002/9780470027318.a9077.
8. Briones, M.; Petit-Domínguez, M. D.; Parra-Alfambra, A. M.; Vázquez, L.; Pariente, F.; Lorenzo, E.; Casero, E. Electrocatalytic processes promoted by diamond nanoparticles in enzymatic biosensing devices. Bioelectrochemistry 2016, 111, 93–99, doi:10.1016/j.bioelechem.2016.05.007.
9. Krolow, Matheus & Hartwig, Carla & Link, G. & Raubach, Cristiane & Pereira, J. & Picoloto, R. & Gonçalves, M. & Carreño, Neftali & Mesko, M. Synthesis and Characterization of Carbon Nanocomposites. In Carbon Nanostructures; 2013; pp. 33–47.
10. Muñoz, J.; Montes, R.; Baeza, M. Trends in electrochemical impedance spectroscopy involving nanocomposite transducers: Characterization, architecture surface and bio-sensing. TrAC - Trends Anal. Chem. 2017, 97, doi:10.1016/j.trac.2017.08.012.
11. Bastos-Arrieta, J.; Montes, R.; Ocaña, C.; Espinoza, M.; Muñoz, M.; Baeza, M. In situ characterization of size, spatial distribution, chemical composition, and electroanalytical response of hybrid nanocomposite materials. In In-situ Characterization Techniques for Nanomaterials; 2018 ISBN 9783662563229.
12. Montes, R.; Bartrolí, J.; Céspedes, F.; Baeza, M. Towards to the improvement of the analytical response in voltammetric sensors based on rigid composites. J. Electroanal. Chem. 2014, 733, 69–76, doi:10.1016/j.jelechem.2014.09.022.
13. Esplandiu, M. J.; Pacios, M.; Cyganek, L.; Bartroli, J.; del Valle, M. Enhancing the electrochemical response of myoglobin with carbon nanotube electrodes. Nanotechnology 2009, 20, 355502, doi:10.1088/0957-4484/20/35/355502.
14. Costentin, C.; Drouet, S.; Robert, M.; Savéant, J.-M. Turnover numbers, turnover frequencies, and overpotential in molecular catalysis of electrochemical reactions. Cyclic voltammetry and preparative-scale electrolysis. J. Am. Chem. Soc. 2012, 134, 11235–11242.
15. Bastos-Arrieta, J.; Muñoz, J.; Vigués, N.; Muraviev, D. N.; Céspedes, F.; Mas, J.; Baeza, M.; Muñoz, M. Intermatrix synthesis of Ag, AgAu and Au nanoparticles by the galvanic replacement strategy for bactericidal and electrocatalytically active nanocomposites. New J. Chem. 2016, 40, 10344–10352, doi:10.1039/C6NJ02468H.
16. Bastos-Arrieta, J.; Muñoz, J.; Stenbock-Fermor, A.; Muñoz, M.; Muraviev, D. N.; Céspedes, F.; Tsarkova, L. A.; Baeza, M. Intermatrix Synthesis as a rapid, inexpensive and reproducible methodology for the in situ functionalization of nanostructured surfaces with quantum dots. Appl. Surf. Sci. 2016, 368, 417–426, doi:10.1016/j.apsusc.2016.01.277.
17. Muñoz, J.; Bastos-Arrieta, J.; Muñoz, M.; Muraviev, D.; Céspedes, F.; Baeza, M. Simple green routes for the customized preparation of sensitive carbon nanotubes/epoxy nanocomposite electrodes with functional metal nanoparticles. RSC Adv. 2014, 4, 44517–44524, doi:10.1039/C4RA07294D.
18. Montes, R.; Bartrolí, J.; Baeza, M.; Céspedes, F. Improvement of the detection limit for biosensors : Advances on the optimization of biocomposite composition. Microchem. J. 2015, 119, 66–74, doi:10.1016/j.microc.2014.11.004.
19. Montes, R.; Céspedes, F.; Baeza, M. Highly sensitive electrochemical immunosensor for IgG detection based on optimized rigid biocomposites. Biosens. Bioelectron. 2016, 78, 505–512, doi:10.1016/j.bios.2015.11.081.
21. Nirmaier, H.‐P. and Henze, G. Characteristic behavior of macro‐, semimicro‐ and microelectrodes in
voltammetric and chronoamperometric measurements. Electroanalysis 1997, 9, 619–624, doi:doi:10.1002/elan.1140090808.