S
TRATHCLYDE
D
ISCUSSION
P
APERS IN
E
CONOMICS
D
EPARTMENT OF
E
CONOMICS
U
NIVERSITY OF
S
TRATHCLYDE
G
LASGOW
A BAYESIAN SPATIAL INDIVIDUAL EFFECTS PROBIT
MODEL OF THE 2010 U.K. GENERAL ELECTION
B
Y
CHRISTA JENSEN, DONALD LACOMBE
AND
STUART MCINTYRE
A Bayesian Spatial Individual Effects Probit Model of the
2010 U.K. General Election
Christa D. Jensen∗, Donald J. Lacombe†and Stuart G. McIntyre‡
Paper presented at the North American Regional Science Conference, Miami, Florida
(November 9-12, 2011)
Abstract
The Conservative Party emerged from the 2010 United Kingdom General Election as
the largest single party, but their support was not geographically uniform. In this paper, we
estimate a hierarchical Bayesian spatial probit model that tests for the presence of regional
voting effects. This model allows for the estimation of individual region-specific effects on
the probability of Conservative Party success, incorporating information on the spatial
relationships between the regions of the mainland United Kingdom. After controlling for
a range of important covariates, we find that these spatial relationships are significant and
that our individual region-specific effects estimates provide additional evidence of
North-South variations in Conservative Party support.
JEL Codes: C11, C21
Keywords: United Kingdom General Election, Bayesian hierarchical modelling, spatial econometrics
∗
Christa D. Jensen, Graduate Research Fellow, Regional Research Institute, Department of
Eco-nomics, West Virginia University, PO Box 6825, Morgantown, WV 26506. Phone: +1 (304) 293-8545;
Fax: +1 (304) 293-6699; [email protected] †
Donald J. Lacombe is Associate Professor of Agricultural and Natural Resource Economics and
Economics and Research Associate Professor, Regional Research Institute, West Virginia University,
886 Chestnut Ridge Road, PO BOX 6825, Morgantown, WV, 26506-6825,+1 (304) 293-8543; Fax: +1
(304) 293-6699, email: [email protected] ‡
Stuart G. McIntyre, Department of Economics, University of Strathclyde, Sir William Duncan
Building, 130 Rottenrow, Glasgow G4 0GE, Scotland, UK; Phone: +44 (0)141 548 3858 (Ext. 3858),
1
Introduction
The Conservative Party won the 2010 General Election in the United Kingdom,
gain-ing the most votes and seats of any sgain-ingle party. In this election, the Conservatives
performed particularly well in some areas of the United Kingdom while performing
par-ticularly poorly in others. The suggestion that United Kingdom voting behaviour is
characterised by region specific effects is not new. Indeed, there was work done in the
1980s by Curtice and Steed, among others, on this very point1.
Until the 1980s, United Kingdom voting outcomes were thought to be characterised
by, or at least approximated by, a uniform national swing. The idea was that a 1 per
cent swing in national support from the Conservative Party to the Labour Party, for
example, would more or less be replicated across the country. In this way, national
opinion or exit polls could be used to predict the outcome of the election. This idea
was typified by the BBC’s “swing-o-meter”, which they used on election night television
programming from the 1950s. What has been clear since the 1980s, is that similarly
situated voters (in terms of class, income, education etc.) in different spatial locations
behaved differently in the polling station. This paper is an attempt to better understand
the regional dimension to this issue.
Johnston and Pattie reconciled modern spatial econometric models with United
Kingdom voting behaviour and voting theory2. Later work by other authors applies
spa-tial econometric methods to understanding the 2005 and 2010 United Kingdom General
Election results3. Cutts and Webber established that party spending on constituency
election campaigns had spillover effects and Jensen et al. found that the incumbency of
Conservative Party candidates exhibited spillover effects. These two studies aside, the
1
John Curtice and Michael Steed, ‘Electoral Choice and the Production of Government: The Chang-ing Operation of the Electoral System in the United KChang-ingdom since 1955’,British Journal of Political Science, 12(3) (1982), 249-98.
2
Ron J. Johnston and Charles J. Pattie,Putting Voters in Their Place: Geography and Election in Great Britain (New York: Oxford University Press, 2006)
3
spatial analysis of United Kingdom voting outcomes is still rare despite the fact that it
is well suited for such an analysis.
In the United Kingdom, and indeed elsewhere, there are numerous reasons to believe
ex-ante that there is a spatial dimension to voting outcomes. The media provides
one explanation for why this might be the case. Local newspapers and media tend to
serve multiple constituencies. For example, Scotland has its own BBC radio station,
BBC news bulletins, a privately run free-to-air television broadcaster with its own news
programming, and a number of newspapers that are only sold in Scotland. In addition,
a number of services that concern voters such as hospitals, policing, and education are
controlled at a more aggregate level than the constituency. A hospital closure in one
constituency can be expected to affect a number of neighbouring constituencies in the
same or a similar way.
This paper examines the effects of a range of economic, socioeconomic, and political
variables on the probability of Conservative Party success in the 2010 United Kingdom
General Election using a hierarchical Bayesian spatial probit model with two spatial
levels: the parliamentary constituency and the region. The model used here accounts
for individual unobserved regional spatial effects to provide robust inferences regarding
model parameters4. This modelling approach provides a new way of estimating regional
effects that recognises the spatial relationship between regions of the United Kingdom.
This is important where neighbouring regions are similarly affected by particular events
or effects, such as an economic downturn, which are expected to inform their electoral
choices.
Our results indicate that several covariates are important in explaining the election
result and that the individual effects across the eleven United Kingdom regions provide
support for the suggestion that unobserved regional spatial effects are an important part
of the modelling strategy. This conclusion is in contrast to a recent contribution in the
4Tony E. Smith and James P. LeSage, ‘A Bayesian Probit Model with Spatial Dependencies’, in
literature by Johnston et al.5 They use a multi-level model approach that does not
model spatial interactions and conclude that regional effects are not important.
Section 2 reviews the literature on regional effects in United Kingdom voting
be-haviour and section 3 discusses the modelling approach adopted in this paper. The
data that are used are then discussed in section 4 before we outline our expectations for
coefficient estimates in section 5. Section 6 discusses the results from our analysis and
section 7 concludes and offers directions for future research.
2
Literature Review
Several articles have reviewed the literature on the spatial analysis of voting behaviour6.
Therefore, this literature review will focus on the discussions surrounding regional
vot-ing effects. The first instances of analyses that try to understand and analyse regional
differences in United Kingdom voting behaviour appeared in the 1980s and 1990s7.
Cur-tice and Steed note that little regional variation was observed in the 1950, 1951, and
1955 United Kingdom General Elections. In the United Kingdom General Elections
between 1955 and 1979, they observe that regional variations in voting began to
man-ifest themselves as a North-South divide of pro-Labour and pro-Conservative support
respectively8.
Two possible explanations that they suggest for these regional differences in voting
patterns are that the North-South economic disparities were growing at the time and
5Ron Johnston, Kelvyn Jones, Carol Propper, and Simon Burgess, ‘Region, Local Context, and
Voting at the 1997 General Election in England’,American Journal of Political Science, 51(3) (2007), 640-654.
6
Johnston and Pattie, Putting Voters in Their Place; Johnston et al. ‘Region, Local Context, and Voting at the 1997 General Election in England’; Ron Johnston, Kelvyn Jones, and Min-Hua Jen, ‘Regional Variations in Voting at British General Elections, 1950–2001: Group-based Latent Trajectory Analysis’, Environment and Planning A, 41(3) (2009), 598-616; Jensen et al. ‘A Bayesian Spatial Econometric Analysis of the 2010 UK General Election’.
7
Curtice and Steed, ‘Electoral Choice and the Production of Government: The Changing Operation of the Electoral System in the United Kingdom since 1955’; Ian McAllister and Donley T. Studlar, ‘Region and Voting in Britain, 1979-87: Territorial Polarization or Artifact?’, American Journal of Political Science, 36(1) (1992),168-199; Ian McAllister, ‘Regional Voting’,Parliamentary Affairs, 50(4) (1997), 641-657.
8Curtice and Steed, ‘Electoral Choice and the Production of Government: The Changing Operation
there were differing spatial impacts of the trade “dividend”. Those areas that benefited
less from greater trade liberalisation became more supportive of the Labour Party, which
favoured protectionism. They also concluded that these regional differences were likely to
continue to deepen. Whether these two explanations for the observed regional differences
in electoral support for particular parties still hold, or whether alternative effects, for
example the growth of distinct regional political cultures in Scotland and Wales and more
generally, regional media diversification, provide better explanations for these effects is
still open for discussion.
McAllister and Studlar analyse the United Kingdom General Elections of 1979, 1983,
and 1987 and find that the observed differences can only partly be explained by region
effects. Using micro–level data, they found that controlling for a range of economic,
socio–economic and political variables greatly reduced the observed differences in voting
patterns in each of these elections. Further, they found that this effect was becoming
stronger over time9. When they use a political attitudes index as the dependent variable,
they find that the region effects weaken, even becoming statistically insignificant in some
regions10.
McAllister argues that regional voting differences have always been present in the
United Kingdom, although he finds that they were exacerbated by tactical voting in
the 1997 United Kingdom General Election. He concludes that “future British General
Elections may have to deal with highly sophisticated regional electorates who vote
in-strumentally...to achieve a very specific outcome”11. This is not the only factor that is
said to exacerbate regional voting patterns.
Many authors note that the voting system that is employed can also exacerbate
re-gional election outcomes12. The “first past the post” electoral system that is employed
9McAllister and Studlar, ‘Region and Voting in Britain, 1979-87: Territorial Polarization or
Arti-fact?’, p. 183
10McAllister and Studlar, ‘Region and Voting in Britain, 1979-87: Territorial Polarization or
Arti-fact?’, p. 185
11McAllister, ‘Regional Voting’, p. 655 12
in the United Kingdom creates electoral bias and an incentive for voters to vote
tacti-cally13. McAllister and Craigie argue that electoral bias creates an incentive for voters
in different regions to vote tactically and in different ways according to the direction
of the electoral bias in their region14. Such tactical voting works to exaggerate party
“stronghold” or “weakhold” effects in different regions. Johnston and Pattie examine the
2010 United Kingdom General Election and suggest that tactical voting is widespread15.
Johnston et al. examine regional voting behaviour in England during the United
Kingdom General Election of 1997. Using a set of custom built regions and
neighbour-hoods along with Parliamentary constituency and household level data, they examine the
spatial level at which voting effects operate. They argue that Parliamentary
constituen-cies are too large to exhibit the kind of “neighbourhood” effects that are commonly
considered to explain voting behaviour and that smaller spatial areas must be
exam-ined. However, they find evidence that regional voting effects consist of an aggregation of
voting effects at smaller spatial scales and suggest that controlling for sub-constituency
differences greatly reduces regional effects16.
A later study by Johnston et al. found that regional effects in the United Kingdom
do exist but that the pattern defies the traditional North–South characterisation for the
Labour and Liberal Democrat Parties. For the Conservative Party they did find a clear
trend of increasing support towards the South17. From the conflicting recent evidence
on regional voting behaviour it is clear that the modelling approach is important. In
the next section we outline the modelling strategy adopted in this paper, and how it
helps us to better understand the regional dimension to voting outcomes in the United
13
David Rossiter, Ron Johnston, Charles Pattie, Danny Dorling, Ian McAllister, and Helena Tunstall, ‘Changing biases in the operation of the UK’s electoral system, 1950–97’, British Journal of Politics and International Relations, 1(2) (1999), 133-64; Michael Thrasher, Galina Borisyuk, Colin Rallings, and Ron Johnston, ‘Electoral Bias at the 2010 General Election: Evaluating its Extent in a Three-Party System’,Journal of Elections, Public Opinion, and Parties, 21(2) (2011), 279-294
14
McAllister, ‘Regional Voting’; Craigie, ‘Regional and National Identity Mobilization in Canada and Britain: Nova Scotia and North East England compared’
15
Ron Johnston and Charles Pattie, ‘Tactical Voting at the 2010 British General Election: Rational Behaviour in Local Contexts?’ Environment and Planning A, 43(6) (2011), 1323-40.
16
Johnston et al. ‘Region, Local Context, and Voting at the 1997 General Election in England’, p.649.
17Johnston et al., ‘Regional Variations in Voting at British General Elections, 1950–2001:
Kingdom.
3
Bayesian Probit Model with Individual Effects
The findings of Johnston et al. would seem to suggest that there is little point in pursuing
any sort of regional voting analysis unless households and neighbourhoods are separately
identified18. We do not include either of these spatial scales in this paper due to a lack
of sub-constituency data and therefore cannot test their conclusions in the context of
the 2010 United Kingdom General Election. Instead, we adopt a different modelling
approach that allows us to examine whether there is an unexplained “regional” voting
effect using a model that includes explicit spatial interaction effects.
In this paper we specify a hierarchical spatial econometric model for eleven regions
of the United Kingdom (see Table 1 for a list of regions). It is hard to argue, especially
with the advent of devolution in Scotland and Wales in 1999, that Scotland and Wales
have not evolved their own distinct political cultures. Jones et al. describe Scotland
and Wales as having “cultural foundations” that are different from England19.
The presence of region specific political institutions with their own regional political
class supports the ex-ante belief that these regions will have political attitudes that
differ from the other regions. We test whether differences in political, economic and
socio-economic characteristics at the constituency level are able on their own to explain
the observed differences in voting behaviour across space. We believe that the approach
taken here is an ideal method for determining whether there are significant regional
effects in United Kingdom voting behaviour. Our approach recognises, as an integral
part of the modelling strategy, that the regions of the United Kingdom do not exist as
spatially independent entities, but instead are closely related with shared experiences.
[Table 1 about here]
18
Johnston et al. ‘Region, Local Context, and Voting at the 1997 General Election in England’
19Kelvyn Jones, Ron Johnston, and Charles Pattie, ‘People, Places, and Regions: Exploring the Use
Models for situations involving spatially dependent limited dependent variables
usu-ally take the form of a spatial autoregressive (SAR) probit model. However, they can
also take the form of a hierarchical Bayesian probit model with a spatially structured
random effects vector20. The advantage of the spatially structured random effects model
compared to the traditional SAR probit model is that this type of model can produce
parameter estimates that allow us to make inferences regarding spatially structured
un-observed effects and how these affect the probability of the Conservatives winning for
each of our eleven United Kingdom regions.
The model is outlined below, where Uik indexes utility in regions i = 1, . . . , m for
individualsk= 1, . . . , ni within each region21. The total number of observations in the
model areN =Pm
i=1ni andwij denotes thei, jth elements of them×m spatial weight
matrixW.
Uik=Xikβ+ξik
ξik=θi+εik
θi=ρ m
X
j=1
wijθj +ui
The model treats the unobserved error component ξik as consisting of a region–
specific componentθias well as an individual effectεik. The regional effect parameter,θi,
captures any unobserved common features for observations located in regioni.
Addition-ally, the region-specific component is modeled as a SAR processθi=ρPmj=1wijθj+ui , whereby the unobserved aspects of the model are spatially correlated, i.e. individuals
located in close proximity (as defined by the W matrix) are likely to be similar as
op-20
Smith and LeSage, ‘A Bayesian Probit Model with Spatial Dependencies’; James P. LeSage and R. Kelley Pace,Introduction to Spatial Econometrics (Boca Raton: CRC Press, 2009), pp. 316-20.
21
posed to individuals that are farther away. In terms of our empirical application, this
model posits that the dependent variable is a function of a set of explanatory variables
plus some unobserved effects that are spatially correlated at theregional level, i.e. the
11 different regions in the United Kingdom. The term “hierarchical” is used in the
description of the model because it accommodates statistical inference at two different
levels of aggregation.
The above model can be expressed in matrix notation as follows:
y =Xβ+ ∆θ+ε
θ=ρW θ+u
u∼N(0, σumIm)
ε|θ∼N(0, V)
V =
υ1In1
. ..
υmInm
∆ = 1i . .. 1m
The model, as illustrated above, can accommodate heterogeneity across thembroader
regions (e.g. our eleven regions in the United Kingdom) by allowing for different
vari-ance scalars, vi, i = 1, . . . m to be associated with each of these regions. The N ×m
matrix ∆ assigns the same effect parameter to each of the ni constituencies in region
i. Specifically, ∆ contains row–elementsi= 1, . . . m that equal one if constituencyi is
located in regionmand zero otherwise. The model interprets the vectorθas indicators
for unobservable or unmeasured region–level influences. As stated before, these effects
are modeled as following a SAR process whereby neighboring regions are associated with
In terms of model interpretation, the coefficient vector β for the explanatory
vari-able matrix X is interpreted in a manner similar to the standard non–hierarchical,
non–spatial probit model. The unobserved effects parameters, θ, are centered on zero
such that regions with positive (negative) effects indicate latent factors that positively
(negatively) affect the probability of conservative success (failure) that are not included
in the explanatory variables matrix X. LeSage and Pace provide additional details
regarding the model, including computational aspects as well as extensions22.
4
Data
The data used in this paper come from a number of different sources. The primary
source is a database collected and published online by Dr. Pippa Norris of Harvard
University, available at http://www.pippanorris.com/. The particular dataset used
in this study is “May 6th 2010 British General Election Constituency Results Release
5.0”. Data on election results and the explanatory variables relating to candidate sex,
candidate race, marginal constituencies, and the percentages of the population that
are in senior occupation positions, married, single parents, white, or students are all
obtained or calculated from this dataset. The marginal variable is a dummy variable
indicating whether or not the previous General Election result in the constituency was a
close race for the Conservative Party. This variable takes on a value of one if the first or
second place finisher was a Conservative Party candidate and the result was decided by
5 per cent or less, i.e. the difference in the percentage of the votes received between the
first and second place candidate was less than 5 per cent in the 2005 United Kingdom
General Election.
Additional data were obtained from the NOMIS (National Online Manpower
In-formation Service) website, accessible athttps://www.nomisweb.co.uk/Default.asp.
The NOMIS dataset accessed and used in this paper is “claimant count - age and
dura-tion”, which provides data on the unemployment benefit claimant count. This dataset
22
is used to provide a measure of long-term unemployed (taken as those who have been
claiming benefits for more than 1 year) as a proportion of total claimants in each
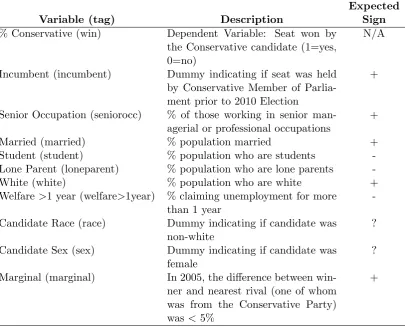
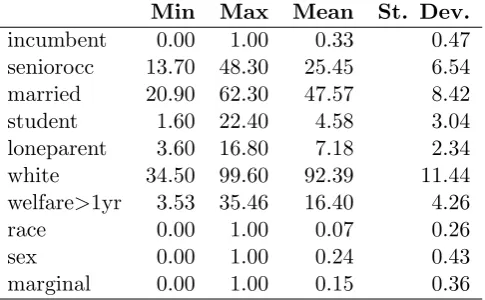
con-stituency. Descriptions of each variable, the expected coefficient signs, and descriptive
statistics are presented below in Tables 2 and 3.
[Tables 2 and 3 about here]
Geographical data came from the Ordnance Survey product “Boundary Line”23.
This product provides detailed geographic information on the boundaries of the eleven
United Kingdom regions and the Parliamentary constituencies that comprise them as
they were in force on 6 May 2010. The spatial weight matrix, W, in our empirical
model is a contiguity–based weight matrix based on the centroid coordinates of the
eleven United Kingdom regions.
A number of seats experienced significant changes in constituency boundaries
be-tween the 2005 and 2010 United Kingdom General Elections. Due to these changes,
data for many explanatory variables are not yet available for the 2010 boundary
defini-tions. For example, data on income and education variables are only available for the
2005 constituency boundaries. For consistency, all of the data used in this analysis are
those available at the 2010 constituency boundaries, and all are studentized, whereby
each variable was transformed by subtracting its mean and dividing by its standard
deviation24.
We chose to exclude the eighteen constituencies in Northern Ireland from our analysis
as the United Kingdom Conservative Party does not directly field candidates in Northern
Ireland. Instead, there is an electoral alliance with the Ulster Unionist Party (UUP) who
field candidates with the understanding that any elected UUP Member of Parliament
will take the Conservative Party whip and could serve in a Conservative Government25.
23More details are available from
http://www.ordnancesurvey.co.uk/oswebsite/products/ boundaryline/.
24We do not studentize the dummy variables in our empirical analysis. 25
We also exclude two additional constituencies from our analysis: Thirsk & Malton
and Buckingham. The election in Thirsk & Malton was delayed by three weeks due
to the death of the United Kingdom Independence Party candidate during the election
campaign. We excluded this constituency to focus our analysis on votes that were cast
simultaneously. The seat of Buckingham was excluded as it was the seat of the sitting
Speaker of the House of Commons, John Bercow Member of Parliament. By convention,
the Speaker is not contested by any of the three main parties when seeking re-election26.
Our analysis was therefore carried out using data on the remaining 630 United Kingdom
Parliamentary constituencies.
5
Prior Expectations
5.1 Covariate effects
The expected signs on each of the covariates can be found in Table 2 and are discussed
individually in this section. Given the well understood advantages of incumbency for
a candidate in an elections, we expect incumbency to exert a positive impact on the
probability that a Conservative candidate win his or her race. Examples of these
advan-tages include name recognition, public funds to employ a staff to promote the incumbent
locally and in the media, and a record in office on which to campaign. Jensen et al.
demonstrate thatincumbency is not only a direct benefit to the incumbent, but also to
their party in neighbouring constituencies27.
The percentage of the electorate in a constituency that are in senior occupations,
seniorocc, is considered to be a good predictor of Conservative Party support28.
Mar-ried voters are similarly thought more likely to support the Conservative Party. For
these reasons we expect positive coefficients on these two variables. In the context of
26
The House of Commons Information Office (HOC), The Speaker, House of Com-mons Information Office Factsheet M2, Available from: http://www.parliament.uk/documents/ commons-information-office/m02.pdf
27
Jensen, Lacombe, and McIntyre, ‘A Bayesian Spatial Econometric Analysis of the 2010 UK General Election’
28
the 2010 United Kingdom General Election there were additional reasons for each of
these groups to vote for a Conservative Party candidate. Of the three main parties
(the incumbent Labour Party, the Conservative Party, and the Liberal Democrats), the
Conservative Party were the only Party to openly call for the future reversal of the
increase in the top rate of personal taxation introduced by the Labour Government
in April 2010. As those working in senior managerial or professional occupations are
likely to be high earners, this decrease in personal taxation rate provides an additional
incentive for supporting the Conservative Party in this election. Also, in advance of the
2010 United Kingdom General Election, the Conservative Party advocated a policy for
the recognition of marriage in the tax system. This proposal was rejected by both the
Labour and Liberal Democrat Parties and increases the incentive formarried voters to
support the Conservative candidate.
The Conservative Party also made a pledge to retain and even increase university
tuition fees. As a result of this pledge, we expect a negative coefficient on the student
variable indicating that the higher the percentage of students in a constituency, the
lower the probability of a Conservative win. The various student demonstrations and
protests that took place after the election and in the days preceding the Parliamentary
vote on the subject signified the strength of feeling among students on this issue.
In the campaign leading up to the 2010 United Kingdom General Election, the
Conservative Party pledged to review the working tax credit and child tax credit systems
that were in operation and made no guarantees about their future. Specifically, they
wanted to see these tax credits ended for middle earners. Lone parents, whether in a
low or middle income level, may have been rightly concerned about reductions in this
state subsidy and accordingly be less likely to vote for the Conservative Party. This,
along with the fact that during their own campaign the Labour Party committed to
retain these tax credits and promised to increase child tax credits by£4 a week for each
child by 2012, leads us to believe that the higher the percentage of lone parents in a
constituency, the lower the probability that the Conservative Party wins the seat.
immigrants allowed into the United Kingdom. The Labour Party opposed this. Instead
they believed the best approach to controlling immigration was through a points system,
similar to that operated by Australia. Immigration was a key issue for voters in the
election campaign. Data released by the Office of National Statistics to the British
current affairs magazine “The Spectator”29 during the election campaign showed that
99 per cent of the jobs created during the Labour Party’s time in office (i.e. since 1997)
and held by people of working age (ages 16-64 for men and ages 15-59 for women) had
gone to foreign born immigrants30.
Polling undertaken by media outlets during the campaign suggested that voters were
more likely to support a party pledging to reduce immigration. In one poll, by pollsters
Harris, 74 per cent of people surveyed thought that there were too many immigrants
and that the incumbent government had been ineffective in addressing this issue31.
Therefore, given that the incumbent Labour government were seen as being ineffective
on this issue, and that the Conservative Party were proposing a fixed cap on immigration,
we expect that the white variable, as a proxy for the non-immigrant population32, will
exert a positive effect on the probability that the Conservative Party candidate wins a
seat.
During the 2010 election campaign, the Conservative Party had a number of billboard
adverts across the country. One of these carried the blunt message: “Let’s cut benefits
for those who refuse work”. This billboard summarised the Conservative position on
welfare reform. Those collecting unemployment benefits are expected to accept work if
29
Fraser Nelson, ‘British Jobs for British Workers...’,The Spectator, (2010), Available from: http:
//www.spectator.co.uk/coffeehouse/5895033/british-jobs-for-british-workers.html.
30
This figure is sensitive to the measure of immigration used. The measure “The Spectator” used is the Eurostat (European Statistics Agency) definition of immigration. The alternative measure, which gives a lower per cent here, is “current nationality”. The former measure considers those with a British Passport who were immigrants to still be immigrants, the latter considers them not to be immigrants once they obtain a British passport.
31
Tim Shipman, ‘Ten-point Lead in Mail Poll Puts Tories on Course for a Majority in Election’, The Daily Mail Newspaper, (2010), Avail-able from: http://www.dailymail.co.uk/news/election/article-1264857/ General-Election-2010-Ten-point-lead-Mail-poll-puts-Tories-course-majority-election. html
32
it is offered, otherwise face reductions in their welfare payments33. It is not hard to see
that this is a message that would be disagreeable to the long term unemployed, therefore
we expect a negative coefficient on thewelfare >1 year variable.
In our analysis, we test whether a marginal constituency involving a Conservative
candidate in the 2005 United Kingdom General Election (i.e. a constituency where the
Conservative Party either won or lost the seat in the 2005 United Kingdom General
Election by a margin of less than 5 per cent) had an effect on the probability that
the Conservative candidate would win that seat in the 2010 United Kingdom General
Election. It seems reasonable to expect that a Conservative voter in a constituency that
was labeled marginal in 2005 would be more likely to vote in the 2010 General Election.
These votes are expected to increase the probability that the Conservative candidate
would win. It is also likely that where the seat was closely fought in the previous election,
party campaigning leading into the present election will be strong (which would be the
rational response of the political parties involved since these are the most “winnable”
seats). Increased spending and activity in a constituency by political parties has been
shown to increase that party’s vote share34.
We do not have a strong expectation in either direction for the variables related to
the candidate’s race or sex. It may be the case that the Conservative Party are more
likely to win a seat if the candidate is female or a minority because it runs counter
to the stereotype of the Conservative Party politician. A female or minority candidate
could appeal to a broader electorate than a white male Conservative candidate and thus
increase the probability of the Conservative Party winning that seat. However, voters
could also be less willing to vote for a female or minority Conservative candidate, in
which case having such a candidate would make the Conservative Party less likely to
win that seat.
33
Welfare payments in this case, and welfare more broadly in this paper, refers to unemployment benefit or job-seekers allowance.
34
5.2 Regional effects
Since Scotland and Wales have their own regional governments, we expect that these
re-gions have developed their own region specific political attitudes and voting behaviours.
We expect that these regions have significant, and in both cases, negative effects on the
probability that the Conservative Party wins a seat. The Conservative Party has not
been particularly successful in either of these regions in recent elections (although they
did win eight seats in Wales in the 2010 United Kingdom General Election).
The North of England has traditionally been a Labour stronghold, the South East a
Conservative stronghold, and the South West dominated by the Liberal Democrats. We
therefore expect that regions in the North and South West of England exert a negative
impact on the chance the Conservative Party wins a seat in the region. Similarly, we
expect the South East of England, the East of England and perhaps the Midlands
(East and West) to exert a positive impact on the probability of the Conservative Party
winning a seat.
In general, we expect that the further South a region is located, the more likely
a Conservative win. Indeed, in the North we expect negative region specific effects,
these effects becoming less negative and possibly turning positive towards the South.
This would be in line with the findings of Johnston et al. and more generally with the
literature on North-South effects in United Kingdom voting behaviour35.
6
Results
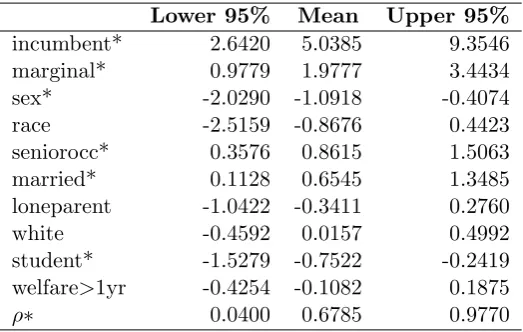
Results from our analysis are presented in Tables 4 and 5. We first note that the Gibbs
sampler was set to run for 51,000 iterations, the first 1,000 of which were discarded to
allow for “burn-in” of the sampler. As is true in all Bayesian analyses, the model allows
for prior values to be used for the parameters. In this case, priors are specified for the
β’s, the error variance σ2, the prior that controls the draws for the individual variance
35Johnston et al., ‘Regional Variations in Voting at British General Elections, 1950–2001:
parameters,vi, and finally, the prior on the spatial autocorrelation coefficient, ρ.
Given that we have no real prior information regarding any of the aforementioned
parameters, we rely on proper priors with relatively uninformative values for each. The
default diffuse parameter values for theβ’s have a mean of 0kand covariance of 1e12×IK
and we use a prior value ofr = 4 for the independentχ2draws for the individual variance
parameters vi, which represents a prior belief in heteroskedasticity. We use a Gamma
prior with values (0,0) for the error varianceσ2, and a Beta (1,1) prior for the spatial
autocorrelation parameter,ρ.
As is standard practice in Bayesian regression analyses, we calculated 95 per cent
credible intervals from the Gibbs samples for the regression coefficients as well as for the
eleven individual regional effects. Those intervals that do not contain zero are considered
“significant” in the sense that the variable is associated with explaining variation in the
dependent variable. We first briefly discuss the results on the explanatory variables but
focus the majority of our results discussion on the results relating to regional effects.
6.1 Covariates
Amongst the ten independent variables used in the regression model, we note that six
variables have 95 per cent credible intervals that do not contain the value zero. The
in-cumbent variable’s positive coefficient estimate is no surprise given the advantages that
incumbency entails. Our analysis also confirms that marginal seats and explanatory
variables indicating voters with “conservative values”, namely seniorocc and married,
exhibited a positive influence on the success of a Conservative candidate. We also find
that the student variable exerts a negative impact on the probability of Conservative
success in a constituency. For reasons discussed in section 5.1, all of these results are
consistent with our prior expectations.
Our results also indicate that if the Conservative candidate was female, the
prob-ability of Conservative Party success in that constituency decreases. This result could
be due to a lack of support for female candidates among conservative leaning voters, or
alternatively, it could represent a “selection” effect whereby female Conservative
candi-dates are more likely to be selected for seats where the Conservative Party is less likely
to win.
6.2 Regional Effects
The main reason for employing this particular modelling strategy is to investigate the
significance, size, and sign of region specific effects on the probability of Conservative
candidate success. The literature has long emphasised the importance of North-South
differences in voting behaviour and electoral outcomes in the United Kingdom. To date
however, no study has examined the issue of region specific effects, or the presence of
regional voting cultures, while incorporating space into the model as we do here. This
makes our results particularly important in the context of this debate.
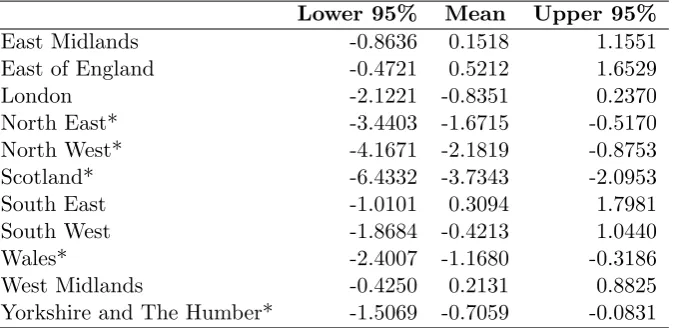
The region specific effects on the probability of the Conservative Party winning a
seat are estimated for eleven regions in the United Kingdom. Of these eleven
region-specific effects, five have 95 per cent credible intervals that do not contain the value
zero, and thus, are considered to be “statistically significant” at the 95 per cent level.
For each of the regions, we calculate the unobserved effects on the probability of the
Conservative Party success in constituencies that comprise the region during the 2010
United Kingdom General Election. Estimates of these regional effects can be found in
Table 5.
[Table 5 about here]
There are no regions that exert a positive and significant influence on the probability
of Conservative success. Where these effects are negative and significant, there is a
negative impact on the probability of the Conservative Party candidate winning a seat
North East and North West of England, Scotland, Wales, and Yorkshire & the Humber.
The largest significant region specific effect is in Scotland at -3.7343 compared to the
region with the smallest significant effect, Yorkshire & the Humber, at -0.7059 .
These results for the regions are broadly in accordance with our prior beliefs, and are
also consistent with the literature on North-South voting effects. In general, the further
North the region, the greater the negative region specific effect on the Conservative
Party’s probability of winning. Perhaps the only surprising result is that we do not
detect any region as having a positive and significant unobserved regional effect on the
probability of Conservative Party success.
We noted earlier that Johnston et al. were skeptical of the presence of regional voting
cultures in the United Kingdom36. Their study focused only on England, ignoring
Scotland, Wales and Northern Ireland. We also do not include Northern Ireland in
our study because of its peculiar political system in which the main United Kingdom
parties do not compete. However, with the advent of Scottish and Welsh devolution
(and the creation of the Scottish Parliament and Welsh Assembly), distinct regional
political cultures have emerged that appear to help explain the results of the 2010
United Kingdom General Election.
7
Conclusions
This paper has explored a new method for examining the regional aspect of United
Kingdom voting behaviour. Using a model developed by Smith and LeSage, we have
examined individual regional effects on the Conservative Party candidate’s chances of
winning a seat in each of the eleven regions in Great Britain37. Our findings provide
evi-dence of a North-South effect in the probability of success in a United Kingdom General
Election for the Conservative Party, controlling for a range of important covariates.
As previously mentioned, it could be that electoral bias or tactical voting are
ex-acerbating regional voting patterns and thus affecting the observed pattern of region
36
Johnston et al. ‘Region, Local Context, and Voting at the 1997 General Election in England’
37
specific results. A better understanding of what is underpinning the observed pattern
of region specific results will be the focus of future research. This research will try to
build on advances in spatial econometric modelling that incorporates the advances
pro-posed by multi-level modelling while explicitly recognising the effects of space on voting
outcomes38. Other future research will look at the issues of electoral bias and tactical
voting as a possible cause for the observed regional individual effects.
38Luisa Corrado and Bernard Fingleton, ‘Multilevel Modelling with Spatial Effects’, University of
Tables
Table 1: List of United Kingdom Regions
Region Names
East Midlands East of England
London North East North West Scotland South East South West
Table 2: Variable Names, Descriptions, and Expected Signs
Expected
Variable (tag) Description Sign
% Conservative (win) Dependent Variable: Seat won by
the Conservative candidate (1=yes, 0=no)
N/A
Incumbent (incumbent) Dummy indicating if seat was held
by Conservative Member of Parlia-ment prior to 2010 Election
+
Senior Occupation (seniorocc) % of those working in senior man-agerial or professional occupations
+
Married (married) % population married +
Student (student) % population who are students
-Lone Parent (loneparent) % population who are lone parents
-White (white) % population who are white +
Welfare >1 year (welfare>1year) % claiming unemployment for more than 1 year
-Candidate Race (race) Dummy indicating if candidate was
non-white
?
Candidate Sex (sex) Dummy indicating if candidate was
female
?
Marginal (marginal) In 2005, the difference between win-ner and nearest rival (one of whom was from the Conservative Party) was <5%
Table 3: Descriptive Statistics
Min Max Mean St. Dev.
incumbent 0.00 1.00 0.33 0.47
seniorocc 13.70 48.30 25.45 6.54
married 20.90 62.30 47.57 8.42
student 1.60 22.40 4.58 3.04
loneparent 3.60 16.80 7.18 2.34
white 34.50 99.60 92.39 11.44
welfare>1yr 3.53 35.46 16.40 4.26
race 0.00 1.00 0.07 0.26
sex 0.00 1.00 0.24 0.43
Table 4: Results for Covariates
Lower 95% Mean Upper 95%
incumbent* 2.6420 5.0385 9.3546
marginal* 0.9779 1.9777 3.4434
sex* -2.0290 -1.0918 -0.4074
race -2.5159 -0.8676 0.4423
seniorocc* 0.3576 0.8615 1.5063
married* 0.1128 0.6545 1.3485
loneparent -1.0422 -0.3411 0.2760
white -0.4592 0.0157 0.4992
student* -1.5279 -0.7522 -0.2419
welfare>1yr -0.4254 -0.1082 0.1875
Table 5: Individual Effects Estimates
Lower 95% Mean Upper 95%
East Midlands -0.8636 0.1518 1.1551
East of England -0.4721 0.5212 1.6529
London -2.1221 -0.8351 0.2370
North East* -3.4403 -1.6715 -0.5170
North West* -4.1671 -2.1819 -0.8753
Scotland* -6.4332 -3.7343 -2.0953
South East -1.0101 0.3094 1.7981
South West -1.8684 -0.4213 1.0440
Wales* -2.4007 -1.1680 -0.3186
West Midlands -0.4250 0.2131 0.8825