1
Codeposition of Cu-Sn from Ethaline Deep Eutectic Solvent 1
2
Swatilekha Ghosh a and Sudipta Roy a,* 3
a School of Chemical Engineering and Advanced Materials, Merz Court, Newcastle 4
University, Newcastle upon Tyne, United Kingdom 5
* Corresponding author: [email protected] 6
7
Abstract 8
Copper and tin have been co-deposited from choline chloride ethylene glycol based deep 9
eutectic solvent (DES) containing CuCl2.2H2O and SnCl2.2H2O. Initially, electrolyte 10
formulation experiments were carried out containing different amounts of copper and tin at a 11
brass cathode in a rotating cylinder Hull cell. It was found that metallic deposits containing 12
copper and tin could be deposited from a DES containing 0.02 M CuCl2.2H2O and 0.1 M 13
SnCl2.2H2O. Polarization scans were carried out to determine the reduction potentials for 14
individual metals and alloys. Anodic stripping voltammetry showed that Sn co-deposits with 15
Cu at -0.36 V, at a lower over-potential than the tin reduction potential. Smooth and bright 16
deposits of thicknesses up to 10 m were obtained at a potential of -0.36 V or by using a current 17
density of -0.87 x10⁻³ A cm-2. XRD analysis showed the formation of mainly Cu
3Sn and some 18
Cu5Sn6. Our results suggest that Sn is co-discharged with Cu at potentials which is noble 19
compared to the reduction potential of the individual metal. 20
21 22
Keywords: Copper-Tin Alloy, electrodeposition, Choline Chloride, Ethaline, Deep Eutectic 23
2 1. Introduction
25
Alloys of Cu and Sn find applications in wear and corrosion protection [1-5], electronic solders 26
[6-12] and, more recently, for shape memory applications [13, 14] and lithium ion batteries 27
[15-17]. The manufacturing process for Cu-Sn alloys employs traditional or automated 28
metallurgical deposition processes [18], vapour deposition [19-21] as well as electrodeposition 29
[1, 6, 12, 15-17, 22-34]. 30
Of these techniques, arguably, the most energy efficient and economic method is 31
electrodeposition using various acidic and alkaline aqueous solutions [1, 6]. However, many 32
of these electrolytes employ cyanides [6] or addition agents [27-33] to improve issues related 33
to deposit microstructure [34-37], which have come under regulatory scrutiny [38]. In addition, 34
aqueous tin plating systems are encumbered with problems such as sludge formation and 35
oxidation of Sn2+ to Sn4+ [1, 6, 30], which can only be avoided if non-aqueous systems are used. 36
These difficulties have led the search for alternative electrolytes [28-31], such as ionic liquids 37
(IL) [39-43]. 38
An IL can be defined as “a mixture consisting solely of cations and anions with a 39
melting point of 100°C and below” [41, 43]. Previous work on Cu-Sn alloy fabrication from 40
ILs have mainly used 1-ethyl-3-methylimidazolium dicyanamide [EMI-DCA] [44, 45], 41
trimethyl-n-hexylammonium [bis[trifluoromethyl]sulfonyl]amide [TMHA-Tf2N] [46, 47], 1-42
ethyl-3-methylimidazolium [bis[trifluoromethyl]sulfonyl]amide or [EMI-Tf2N] [48] melts. In 43
the EMI-DCA based work Cu3Sn nano-brushes were obtained at low current densities, but a 44
detailed understanding of co-deposition was not the focus of that work. 45
In the TMHA-Tf2N based studies, researchers electrodeposited tin from an IL on to a 46
copper substrate at a temperature between 150 - 190ºC. At these temperatures the IL remains 47
stable, but copper from the substrate and plated tin inter-diffuse and form an alloy [46, 47]. 48
3
of reasonably uniform thickness up to a depth of 4 µm [48] with an overall Sn content between 50
40 to 60 wt%. The deposits showed Cu6Sn5, Cu3Sn and Cu10Sn3 intermetallic phases which 51
depended on the applied potential, temperature of the IL and deposition time [47, 48]. The 52
deposition of Cu and Sn could essentially be viewed as an inter-diffusion in the solid state. 53
One IL which may be used to deposit both copper and tin is the choline chloride (ChCl) 54
based system [41, 49-58]. Researchers have deposited both copper [49-52], tin [53-56] and, 55
more recently, Cu-Sn [57, 58] from this system. In addition, choline chloride is available in 56
commercial quantities, is relatively inexpensive, and does not require special chemical 57
purification methods. The other attractive properties are low volatility [41, 59], viscosity [60, 58
61] and reasonably high solubility of both metals [62]. ChCl based ILs are not true ionic liquids, 59
and are termed deep eutectic solventss (DES). A DES consists of C5H14NOCl (choline 60
chloride), along with a hydrogen bond donor (HBD) such as CH4N2O (urea), C2H2O4 (oxalic 61
acid), C3H8O3 (glycerol), CH2(COOH)2 (malonic acid), or C2H6O2 (ethylene glycol) which 62
exhibit a deep eutectic point [41]. Metals are deposited from anhydrous or hydrated metal salts 63
as well as oxides which are dissolved into this DES. 64
While considerable effort has been expended to deposit Cu-Sn alloys [43-47, 57, 58] 65
from different kind of ionic liquids, a comprehensive understanding for Cu-Sn co-deposition 66
is lacking. The most systematic study on alloy electrodeposition from ionic liquids (or room 67
temperature molten salts) has been carried out using chloraluminate salts by Hussey and co-68
workers [63, 64]. They analysed the deposition behaviour for a number of Al-based alloys, 69
such as Cu-Al, Ni-Al and Co-Al plated from BMIM-AlCl3 melts [65]. They found that in the 70
presence of copper and nickel, discharge of Al proceeded at potentials more anodic than its 71
reduction potential. In addition, only the rate of deposition is dependent on the concentration 72
4
behaviour was attributed to the gain in surface energy due to alloy formation [65]. The reaction 74
mechanism for the co-deposition of the two metals is given by: 75
x Cu+ (solv) + 4(1-x) Al
2Cl7- + (3-2x)e- ↔ CuxAl(1-x) + 7(1-x)AlCl4 -76
In this regard they can be compared to under-potential deposition [65] since Al deposition does 77
not at these potentials. 78
Alloy deposition behaviour using ChCl-based ILs, however, is not as well understood. 79
For example, researchers have demonstrated the feasibility of Sn-Ni deposition from choline-80
chloride urea and ethylene glycol [66], and reported Sn content as high as 72% in the deposit 81
along with other inter-metallics and oxide. However, this study focused on determining 82
currents where deposition could be achieved [67], and an in-depth analysis of the co-deposition 83
process was not pursued. A later work on Ni-Zn alloy deposition using choline-chloride urea 84
melts revealed that nickel is the major component in the deposit [68]. A recent paper on Cu-In 85
deposition from ChCl-urea melt investigated the electrochemical and co-deposition behaviour 86
of the individual metals and their alloys [69]. Their study showed that the electrochemical 87
behaviour was complex and, depending on the concentration of individual metal ions and 88
electrode potential, Cu, Cu2In, CuIn or In could be deposited. The authors remarked that this 89
behaviour was indicative of formation of an alloy (or inter-metallic) which was most 90
energetically favourable. These different findings show that further understanding of alloy 91
deposition from DES is required. 92
The aim of this work was to develop a deeper understanding of co-deposition behaviour 93
using ChCl-based DES. For this present study, ethaline, a DES obtained using a 1:2 choline 94
chloride and ethylene glycol mixture (ChCl-2EG), has been chosen to deposit a Cu-Sn alloy. 95
In all deposition experiments hydrated salts were dissolved in the DES, since they are easily 96
available in market and widely used in the plating industry. In order to achieve our aim, a set 97
5
rotating cylinder Hull cell (RCH) have been carried out. A separate set of polarisation 99
experiments were performed to determine the electrochemical behaviour. In these experiments, 100
a Pt rotating disk electrode (RDE) was used. Electrochemical co-deposition behaviour was 101
compared against single metal deposition to determine if alloys were formed at under or over-102
potentials. Anodic stripping voltammetry (ASV) coupled with energy dispersive x-ray (EDX) 103
analysis was performed to verify if metallic deposits were obtained. Finally, co-deposition of 104
Cu-Sn alloys was carried out on a low-carbon steel RDE to achieve 5 to 10 µm deposit 105
thickness. The deposit morphology, elemental composition and crystalline structure were 106
determined using standard materials analyses. 107
108
2. Experimental 109
2.1 Melt Preparation 110
The ethaline melt was prepared by mixing analytical grade choline chloride [C5H14NOCl] and 111
ethylene glycol [C2H6O2] in a 1:2 ratio, which is referred to as ChCl-2EG throughout this text. 112
Choline chloride as received from Sigma-Aldrich (> 98% purity) was used without further 113
purification. This mixture was kept in a thermostatic heater at 40°C and stirred for 24 hours 114
until it formed a colourless liquid. The mixture was then stored in an airtight glass bottle to 115
minimize the interaction with atmosphere. Subsequently, 0.10 M SnCl2.2H2O (Sigma-Aldrich) 116
was added to the melt, which reflects the solubility limit of SnCl2.2H2O in ethaline [56]. 117
Thereafter 0.02, 0.04 or 0.10 M of CuCl2.2H2O was added to the tin salt-ethaline DES. This 118
means that the Cu:Sn ratio were 1:5, 1:2.5 and 1:1 in the different DES. These solutions are 119
termed as 1:5 ChCl-2EG, 1:2.5 ChCl-2EG, and 1:1 ChCl-2EG, respectively, and are listed in 120
6
The use of hydrated copper and tin chloride introduces water in the DES, but this is not 122
necessarily detrimental to the electrodeposition process. Since choline and glycol are 123
hygroscopic, it is difficult to avoid water entering the DES. Secondly, it has been shown that 124
oxygen evolution can stop glycol from reacting at the anode [70]. Thirdly, using hydrated salt 125
allows one to have control over the amount of water being introduced into the DES (typically, 126
8% to 13%) provides a more stable deposition system [49, 56]. In addition, it has been shown 127
that Cu and Sn species present in hydrated and dehydrated DES are the same for water content 128
up to 40% [71-73]. These species are also presented in Table 1. 129
130
2.2 Apparatus 131
2.2.1 Electrolyte Formulation Experiments:
132
Prior to plating, it is important to determine the solvent formulation which allows the co-133
deposition of metals. Therefore, a series of plating experiments were carried out where different 134
compositions of ethaline, i.e. 1:5 ChCl-2EG, 1:2.5 ChCl-2EG, and 1:1 ChCl-2EG were used. 135
These experiments were carried out using a rotating cylinder Hull cell (Rota-Hull) [74, 75]. 136
A Rota-Hull consists of a rotating cylinder cathode, which is separated from the anode 137
by an insulator. It is designed with a particular geometry which allows it to mimic the current 138
distribution of a Hull cell [74]. The use of a rotating cylinder allows one to control mass transfer 139
to the cathode by simply changing the rotation speed [74]. Therefore, this apparatus allows one 140
to deposit metals or alloys at a variety of current densities in a single experiment under 141
controlled mass transfer conditions [75]. An Autolab HT Rota-Hull cell (Eco Chemie B.V) 142
employing a 0.6 cm diameter cylindrical rotating brass electrode and Pt mesh as counter 143
7
at 600 rpm and the operating temperature was 22 + 2 °C. Full detail of the RCH apparatus and 145
the rationale for choice of current density and the rotation speed is provided in the 146
supplementary materials section of this paper. 147
148
2.2.2 Polarisation, Anodic Stripping Voltammetry and Codeposition Experiments
149
Polarisation experiments were carried out in a standard three-electrode cell using a platinum 150
rotating disc electrode (RDE) (Radiometer Analytical), with a Pt mesh as counter electrode. 151
The cell was a jacketed glass vessel, and was maintained at a constant temperature of 25ºC 152
using a recirculation system. A silver wire served as a quasi-reference electrode, which has 153
been established to be stable in these DES under a wide variety of conditions [43, 49, 55,56]. 154
Potential scans were performed using a computer controlled μ-Autolab instrument in a scan 155
range of -1.0 V to +1.0 V and the scan rate was set at 0.01 V s-1. 156
Codeposition experiments were performed in a low-carbon steel disc of 0.9 cm diameter 157
(i.e. 0.64 cm2) using an RDE apparatus. This disc was detachable from RDE which assisted in 158
surface preparation and deposit characterisation. Potentiostatic deposition was performed using 159
the Autolab instrument using a three-electrode system, and galvanostatic plating was carried 160
out using a PL320 constant power supply (Thurlby-Thandar) using a two-electrode set up. In 161
all galvanostatic experiments, the potential of the working electrode was monitored against the 162
reference in order to ensure that the potential of the electrode corresponded to that of the 163
potentiostatic co-deposition experiments. The cell arrangement for these experiments can be 164
found in our earlier publications [49, 56, 61]. 165
166
2.2.3 Deposit Characterisation
8
In order to measure deposit thickness, the substrate surface was masked with lacquer before 168
deposition. After deposition the lacquer mark was removed using acetone, and the thickness of 169
the deposit was obtained using a Olympus ВX41 confocal optical microscope. Four 170
measurements were performed to reduce errors in thickness measurement. A Hitachi S2400 171
Scanning Electron Microscope fitted with an Oxford Instruments Isis 200 Ultra-Thin Window 172
X-ray Detector (for EDX analysis) was used to ascertain deposit morphology and composition. 173
A PANalyticalX'Pert Pro MPD, powered by a Philips PW3040/60 X-ray generator and 174
fitted with an X'Celerator were used for x-ray diffraction measurements. The instrument was 175
operated in a scan range of 5° to 99° (in 2θ scan mode) with a step size of 0.0334o, a nominal 176
time per step of 100 seconds, and using CuKα radiation of 1.54 keV. The scans were performed 177
in ‘continuous’ mode using the X’Celerator RTMS detector. The phase identification of the 178
obtained scans were carried out by the X'Pert accompanying software program PANalytical 179
High Score Plus in combination with the ICDD Powder Diffraction File 2 database (1999), the 180
American Mineralogist Crystal Structure Database (March 2010) and the Crystallography 181
Open Database (September 2011; www.crystallography.net) system. 182
183
2.3 Procedure 184
2.3.1 Electrolyte Formulation Experiments
185
In order to obtain a wide range of current density in the Rota-Hull experiments, the applied 186
current density was varied between -1.0 x 10⁻³ and -1.7 x 10⁻³ A cm-2. The deposition time was 187
set at 180 min to achieve a deposit thickness of at least 3 μm, so that an EDX analysis could be 188
carried out. Since the current density at the Rota-Hull changes from the top to the bottom, the 189
9
is shown in the supplementary material section. The maximum and minimum nominal current 191
densities at the bottom and top of the cylinder were determined to be -2.9 x 10⁻³ A cm-2 and - 192
0.15 x10⁻³ A cm-2 (cf. supplementary material). At the end of a plating experiment the brass 193
substrates were dismounted and were sectioned into four parts. The composition of each section 194
was determined by EDX to check for alloy formation. 195
196
2.3.2 Polarisation and Anodic Stripping Voltammetry Experiments
197
Once the electrolytes useful for co-deposition of the copper and tin were determined, 198
polarisation experiments were carried out using those formulations to further examine their 199
electrochemical behaviour. The RDE rotation rate was fixed at 220 rpm and the scan rate was 200
0.01 V s-1. Polarization scans were also carried out using individual metals, to investigate the 201
individual metal reduction and stripping in the above scan range, using same scan rate, RDE 202
speed and temperature. 203
A further set of anodic stripping voltammetry (ASV) were carried out to probe the 204
potentials at which individual metals or intermetallic compounds were deposited and dissolved. 205
In these experiments deposition was carried out at potentials between -0.33 V to -0.5 V for 3 206
to 10 min duration, which was followed by stripping voltammetry in a scan range between -0.5 207
to +1.0 V at a scan rates 0.01 V s-1. Other experimental parameters were identical to those for 208
the polarisation experiments. 209
210
2.3.3 Co-deposition Experiments
211
Cu-Sn deposits were obtained by either galvanostatic or potentiostatic deposition by depositing 212
at potentials of -0.36 V or a current of -0.87 x 10⁻³ A cm-2. The choice of potential and current 213
10
current lay in the range of current densities explored in the electrolyte formulation experiments 215
(cf. 2.3.1). The RDE rotation rate was fixed at 220 rpm in order to achieve same mass transfer 216
conditions as that obtained at the Rota-Hull system, and deposition time was set at 240 min to 217
obtain a deposit of around 10 μm thick. At the end of each experiment the plated disc was 218
washed with water and acetone and detached from its holder for material analysis. The 219
thickness, composition, morphology and crystalline structure of deposits were determined 220
using standard analytical techniques. 221
222
3. Results 223
3.1 Electrolyte Formulation Experiments
224
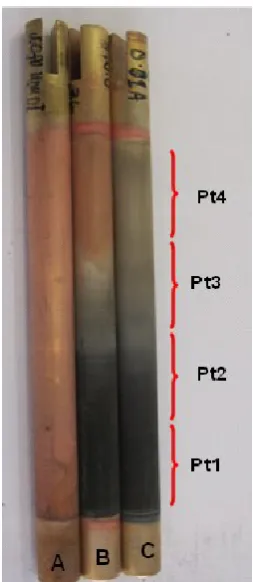
Figure 1 shows the deposits obtained from 1:1 ChCl-2EG, 1:2.5 ChCl-2EG, and 1:5 ChCl-2EG, 225
which correspond to cylinders A, B and C. Sample A shows a smooth red deposit, indicative 226
of only copper deposition. This was confirmed by EDX analysis of all four sections of the 227
deposit. The applied current for this deposition experiment was -1.7 x 10⁻³A cm-2 which means 228
that the current density over the cylinder varied between -4.2 x 10⁻³ to -0.25 x 10⁻³A cm-2. These 229
data show that tin cannot be co-deposited with copper using this electrolyte formulation within 230
this current range. 231
Samples B and C show deposits which change in colour from red to grey which is 232
indicative of Cu as well as Sn deposition. The applied current density was to -1.0 x 10⁻³ and -233
1.2 x 10⁻³A cm-2, respectively. The lower currents are simply due to the lower copper deposition 234
rate corresponding to a lower copper reduction current, since Sn is assumed to be plated at the 235
same rate as before. Visually, the grey colour is observed in the portions where the current 236
density is high, i.e. primarily in sections 3 and 4 for cylinder B and sections 2 to 4 for cylinder 237
11
cylinders B and C, respectively. These data show that Cu-Sn alloys can be co-deposited from 239
these two electrolytes for a current range between -0.15 x 10⁻³ and -3.0 x 10⁻³ A cm-2. The range 240
of alloy composition is larger for 1:2.5 ChCl-2EG and the deposit is smoother; in this regard 241
this particular DES is most appropriate for Cu-Sn co-deposition. 242
EDX analysis for sections 1 and 2 also showed the presence of oxygen (21 at%) and 243
carbon (13 at%) for sample B, with still higher values for sample C. However, in sections 3 244
and 4, where the plating current is lowest, the content of oxygen and carbon was found to be 245
lower. This showed that as the deposition current is raised the amount of Sn, O and C would 246
increase. Although higher Sn contents would be achieved at high currents (or potentials), the 247
deposit would contain oxygen and carbon. Therefore, in order to determine if Sn content could 248
be increased by changing the ratio of copper and tin in the electrolyte, a set of deposition 249
experiments was also carried out with 0.01 M CuCl2.2H2O - 0.1 M SnCl2.2H2O in the DES (i.e. 250
10:1 ChCl-2EG). Although the Sn content in the deposit increased to 80 at%, the deposit was 251
powdery and therefore unsuitable for alloy deposition. 252
From these experimental findings it is clear that co-deposition of Cu-Sn is achievable 253
in a range of electrolyte formulations which contain 1:2.5 ChCl-2EG and 1:5 ChCl-2EG. Since 254
the maximum amount of hydrated SnCl2.2H2O that can be dissolved in ChCl-2EG is 0.1 M, 255
this fixes the amount of copper that can be added to the IL. In this case it also appears that 256
lower current densities are preferable for metallic alloy deposition, especially since deposit 257
properties deteriorate and oxygen and carbon are incorporated in the deposit. 258
259
3.2 Polarization and Anodic Stripping Experiments
12
Figure 2(a) shows the typical polarization scans at a Pt electrode for 1:5 ChCl-2EG, and 1:2.5 261
ChCl-2EG. The figure shows that reduction commences at a potential of -0.33 V, and reaches 262
a plateau current. A second wave commences at a potential -0.5 V, and a second mass transfer 263
limiting current is observed at a potential just above -0.6 V. In the reverse sweep three clear 264
stripping currents are observed. These stripping processes started at a potential of -0.5 V, -0.3V 265
and +0.4 V as marked by A, B and C in Figure 2(a). When the copper concentration in the DES 266
is increased, as is the case for 1:2.5 ChCl-2EG, peak A becomes smaller and peak B becomes 267
larger. The small oxidation peaks appearing to the right of both A and B stripping peaks for the 268
1:5 has been observed during electrodeposition from aqueous systems and is attributed to 269
formation of Cu-Sn interfacial phases [31]. 270
Typical polarisation scans in Pt electrode for ethaline containing individual metals, i.e., 271
CuCl2.2H2O (0.02 M and 0.04 M) and SnCl2.2H2O (0.1 M) are presented in Figures 2(b) and 272
2(c), respectively. Figure 2(b) shows that the first reduction from Cu2+ to Cu+ occurs at +0.45 273
V. The second reduction peak, corresponding to Cu+ reducing to Cu is observed at a potential 274
of -0.33 V. A mass transfer limiting current is observed beyond -0.45 V. Oxidation peaks are 275
observed as the scan is reversed. When the copper content in the electrolyte is doubled, the 276
plateau current is also augmented by the same factor, showing mass transfer control [49]. 277
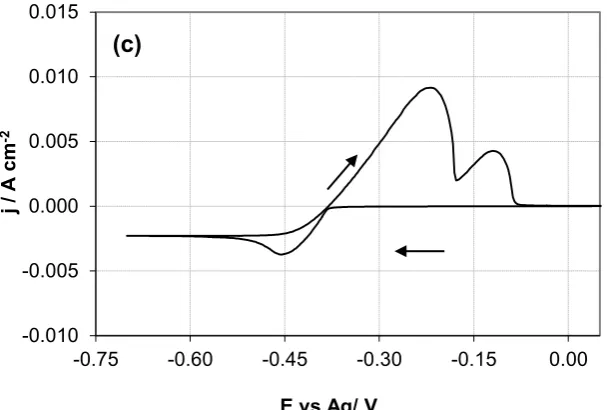
Figure 2(c) shows that Sn is reduced at -0.38 V, an over-potential slightly more cathodic 278
than that for the reduction of Cu+ to Cu. A mass transfer limiting current is again observed at 279
potentials below -0.5 V. The reverse sweep shows two stripping peaks: one at a -0.38 V and 280
another at -0.17 V. In an earlier work [56] these attributed to the oxidation of two different Sn 281
species present in the electrolyte. 282
Comparing the individual metal deposition peaks it is clear that both metals can co-283
reduce in the potential region below -0.38 V and they can both be governed by mass transfer 284
13
correspond to the dissolution of single or both metals, since it is possible to electro-oxidise 286
either a single metal or an alloy phase at these potentials. The decrease in peak height of A with 287
increase in copper content in the DES is indicative that this peak may be associated with tin or 288
tin-rich phases. Peak B, on the other hand, increases when copper content in solution is 289
increased, which indicates that it may correspond to Cu or Cu-rich phases. The third stripping 290
peak (C) can be attributed to the oxidation of Cu+ to Cu2+ [49], since Sn should have been 291
completely stripped at these potentials. Further anodic stripping voltammetry was carried out 292
to determine which metals or phases are stripped in these regions for the 1:2.5 ChCl-2EG 293
electrolyte, because this electrolyte formulation produced the best deposits. 294
295
3.3 Anodic stripping experiments
296
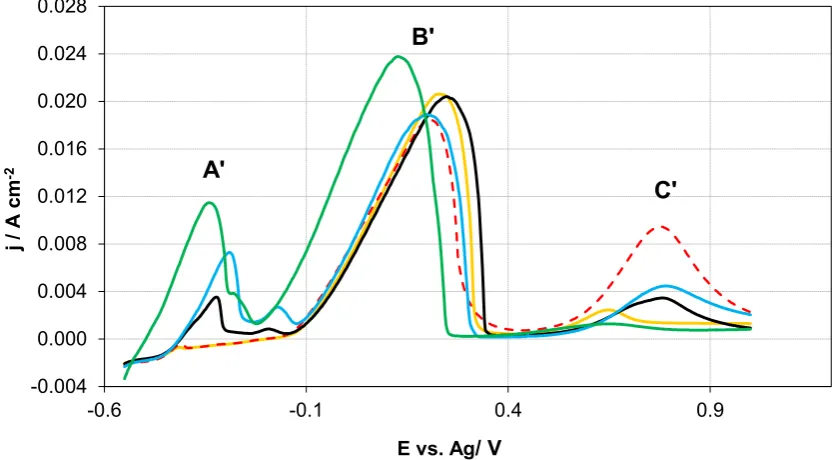
Table 2 lists the potentials used for ASV analysis for a 1:2.5 ChCl-2EG electrolyte, which 297
covers the potential range within which either one or both metals are expected to co-deposit. 298
Figure 3 shows the corresponding stripping voltammograms. Depending on the applied 299
potential for deposition, two or three different stripping peaks are observed. At a potential of -300
0.33 V, peaks are observed corresponding to the positions where peaks B and C were located 301
in the polarisation measurements (cf. Figure 2(a)). These are indicated by B’ and C’ in Figure 302
3. An EDX analysis for the deposit showed that the deposit contained only Cu, as would be 303
expected at these potentials. 304
As the potential is lowered to -0.36 V, the two peaks are again visible at their respective 305
positions, and the total charge under the stripping peaks is higher. An EDAX analysis showed 306
that both copper and tin are present in this deposit. The charge under peak B’ was similar to 307
that observed for -0.33 V, but the charge under peak C’ is increased. This shows that Cu and 308
14
Interestingly, Sn is deposited at -0.36 V, which is nobler compared to the reduction potential 310
of Sn as an individual metal (cf. Figure 2(c)). The co-reduction of Sn could be due to the fact 311
that alloy formation is energetically more favourable. 312
As the deposition potential was lowered further (i.e., -0.4 V, -0.45 V and -0.5 V) a third 313
stripping peak, A’, is observed. The position of A’ is similar to that for peak A shown in Figure 314
2(a). This peak grew more prominent as the potential is lowered, while the charge 315
corresponding to peak B’ remained nearly constant. This indicates that Sn is deposited at 316
potentials below -0.4 V and that peak A in Figure 2(a) is associated with a Sn phase. This is 317
consistent with the reduction potential for Sn (below -0.38 V) obtained in the polarisation data. 318
The small oxidation peak appearing to the right of A’ may be due to the presence of an inter-319
phase between the two Sn-containing phases [34, 35]. 320
EDX analysis of these deposits showed the presence of oxygen and carbon, the 321
quantities of which are listed in Table 2. For deposits obtained at -0.5 V, 9 at% of chlorine was 322
also found along with oxygen and carbon. The presence of these impurities are in agreement 323
with our earlier work on copper deposition, where carbon and chlorine were detected [49], 324
which is attributed to the breakdown of the DES itself. The current findings confirm that low 325
deposition potentials are inappropriate for metallic Cu-Sn co-deposition, since impurities can 326
be incorporated in the deposit. Therefore, further co-deposition experiments were carried out 327
using potentials of -0.36 V or the current corresponding to this potential, i.e. -0.87 x 10⁻³ A cm -328
2. 329
330
3.4 Codeposition experiments
331
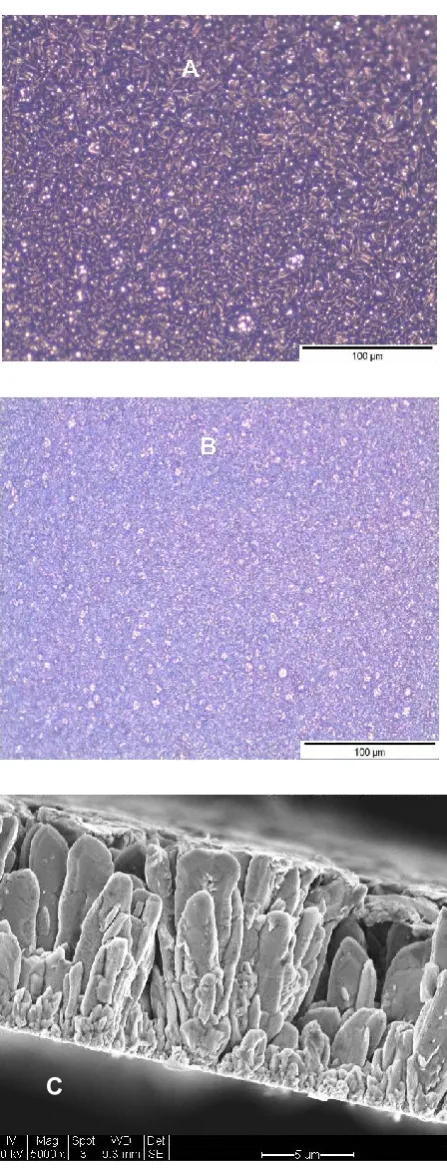
Figure 4(a) and (b) show scanning electron micrographs of a typical deposit obtained 332
15
observed in the micrographs, the deposits are dense and reasonably smooth. It may be expected 334
that the choice of substrates can affect the deposit morphology and microstructure. However, 335
the deposits on the steel substrate using the RDE were similar to those obtained using the 336
RotaHull experiments for cylinders B and C in the region where co-deposition of Cu and Sn 337
occurred. 338
The deposit composition, as determined EDX analysis, showed the Sn content to be 17 339
at% for the potentiostatic experiments and 13 at% for the galvanostatic experiments, 340
respectively. The copper content in the deposit was found to be approximately 83 at% (error in 341
analysis being +10%). Elements such as C, O or Cl were not detected. 342
Deposition was also carried out just below and just above -0.36 V to determine the 343
sensitivity of alloy composition to electrochemical parameters. In agreement with the ASV 344
findings, deposits at potentials of -0.34 V contained only Cu. At deposition potentials of -0.355 345
V, a lower amount of Sn (ca. 2 to 5 at%) was found. For the corresponding galvanostatic 346
experiment carried out at a current density of -0.64 x 10⁻³A cm-2, a similar alloy composition 347
was obtained. At a potential of -0.375 V or the corresponding galvanostatic experiment (-0.095 348
x 10-3A cm-2) increased amounts of oxygen (ca. 20 to 30 at%) was detected. These findings 349
also show that metallic deposits can be attained within a very narrow range of current or 350
potentials and that alloy composition is very sensitive to the applied potential. 351
The film growth rate at a potential of -0.36 V was determined to be 0.035 ± 0.003 μm 352
min-1. Deposit thicknesses up to 10 m could be attained by increasing plating time without 353
compromising deposit quality. The current efficiency for deposition, calculated using charge 354
balances, were found to be 90%. Gravimetric measurements of current efficiency were found 355
16
The morphology of the deposited alloy is similar to that observed for Cu-Sn alloys 357
deposited from aqueous electrolytes without addition agents or under laboratory conditions [24, 358
28, 31, 76] and other ILs [45-47, 57]. The grains near the electrode surface are small, typically 359
of the order of 1 m. The micrograph shows the presence of many nuclei near the substrate 360
interface demonstrating the importance of nucleation in the initial stages of deposition. As the 361
deposit grows, only some of the grains grow larger in the longitudinal direction. This is very 362
similar to electrodeposited Cu-Sn alloys from aqueous systems from MSA electrolytes in bench 363
scale systems [31]. 364
365
3.5 Phase Analysis
366
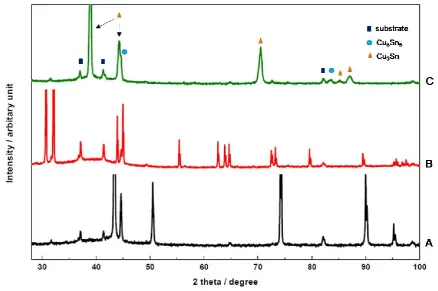
The XRD diffractograms for the Cu-Sn alloys deposited on a stainless steel substrate for the 367
same DES composition and potential as those for Figure 4 are shown in Figure 5. The different 368
peaks of the diffractogram correspond to mainly orthorhombic Cu3Sn [77] and few others for 369
hexagonal Cu6Sn5 [78]. Separate phases for Cu and Sn are absent. When Cu-Sn were co-370
deposited from other ILs, phases similar to Cu6Sn5, Cu3Sn and Cu10Sn3 [45, 47] were found, 371
similar to those obtained from aqueous electrolytes [6, 28, 31, 79, 80]. 372
Since the predominant phase is Cu3Sn, one would expect an atomic ratio of 75:25 for 373
Cu:Sn in the deposit. The EDX data showed a ratio of 80:20 atomic percent for Cu:Sn. The 374
EDX and XRD results, can be considered to be in broad agreement, given that the error in EDX 375
measurement could be as high as 10%. If there is any excess Cu in the deposit, the absence of 376
a peak associated with it may be due to the fact that it is either a disordered structure or it is 377
17
For powder Cu3Sn samples the ratio of intensity (in %) for (021):(002):(121):(231): 379
(331) peaks are 70:100:100:70:70 [77]. The intensity ratios estimated from Figure 5 is 100: 380
12:35:15:10, which shows a polycrystalline structure of mostly (021) orientation. On closer 381
inspection a doublet is observed for the (121) peak. This can be due to presence of Kα1 and 382
Kα2 components in the incident and diffracted beams from the Cu source as 383
monochromatization was not carried out during the XRD scan. 384
The zoomed picture of the doublet and other intense peaks, i.e. (021) and (231) is 385
presented in Figure 6. The average primary crystallite size was determined using these peaks 386
and the Scherrer equation [81]. Crystallite size was determined to be 21 ± 10 nm, against a 387
value of 30 to 100 nm for the aqueous systems [82]. The strain contribution was determined 388
using the same diffraction peaks using the Williamson-Hall method [49, 83]. The strain value 389
was 0.012 ± 0.005, somewhat lower than that for the individual metals plated from the same 390
DES [49, 56]. 391
392
4. Discussion 393
Our findings indicate that alloy deposition from ChCl-2EG produces Cu-Sn compounds, 394
depending on the electrolyte chosen. This is similar to findings of Dale et.al. for Cu-In [69], 395
and Zn-Ni [67] deposition from ChCl based DES. The deposition of Sn proceeds at more noble 396
potentials compared to the reduction potential of the individual metal. This is similar to the 397
case observed for the deposition of Al alloys obtained from imidazolium-based ILs [65]. In this 398
regard, ChCl DES seems to exhibit similarities with imidazolium systems. 399
There are different principles of electrochemical co-deposition which have mainly been 400
18
underpotential deposition of alloys or phases is also possible [85] from aqueous systems. In 402
addition, more recently additional models for electrochemical deposition of alloys based on 403
electrolyte speciation [86] and energetics in the solid state have been proposed [85]. It is 404
interesting to compare the current Cu-Sn deposition system in view of these alternative 405
mechanisms. 406
The electrolyte formulation experiments show that Cu-Sn deposition occurs from a 407
DES containing a particular amount of individual metals. If the concentrations of the individual 408
metals were changed, co-deposition did not occur, or that deposit properties were poor. This 409
may be indicative of electroactive species formed in DES which contains Cu and Sn in the ratio 410
of 3:1, which would lead to the formation of a single compound, Cu3Sn. Such a system would 411
follow the model of Younes and Gileadi [86] where speciation in solution influences the 412
deposition product. 413
The second possibility is that Cu3Sn is formed due to the lowering of overall energy in 414
the solid state due to alloy formation. This is plausible as it has been found that Sn is depositing 415
at potentials more positive to that required for Sn reduction from DES containing only Sn salt. 416
In this case, the two metals may deposit (nearly) independently, but the thermodynamics of the 417
deposit controls the phases formed, as has been suggested for the imidazolium systems [65]. 418
While this does not preclude the formation of an electroactive species as described in the 419
previous paragraph, it does not require it. A differentiation between the two processes will 420
require the identification of multi-metal species in DES as well as a careful assessment of 421
energies of alloy formation, which may be useful avenues of further research. 422
One interesting aspect arising from the result is the unusually high content of oxygen 423
and carbon in the deposited material. These occur at higher currents and potentials, thereby 424
19
previously for copper and tin deposition by our group [49, 56]. There can be a number of 426
reasons for the presence of these elements in deposits: entrapment of electrolyte, co-deposition of
427
oxides and embedment of material can all occur.
428
However, in our earlier work we found that current efficiencies were between 84-95% 429
[49, 56] These measurements were verified using gravimetric, cuolometric as well as thickness 430
measurements. Since the content of oxygen and carbon is relatively high, electrolyte 431
entrapment or embedment of electrolyte within the deposit would have resulted in 432
disagreement between these measurements. In addition, the morphology of more porous 433
material (Cu and Sn [49, 56]) contained less oxygen and chlorine. These elements could also 434
arise from the deposition of oxides or chloride compounds, but these were never detected in 435
our XRD measurements in this work or our earlier work or by any researchers. 436
Figure 7 shows the polarisation data for ChCl-2EG at a Pt RDE. These data show the 437
reaction involving the solvent and show the electrochemical window of ethaline. The figure 438
shows that the IL breaks down below a potential of -0.7 V, as reported previously [30, 46]. 439
However, low currents are observed at -0.4 V, indicating that some degree of break down 440
begins at relatively low potentials. Both Cu, Sn and Cu-Sn are depositing at these potentials, 441
and carbon and oxygen detected in the deposits may be arising from the breakdown of the 442
solvent, which has also been reported by other researchers [70]. Although the currents recorded 443
on Pt are low, it is possible that the process is favoured during Cu-Sn deposition, which will 444
be studied further by our group. 445
446
20
Copper and tin have been successfully co-deposited from a choline chloride ethylene glycol 448
based deep eutectic solvent (DES). It was found that metallic deposits containing copper and 449
tin can be deposited from a DES containing 0.04 M CuCl2.2H2O and 0.1 M SnCl2.2H2O, i.e. 450
1:2.5 ChCl-2EG. Anodic stripping voltammetry showed that Sn co-deposits with Cu at -0.36 451
V, at a potential more noble than the tin reduction potential in the DES. EDX analysis showed 452
that only Cu and Sn are co-deposited at -0.36 V. At higher over-potentials, oxygen, carbon and 453
chlorine were also present. XRD analysis showed the formation of mainly Cu3Sn and some 454
Cu5Sn6 at -0.36 V. Our results suggest that Sn is co-discharged with copper at potentials which 455
are noble (compared to its reduction potential) because alloy formation is energetically 456
favoured. 457
458
Acknowledgement 459
Swatilekha Ghosh acknowledges NUIPS and ORSAS scholarship from Newcastle University. 460
461
References 462
1. M. Jordan, Electrodeposition of Tin-Lead Alloys, in: M. Schlesinger, M. Paunovic 463
(Eds.), Modern Electroplating, 5th Edition, John Wiley & Sons, Hoboken, New Jersey, 464
2010. 465
2. R. Schaefer, J. B. Mohler, U.S. Patent, 1,373,488 (1921). 466
3. G. C. Pratt, International Materials Reviews, 18 (1973) 62. 467
4. A. Knödler, C. J. Raub, E. Raub, Metalloberfläsche, 38 (1984) 496. 468
5. B. Subramanian, S. Mohan, S. Jayakrishnan, Surf. Coat. Technol., 201 (2006) 1145. 469
6. W. E. G. Hansal, Pulse Plating of Tin and its Alloys, in: W.E.G. Hansal and S. Roy 470
(Eds.), Pulse Plating, Leuze Verlag, Bad Saulgau, 2012. 471
7. H. M. Batten, C. J. Welcome, U.S. Patent 1,970,548 (1934). 472
8. S. W. Baier, D. J. MacNaughtan, U.S. Patent 2,511,395 (1950). 473
9. G. J. Jackson, R. Durairaj, N. N. Ekere, Proceedings of Electronics Manufacturing 474
Technology Symposium, 2002. IEMT 2002. 475
10.Y. Qin, G. D. Wilcox, C. Liu, Electrochim. Acta, 56 (2010) 183. 476
11.D. Padhi, S. Gandikota, H. B. Ngyuyen, C. McGruik. S. Ramanathan, J. Yahalom, G. 477
21
12.J.-T. Huang, P.-S. Chao, H.-J. Hsu, S.-H. Shih, Materials Science in Semiconductor 479
Processing,10 (2007) 133. 480
13.M. Ceylan, R. Zengin, Journal Materials Processing Technology, 97 (2000) 148. 481
14.M. Yuasa, K. Kajikawa, M. Hakamada, M. Mabuchi, Materials Letters, 62 (2008) 4473. 482
15.N. Tamura, R. Ohshita, M. Fujimoto, S. Fujitani, M. Kamino, I. Yonezu (2002) J. 483
Power Sources, 107 (2002) 48. 484
16.F.-S. Ke, L. Huang, J.-S. Cai, S.-G. Sun, Electrochim. Acta, 52 (2007) 6741. 485
17.W. Pu, X. He, J. Ren, C. Wan, C. Jiang, Electrochim. Acta, 50 (2005) 4140. 486
18. Z. S. Karim, J. Martin, International Symposium on Microelectronics, Baltimore, MD, 487
2001, pp. 581-587. 488
19.P. Doppelt, T. H. Baum, Chemistry of Materials, 12 (1995) 2217. 489
20.S. Dhabal, T. B. Ghosh, Appl. Surf. Science, 211 (2003) 13. 490
21.R. Z. Hu, Y. Zhang, M. Zhu, Electrochim. Acta, 53 (2008) 3377. 491
22.S. D. Beattie, J. R. Dahn, J. Electrochem. Soc., 150 (2003) C457. 492
23.B. Kim, T. Ritzdorf, J. Electrochem. Soc., 150 (2003) C53. 493
24.G. A. Finazzi, E. M. de Oliveira, I. A. Carlos, Surf. Coat. Technol., 187, (2004) 377. 494
25.D. Radovic, Plat. Surf. Finish., 76 (1989) 52. 495
26.A. N. Correia, M. X. Facanha, P. de Lima-Neto, Surf. Coat. Technol., 201 (2007) 496
7216. 497
27.S. Arai, Y. Funaoka, N. Kaneko, N. Shinohara, Electrochemistry, 69 (2001) 319. 498
28.C. T. J Low, F. C. Walsh, Surf. Coat. Technol., 202 (2008) 1339. 499
29.C. T. J. Low, F. C. Walsh, Electrochim. Acta, 53 (2008) 5280. 500
30.N. Pewnim, S. Roy, Trans. Inst. Metal Finishing, 89 (2011) 206. 501
31.N. Pewnim, S. Roy, Electrochim. Acta, 90 (2013) 498. 502
32.I. A. Carlos, E. D. Bidoia, E. M. J. A. Pallone, M. R. H. Almeida, C. A. C. Souza, Surf. 503
Coat. Technol., 157 (2002) 14. 504
33.A. Survila, Z. Mockus, S. Kanapeckaite, V. Jasulaitiene, R. Juskenas, Electrochim. 505
Acta, 52 (2007) 3067. 506
34.L. F. Senna, S. L. Díaz, L. Sathler, J Appl. Electrochem., 33 (2003) 1155. 507
35.K. N. Pu, Materials Chemistry and Physics, 46 (1996) 217. 508
36.W. J. Boettinger, C. E. Johnson, L. A. Bendersky, K.-W. Moon, M.E. Williams, G.R 509
Stafford, Acta Mater., 53 (2005) 5033. 510
37.T. N. Vorobyova, V. P. Bobrovskaya, V. V. Sviridov, Metal Finishing, 95 (1997) 14. 511
38.M. Tomkiewicz, Environmental Aspects of Electrodeposition, in: M. Schlesinger, M. 512
Paunovic (Eds.), Modern Electroplating, 5th Edition, John Wiley & Sons, Hoboken, 513
New Jersey, 2010 514
39.F. Endres, S.Z.E. Abedin, Phys. Chem. Chem. Phys. 8 (2006) 2101. 515
40.H. Ohno (Ed.), Electrochemical Aspects of Ionic Liquids, John Wiley & Sons, New 516
York, 2005. 517
41.F. Endres, A. P. Abbott, D. R. MacFarlane (Eds.), Electrodeposition from Ionic Liquids, 518
WILEY-VCH, Weinheim, 2008. 519
42.H. Olivier-Bourbigou, L. Magna, D. Morvan, Applied Catalysis A: General, 373 (2010) 520
1. 521
43.A. P. Abbott, K. J. McKenzie, Phys. Chem. Chem. Phys. 8 (2006) 4265. 522
44.Y.-T. Hsieh, I.-W. Sun, Electrochem. Commun., 13, (2011) 1510. 523
45.Y.-T. Hsieh, T.-I. Leong, C.-C. Huang, C -S. Yeh, I.-W. Sun, Chem. Commun., 46, 524
(2010) 484. 525
46.T. Katase, R. Kurosaki, K. Murase, T. Hirato, Y. Awakura, Electrochem. Solid-State 526
22
47.K. Murase, R. Kurosaki, T. Katase, H. Sugimura, T. Hirato and Y. Awakura, J. 528
Electrochem. Soc., 154 (2007) D612. 529
48.K. Murase, A. Ito, T. Ichii and H. Sugimura, J. Electrochem. Soc., 158, (2011), D335. 530
49.S. Ghosh, S. Roy, Surf. Coat. Technol., 238 (2014) 165. 531
50.C. D. Gu, Y. H. You, X. L. Wang, J. P. Tu, Surf. Coat. Technol., 209 (2012) 117. 532
51.T. Tsuda, L. E. Boyd, S. Kuwabata, C. L. Hussey, J. Electrochem. Soc., 157 (2010) F96. 533
52.A.-M. J. Popescu, V. Constantin, M. Olteanu, O. Demidenko, Rev. Chim., 62 (2011) 534
626. 535
53.S. Salome, N. M. Pereira, E. S. Ferreira, C. M. Pereira, A. F. Silva, J. Electroanal Chem., 536
703 (2013) 80. 537
54.C. D. Gu, Y. J. Mai, J. P. You, J. P. Tu, J. Power Sources, 214 (2012) 200. 538
55.A. P. Abbott, G. Capper, K. J. McKenzie, K. S. Ryder, J. Electroanal. Chem., 599 (2007) 539
288. 540
56.S. Ghosh, S. Roy, Journal of Material Science and Engineering: B, 190 (2014) 104. 541
57.A. Alhaji, “Electrodeposition of Alloys from Deep Eutectic Solvents”, PhD Thesis, 542
University of Leicester, Leicester, UK (2011). 543
58.S. Ghosh, “Electrodeposition of Cu, Sn and Cu-Sn Alloy from Choline Chloride Ionic 544
Liquid”, PhD Thesis, Newcastle University, Newcastle-upon-Tyne, UK (2013). 545
59.W. Simka, D. Puszczyk, G. Nawrat, Electrochim. Acta, 54 (2009) 5307. 546
60.A. P. Abbott, G. Capper, D. L. Davies, R. K. Rasheed, P. Shikotra, Inorg. Chem., 44 547
(2005) 6497. 548
61.S. Ghosh, K. S. Ryder, S. Roy, Trans. Ins. Met. Finishing, 92 (2014) 41. 549
62.A. P. Abbott, G. Capper, D. L. Davies, R. K. Rasheed, V. Tambyrajah, Chem. Commun., 550
2003, 70. 551
63.B. J. Tierney, W. R. Pitner, J. A. Mitchell, C. L. Hussey, G. Stafford, J. Electrochem. 552
Soc., 145 (1998) 3110. 553
64.Q. Zhu, C.L. Hussey, J. Electrochem. Soc., 148 (2001) C395. 554
65.Q. Zhu, C.L. Hussey, G.R. Stafford, J. Electrochem. Soc., 148 (2001) C88. 555
66.A. Florea, L. Anicai, S. Costovici, F. Golgovici, T. Visan, Surf. Interface Anal., 42 556
(2010) 1271. 557
67.L. Anicai, A. Petica, S. Costovici, P. Prioteasa, T. Visan, Electrochim. Acta, 114, (2013) 558
868. 559
68.H. Y. Yang, X. W. Guo, X. B. Chen, S.H. Wang, G. H. Wu, W. J. Ding, N. Birbilis, 560
Electrochim. Acta, 63 (2012) 131. 561
69.J. C. Malaquias, M. Steichen, M. Thomassey, P. J. Dale, Electrochim. Acta, 103 (2013) 562
15. 563
70.K. Haerens, E. Matthijs, K. Binnemans, B.-V. der Bruggen, Green Chem., 11 (2009) 564
1357. 565
71.P. de Vreese, N. R. Brooks, K. V. Hecke, L. V. Meervelt, E. Matthijs, K. Binnemans, 566
R. V. Deun, Inorg. Chem., 51 (2012) 4972. 567
72.G. Li, D. M. Camaioni, J. E. Amonette, Z. C. Zhang, T. J. Johnson, J. A. Fulton, J. Phys. 568
Chem. B, 114 (2010), 12614. 569
73.M. Currie, J. Estager, P. Licence, S. Men, P. Nockemann, K.R. Seddon, M. Swadźba-570
Kwaśny, C. Terrade, Inorg. Chem., 52 (2013) 1710. 571
74.C. Madore, “Analyse Théorique et Réalisation Pratique de Nouveaux Dispositifs 572
Expérimentaux Pour L’étude de la Distribution des Courants Partiels Lors 573
d’électrodeposition D’alliages” These No. 1189, Ecole Polytechnique Federale de 574
Lausanne (1993). 575
75.C. Madore, D. Landolt, C. Haßenpflug, J.A. Hermann, Plat. Surf. Finish., 82 (1995) 576
23
76.Y. Sürme, A. A. Gürten, E. Bayol, E. Ersoy, J. Alloy Compounds, 485 (2009) 98. 578
77.[ICDD reference code 00-006-0621], I. Isajcev, Zh. Tekh. Fiz. 17 (1947) 829. 579
78.[ICDD reference code 00-047-1575], B. Peplinski, Federal Inst. for Material Research 580
and Testing, Berlin, Germany, Private Communication (1995). 581
79.W.M. Tang, A.-Q. He, Q. Liu, D.G. Ivey, Trans. Nonferrous Met. Soc. China. 20 (2010) 582
90. 583
80.H.-C. Shin, M. Liu, Adv. Funct. Mater., 15 (2005) 582. 584
81.P. Scherrer, Göttinger Nachrichten Gesell. 2 (1918) p 98. (as referred to in B.D. Cullity, 585
S.R. Stock, Elements of X-ray Diffraction, 3rd Ed, Prentice Hall, 2001, pp. 167-171). 586
82.C. Han, Q. Liu, D.G. Ivey, Electrochim. Acta, 54 (2009) 3419. 587
83.G. K. Williamson, W. H. Hall, Acta Metall., 1 (1953) 22. 588
84.D. Landolt, Electrochim. Acta, 39 (1994) 1075. 589
85.Y. D. Gamburg and G. Zangari, Theory and Practice of Metal Electrodeposition, 590
Springer, New York (2011), pp. 219-225. 591
86.O. Younes-Metzler, L. Zhu, E. Gileadi, Electrochim. Acta, 48 (2003) 255. 592
24 Figure Captions
594
Figure 1: Electroplated cylinders from RCH cells for different ethaline DES formulations. (A) 595
1:1 ChCl-2EG, (B) 1:2.5 ChCl-2EG, and (C) 1:5 ChCl-2EG. The cylinders were sectioned into 596
four parts which are marked in the figure. The current density across each of these sections 597
were as follows: Pt1: 2.5iAvg, Pt2: 1.0iAvg, Pt3: 0.3iAvg, Pt4: 0.15iAvg, where iAvg is the applied 598
current. 599
Figure 2: Cyclic voltammograms for co-deposition from (a) ―1:5 ChCl-2EG ; – – -1:2.5 600
ChCl-2EG at a Pt RDE rotating at 220 rpm. The scan rate is 0.01 V s-1 and scan direction is 601
shown by the arrows. Voltammetry for individual metal deposition (b)―0.02 M CuCl2.2H2O; 602
– – 0.04 M CuCl2.2H2O (c) ― 0.1 M SnCl2.2H2O using the same experimental conditions. 603
Figure 3: Anodic stripping voltammograms for deposits plated from with 1:2.5 ChCl-2EG at 604
Pt RDE, at potentials listed in Table 2 ; ▬0.33 V, – – 0.36 V, ▬ 0.40 V, ▬ 0.45 V ▬0.5 V. 605
Stripping was carried out at a rotation speed of 220 rpm and a scan rate 0.01 V s-1. 606
Figure 4: SEM micrographs of Cu-Sn deposits on stainless steel substrates from 1:2.5 ChCl-607
2EG electrolyte: (a) applied potential of - 0.36 V and (b) a current density of -0.87 x 10⁻³ A cm -608
2 . The total time of deposition was 4 hours and the RDE speed was 220 rpm. (c) Typical 609
deposit cross-section after plating for 4 hours. 610
Figure 5: XRD diffractograms of individual metals and alloy plated from ChCl-2EG DES. 611
Trace (A) Cu plated from DES containing 0.04 M CuCl2.2H2O, (B) Cu-Sn deposited using the 612
conditions shown in Figure 4(c), and (C) Sn plated from DES containing 0.1 M SnCl2.2H2O. 613
Figure 6: Zoom of the most intense peaks for Cu3Sn from the XRD diffractogram shown in 614
Figure 5 which were used to calculate grain size and strain. The peaks are (a) (021), (b) (121), 615
and (c) (231). 616
617
Figure 7: Potential scan showing electrochemical window of ethaline at Pt RDE, scan rate 30 618
mV/s, 25 °C at an RDE; (....) 100 rpm, (—–) 2500 rpm. 619
25 Table 1
622 623
Nomenclature, composition and metal salts used in the experiments. The speciation of copper 624
and Sn in the IL are also shown. 625
626
Choline Chloride
(M)
Ethylene Glycol
(M)
Copper CuCl2.2H2O
(M)
Tin SnCl2.2H2O
(M)
Nomenclature
1.0 2.0 0.02 0.1 1:5 ChCl-2EG
1.0 2.0 0.04 0.1 1:2.5 ChCl-2EG
1.0 2.0 0.1 0.1 1:1 ChCl-2EG
Speciation in DES [CuCl3] -[CuCl4]
2-[SnCl3]- [Sn2Cl5] -627
628
Table 2 629
Potentials, charge under stripping peaks and EDX analysis for electrodeposits used in the 630
ASV analysis for a 1:2.5 ChCl-2EG DES. 631
632
633 634 635
636
637
638
639
640 Potential
(V)
Calculated charge under stripping peaks
(C)
Carbon content as
per EDX analysis
(at%)
Oxygen content as
per EDX analysis
(at%)
Peak A Peak B Peak C
- 0.33 - 0.50 0.04 - -
- 0.36 - 0.45 0.23 - -
- 0.40 0.03 0.40 0.10 12 20
- 0.45 0.09 0.40 0.14 23 30
26 641
[image:26.595.234.361.107.399.2]642
Figure 1: Electroplated cylinders from RCH cells for different ethaline DES formulations. (A) 643
1:1 ChCl-2EG, (B) 1:2.5 ChCl-2EG, and (C) 1:5 ChCl-2EG. The cylinders were sectioned into 644
four parts which are marked in the figure. The current density across each of these sections 645
were as follows: Pt1: 2.5iAvg, Pt2: 1.0iAvg, Pt3: 0.3iAvg, Pt4: 0.15iAvg, where iAvg is the applied 646
current. 647
27 649
650 651 652 653
654 655
-0.006 -0.003 0.000 0.003 0.006 0.009 0.012 0.015
-1.2 -0.8 -0.4 0.0 0.4 0.8 1.2
j /
A
cm
-2
E vs Ag/ V A B
C (a)
-0.001 -0.0005 0 0.0005 0.001 0.0015 0.002
-0.8 -0.6 -0.4 -0.2 0 0.2 0.4 0.6
j /
A
cm
-2
E vs Ag/ V
28 656
[image:28.595.142.446.76.281.2]657
Figure 2: Cyclic voltammetry data at a Pt RDE rotating at 220 rpm. The scan rate is 10 mV/s 658
and scan direction is shown by the arrows. 659
(a) ―1:5 ChCl-2EG ;– – -1:2.5 ChCl-2EG ; (b)―0.02 M CuCl2.2H2O; – –0.04 M 660
CuCl2.2H2O (c) ― 0.1 M SnCl2.2H2O 661
662
-0.010 -0.005 0.000 0.005 0.010 0.015
-0.75 -0.60 -0.45 -0.30 -0.15 0.00
j /
A
cm
-2
E vs Ag/ V
29 663
664
[image:29.595.85.504.142.372.2]665
Figure 3 : Anodic stripping voltammetry with 1:2.5 ChCl-2EG at Pt RDE at a rotation speed 666
of 220 rpm and scan rate 10 mV/s. Potentials used : (▬)0.33 V, (– –)0.36 V, (▬)0.4 V, 667
(▬)0.45 V, (▬)0.5 V 668
669 670 671 672 673 674 675 676 677 678 679 680
-0.004 0.000 0.004 0.008 0.012 0.016 0.020 0.024 0.028
-0.6 -0.1 0.4 0.9
j /
A
c
m
-2
E vs. Ag/ V
A'
B'
30 681
682
[image:30.595.195.419.65.651.2]683 684
Figure 4: SEM micrographs of Cu-Sn deposits on stainless steel substrate from 1:2.5 ChCl-685
2EG electrolyte: (a) applied potential of - 0.36 V and (b) a current density of -0.87 x 10⁻³ A cm -686
2. The total time of deposition was 4 hours and the RDE speed was 220 rpm. (c) Typical deposit 687
cross-section after plating for 4 hours. 688
689 690
31 691
[image:31.595.79.518.75.366.2]692
Figure 5: XRD diffractograms of individual metals and alloy plated from ChCl-2EG DES. 693
Trace (A) Cu plated from DES containing 0.04 M CuCl2.2H2O, (B) Cu-Sn deposited using the 694
conditions shown in Figure 4(c), and (C) Sn plated from DES containing 0.1 M SnCl2.2H2O. 695
32 697
[image:32.595.98.511.74.397.2]698 699
Figure 6: Zoom of the most intense peaks for Cu3Sn from the XRD diffractogram shown in 700
Figure 5 which were used to calculate grain size and strain. The peaks are (a) (021), (b) (121), 701
and (c) (231). 702
33 722
723
[image:33.595.77.513.99.391.2]724 725
Figure 7: Potential scan showing electrochemical window of ethaline at Pt RDE, scan rate 30 mV/s, 726
25 °C at an RDE; (....) 100 rpm, (—–) 2500 rpm. 727
-0.003 -0.002 -0.001 0.000 0.001 0.002 0.003
-1.1 -0.6 -0.1 0.4 0.9 1.4
j /
A
cm
-2