Two-dimensional optical coherence tomography for
real-time structural dynamical characterization
Jianfeng Zhong,1 Shuncong Zhong,1,2,*, Qiukun Zhang1 and Ligang Yao1 1 Laboratory of Optics, Terahertz and Non-destructive Testing, School of Mechanical Engineering and Automation, Fuzhou University, Fuzhou 350108, P. R. China
2 Fujian Key Laboratory of Medical Instrument and Pharmaceutical Technology, Fuzhou 350108, P.R. China
Correspondence: [email protected]
Abstract: We present a two-dimensional optical coherence vibration tomography (2DOCVT)
system with an ultra-precision displacement resolution of ~0.1 nm that is capable of in site real-time absolute displacement measurement of structural line vibrations. Experimental results of sinusoidal, sweep and impulse vibrations were reported. The key figures of merit such as the 2DOCVT system could obtain fast line vibration measurement without scanning and it also could be used to capture structural modal parameters in one single impulse excitation measurement without any vibration excitation input information, making it attractive for the application in low-frequency vibration measurement and response-only modal analysis.
Key words: Two-dimensional Optical Coherence Tomography, absolute displacement measurement
1. Introduction
modulation (or phase unwrapping) techniques, at the cost of increased instrument complexity and decreased measurement accuracy (related to the inherent phase shift error) [14]. On the other hand, laser Doppler vibrometre directly measures the velocity of a sample although the displacement information is an analog integration of the velocity signal along the time axis [22-23]. However, such analog integrators always require a high pass filtering of the velocity signal. Thus DC measurements are not possible, but are limited in their dynamical range and additional errors are added to the calibration chain of the system [23]. For digital decoder, laser Doppler vibrometre can retrieve displacement by directly extracting the phase [23]. We report a two-dimensional Fourier-domain optical coherence vibration tomography (2DOCVT) system and experimental demonstration of absolute displacement measurement of line vibrations in real time by directly measuring the displacement of structures using the home-made system. Different from the phase-sensitive OCT, the digital-decoding laser Doppler vibrometre and other interferometer techniques, the 2DOCVT system is based on the accurate amplitude not on the unwrapped phase value of the FFT of spectral interferogram. Additionally, the 2DOCVT could also work as a traditional OCT which could quantify inner structure information of static samples, like OCVT. The distinguished feature of the 2DOCVT system is that it could measure a series number of points in the vibrating structure simultaneously without scanning which is the major difference with the OCVT system in which point-by-point scanning will be necessary if one wants to obtain a line vibration.
2. Two-dimensional Optical Coherence Vibration Tomography
In the Fourier-domain optical coherence vibration tomography, a spectral interferogram is recorded from a reference electric field Er and an electric field Es reflected/scattered from the
surface of the sample. The spectral interferogram I λ, y, t can be expressed as
, , | , , | | , , | 2|E λ, y, t E λ, y, t | cos Δϕ λ, y, t (1)
where λ is the wavelength of the source light, y is the coordinate of the line focus on the vibrating sample, t is time, and Δϕ λ, y, t is a phase term resulting from the optical path length difference ΔΖ y, t between the reference and the sample arm as
Δϕ λ, y, t ϕ λ, y, t ϕ λ, y, t 4πnΔΖ y, t λ⁄ (2)
The Fast Fourier Transform (FFT) of each measured spectral interferogram provides us the surface position (i.e. ΔΖ y, t ) which is a function of t in y coordinates in line. For a static sample, that is, when time t in Eq. (1) is a constant, the system could be worked as a traditional optical coherence tomography [24-26]. For a single-point vibration measurement using a spectroscopy, such as OCVT system [5], the coordinate of the line focus y in Eq. (1) is a constant as well. That means that if the OCVT system wants to measure a line vibration of a structure, the time-consuming scanning will be necessary. Furthermore, the changing environment will affect the vibration acquisition during the point-by-point measurement. For our 2DOCVT system, the line vibration could be obtained in one single measurement which means all the point vibrations of the line were acquired simultaneously.
Due to signal leakage effects [27], the amplitude, phase and frequency calculated from the FFT of the measured spectral interferogram are normally different from the real one even in the absence of noise. Applying windowing functions to the measured spectral interferogram is a common method to minimize the effect of leakage. However, theoretically, the maximum relative error of the amplitude estimation will be 36.4% and 15.3% respectively, when Rectangle and Hanning windows are employed to minimize leakage [28]. When Hanning window is used in the FFT of a measured spectral interferogram, a spectral center correction method (SCCM) [27] could be used to obtain almost exact determination of signal parameters such as frequency and amplitude, etc.
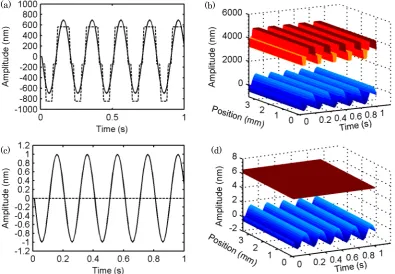
Fig.2 (c). Fig.2 (d) is the corresponding line vibration for 1 nm sine vibration. From the simulation results, the displacement resolution for the developed 2DOCVT system, which is better than 0.1 nm, could be achieved.
3. Experiments and discussions
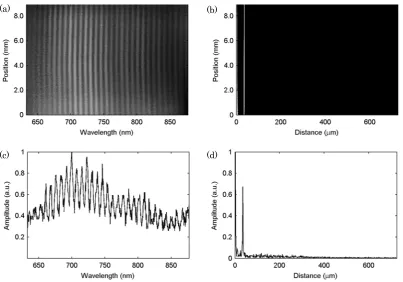
Fig.3 (a) showed the interferogram of ‘‘sample image’’ and ‘‘reference image’’ in the cylindrical line focus for a static sample. The overall length of line focus was 8.92mm which covered 465 CCD pixels in width; therefore, the longitudinal resolution was 19.18μm. Fig.3 (b) was the corresponding FFT of the interferogram shown in Fig.3 (a). The line located at the position of 35.2μm indicated the surface position of the sample and it means that there was an optical path distance of 35.2 μm between the sample and the reference. Fig.3 (c) showed the OCT spectral interferogram from No. 400 pixel of the CCD camera and its corresponding FFT result showed the surface position of the sample at 35.2 μm. In the meanwhile, it can be seen from Fig.3 (b), the line at 35.2 μm was almost a straight line which indicated that the sample has a flat surface. Therefore, the developed system had the capability in surface characterization and assessment.
The measured spectrum had a center wavelength of λ0=705nm and a full width at half-maximum (FWHM) of Δλ=136nm. The axial resolution of the 2DOCVT system for internal imaging was calculated to be 1.163μm in air, using the expression of 2ln2λ02⁄πΔλ [25].
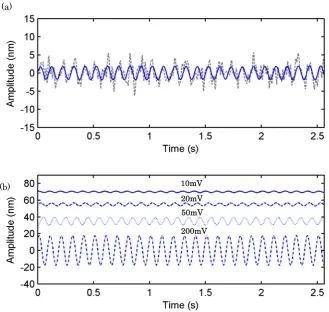
However, as shown previously, the FFT results of interferogram were corrected by SCCM to obtain high accuracy vibration amplitude in nanoscale. To achieve the displacement resolution of the developed 2DOCVT, a 10 Hz sine wave with amplitudes of 10 mv, 20mv, 50 mv and 200mv voltages were used to drive a multilayer piezoelectric stack actuator (Thorlabs). This caused the surface of the PZT actuator to vibrate at a frequency of 10 Hz with amplitudes in nanoscale. The 2DOCVT system was installed on an active vibration isolation optical table in a quiet room with constant temperature and humidity.In order to separate the vibration excited by such as environment noise, a low-pass filter was applied to the measured vibration signals. As shown in Fig.4 (a), the dashed line is the low-pass filtered signal which includes the vibration excited by PZT actuator by 10Hz sine wave with amplitude of 20mv voltage, and also the lower-frequency noise. To further extract the vibration excited only by PZT actuator, a narrow band-pass filter was employed to pick up the 10 Hz sine vibration. The band-band-pass filtered vibration signal is shown as the solid line in Fig.4 (a), from which the vibration amplitude of 1.72 nm was obtained. Using the similar signal filtering strategy, the vibrations excited by PZT actuator by 10Hz sine wave with amplitudes of 10mv, 40mv and 200mv voltages were measured, as shown in Fig.4 (b). The corresponding amplitudes for 10mv, 40mv and 200mv voltages are respectively 0.86, 4.4 and 17.3 nm. It demonstrated excellent linearity of the PZT actuator in the range of nano-scale displacements. Therefore, such very nanoscale displacements could be accurately characterized by the developed 2DOCVT system whose displacement resolution is about 0.1nm.
excited by 5Hz and 15Hz sine signal. From Fig.5, we could find that the amplitudes of the two vibrations were 6.6 μm. The reason is that the amplitudes of the input voltage added to the loudspeaker were the same. It demonstrated the high precision and stability of the developed 2DOCVT system. In vibration engineering, a sweep source is generally used to excite a structure to get vibration parameters. The developed 2DOCVT system had the capability to deal with the vibrating sample with a sweep source. Fig.5 (b) showed the line vibration of the vibrating sample who was excited by a 0-20Hz sweep source and whose vibration amplitude was 6.6μm. It was demonstrated that this system could distinguish the vibration clearly in the line focus and each signal from adjacent points did not interfere with each other.
From the above experimental results, we could find that the distinguished feature of the 2DOCVT system is that it could measure a series number of points in the vibrating structure simultaneously, that is, it could obtain fast line vibration measurement without scanning. This is the major difference with the OCVT system in which point-by-point scanning will be necessary if one wants to obtain a line vibration. In the meanwhile, the 2DOCVT was to measure the absolute displacement of vibrating structures.
exposure time could be used for better surface reflection of the vibrating samples and therefore the sampling frequency could be increased correspondingly. In addition, if low resolution of the high-speed CCD camera with 86MHz pixelclock, for example 1280 x 128 pixels, is used in the image acquisition, the sampling frequency could be about ~5K Hz for the 2DOCVT system. Furthermore, the highest sampling frequency of ~40K for the 2DOCVT could be achieved if the lowest resolution of the PCO-TECH high-speed CCD camera was set. Therefore, the 2DOCVT has great potential for higher frequency applications, such as modal analysis of thin films, thin structures and micro-structures. This would be one of our future work.
4. Concluding Remarks
In conclusion, we present a Fourier-domain optical coherence vibration tomography (2DOCVT) system that is capable of absolute measuring the line vibration of the structure. The measurement results demonstrate the home-made system has high precision with an ultra-precision displacement resolution of ~0.1 nm and excellent stability. In addition, the system is non-contact and noninvasive in nature. Therefore, 2DOCVT system might become a valuable and functional tool for several engineering applications such as high-precision manufacturing sector. The key figures of merit such as the 2DOCVT system could obtain fast line vibration measurement without scanning and it also could be used to capture structural modal shape in one single impulse excitation measurement without any vibration excitation input information, making it attractive for the application in low-frequency vibration measurement and response-only structural modal analysis.
Acknowledgement
We gratefully acknowledge support from National Natural Science Foundation of China, Natural Science Foundation of Fujian Province, Training Program of Fujian Excellent Talents in University, Specialized Research Fund for the Doctoral Program of Higher Education, Ministry of Education, P.R. China (20133514110008) and Ministry of Health, P.R. China (WKJ-FJ-27).
Reference
1. A.B. Stanbridge, D.J. Ewins, “Modal Testing Using a Scanning Laser Doppler Vibrometer,” Mech. Sys. Sig.l Proc. 13(2), 255-270 (1999).
2. R. Dauksevicius R, A. bubulis, V. Jurenas, V. Ostasevicius, S. Tamulevicius, “Investigation of dynamics of cantilever-type microstructure by laser Doppler vibrometry,” Ultragarsas 3, 29–32(2004).
3. T. Miles, M. Lucas, S. Rothberg, “Bending vibration measurement on rotors by laser vibrometry,” Opt. Letters 21(4), 296-298 (1996).
4. C. Barriere and D. Royer, “Optical measurement of large transient mechanical displacements,” Appl. Phy. Letter 79: 878(2001).
5. S. Zhong, H. Shen Y. C. Shen, “Real-time monitoring of structural vibration using spectral-domain optical coherence tomography,” Opti. Laser Eng 49, 49: 127(2011).
Y. Fu, M. Guo and P. B. Phua, “Spatially encoded multibeam laser Doppler vibrometry using a single photodetector”, Opt. Lett. 35, 1356-1358 (2010)
8. Y. Fu, M. Guo, P. B. Phua, “Multi-point laser Doppler vibrometry with single detector: Principles, implementations and signal analyses,” Applied Optics,50(10), 1280-1288 (2011).
9. Y. Fu, G. Pedrini, X. Li, "Interferometric Dynamic Measurement: Techniques Based on High-Speed Imaging or a Single Photodetector", The Scientific World Journal, Vol.2014, 232906, http://dx.doi.org/10.1155/2014/232906 (2014)
10. T. Haist, C. Lingel, W. Osten, C. Rembe, M. Winter, and M. Giesen, “SLM-based multipoint vibrometry”, Proc. SPIE 8082, Optical Measurement Systems for Industrial Inspection VII, 80821V; doi:10.1117/12.889337 (2011)
11. A T Waz, P R Kaczmarek and K M Abramski, “Laser-fibre vibrometry at 1550 nm”, 2009 Meas. Sci. Technol. 20, 105301, (2009)
12, W. N. MacPherson, M. Reeves, D. P. Towers, A. J. Moore, J. D. C. Jones, M. Dale and C. Edwards, “Multipoint laser vibrometer for modal analysis”, Applied Optics, 46 (16), 3126-3132 (2007).
13. X. Li, G. Tao. “Low-frequency harmonic vibration analysis with temporal speckle pattern interferometry,” Opti. Laser Tech. 34, 259–64(2002).
14. B. Dhanaseka, B. Ramamoorthy, “Digital speckle interferometry for assessment of surface roughness”. Optics and Lasers in Engineering 2008; 46:272–80.
15. H. Lopes, F. Ferreira, J. V. Araújo dos Santos, P. Mereno-Gracia, “Localization of damage with speckle shearography and higher order spatial derivatives”, Mech. Sys. Sig. Proc. (in press), 2014.
16. H. Lopes, J. Ribeiro, J.V. Araújo dos Santos, “Interferometric techniques in structural damage identification,” Shock Vib. 19, 835-844( 2012).
17. P. Picart, J. Leval, J. C. Pascal, “2D full field vibration analysis with multiplexed digital holograms”, Opt. Express 13(22), 8882-8892( 2005).
18. Picart, E. Moisson, and D. Mounier, “Twin-Sensitivity Measurement by Spatial Multiplexing of Digitally Recorded Holograms, ” Appl. Opti. 42, 42: 1947(2003).
19. K. Kokkonen, M. Kaivola. “Scanning heterodyne laser interferometer for phase- sensitive absolute-amplitude measurements of surface vibrations,” Appl.Phy.Letters 92, 063502(2008). 20. X. Dai, M. Wang, Y. Zhao and J. Zhou, “Self-mixing interference in fiber ring laser and its application for vibration measurement”, Opt. Express 17(19), 16543-16548(2009) .
21. C. Hsu, Y. Sung, Z. Lin and M. Kao, “Prototype of a compact displacement sensor with a holographic diffraction grating”, Optics & Laser Technology 48, 200-205 (2013).
22. K. Kageyama, I. Kimpara, T. Suzuki, I. Ohsawa, H. Murayama, K. Ito, “Smart marine structures: an approach to the monitoring of ship structures with fiber-optic sensors”, Smart Mater. Struct. 7, 472-478 (1998)
23. M. Johansmann, G. Siegmund, M. Pineda, “Targeting the limits of laser Doppler vibrometry”, in: Proceedings of the IDEMA 2005, Tokyo, Japan, 1-12 (2005).
24. S. Witte, M. Bclayon, E. J. G. Peterman, R. F.G. Toonen, H.D. Mansvelder, M. L. Groot, “Single-shot two-dimensional full-range optical coherence tomography achieved by dispersion control,” Opti. Express 17(14), 11335-11349 (2009).
25. A.F. Fercher, W. Drexler, CK Hitzenberger, T. Lasse, “Optical coherence tomography— principles and applications,” Report on Progress in Physics 66, 239–303(2003).
27. S. Zhong, S. O. Oyadiji, “Response-only method for damage detection of beam-like structures using high accuracy frequencies with auxiliary mass spatial probing”, J. Sound Vib. 311(3), 1075(2008).
28. K. Ding, M. Xie and X. Zhang, “Phase difference correction method for phase and frequency in spectral analysis”, Mechanical Systems and Signal Processing 14(5), 835 (1996)
THL
OF
L1
Sample
L4 M2
M1
CL1
RG BS
LS
L2
L3
REF
d CCD
[image:9.595.204.355.113.387.2]
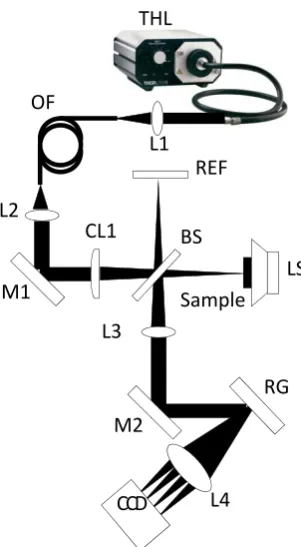
Fig. 1 The schematic diagram of a developed two-dimensional optical coherence vibration tomography (2DOCVT) system. The vibration of a sample was excited by a loudspeaker. Full spectral interferogram was recorded by a high-speed CCD camera. THL: Tungsten Halogen Lamp (OSL1-EC, Thorlabs); L: Lens; OF: Optical fiber; M: mirror; CL: Cylindrical lens; BS: 50/50 beam splitter; REF: Reference; LS: Loudspeaker; RG: Reflection grating; CCD: 1280×1024 pixels CCD camera (PCO.1200hs, PCO-TECH, Germany).
Fig.2 (a) The dashed and solid lines are the displacements of 700 nm sine vibration without and with spectral center correction method on simulated spectral interferogram and (b) the corresponding line vibration; (c) The dashed and solid lines are the displacements of 1nm sine vibration without and with SCCM on simulated spectral interferogram and (d) the corresponding line vibration. For clarity, all the line vibrations are offset vertically.
(a) (b)
[image:10.595.93.489.91.365.2]
Fig. 3 (a) The interferogram of a static sample and a reference surface in the cylindrical line focus; (b) the corresponding FFT of the captured interferogram. The line at the position of 35.2μm indicated the surface position of the sample; (c) OCT spectral interferogram from No. 400 pixel of the CCD camera; (d) the corresponding FFT of OCT spectral interferogram whose peak showed the surface position of the sample.
(c) (d)
[image:11.595.98.502.78.360.2]
Fig.4 (a) The dashed is the noisy vibration excited by PZT actuator by 10Hz sine wave with an
amplitude of 20mv voltages whist the solid line is the filtered vibration signal with the
vibration amplitude of 1.72 nm; (b) The vibrations excited by PZT actuator by 10 Hz sine wave
with amplitudes of 10mv, 40mv and 200mv voltages. The corresponding amplitudes for 10mv,
40mv and 200mv voltages are respectively 0.86, 4.4 and 17.3 nm. For clarity, all the curves are
offset vertically.
Fig.5 Line vibration measurement of a vibrating sample excited by (a) 5Hz (the lower one)
and 15Hz (the upper one) sine signal and (b) 0‐20Hz sweep source using the developed
2DOCVT system.
(a)
(b) 10mV
20mV 50mV
200mV
[image:12.595.128.458.75.387.2] [image:12.595.90.495.497.623.2]
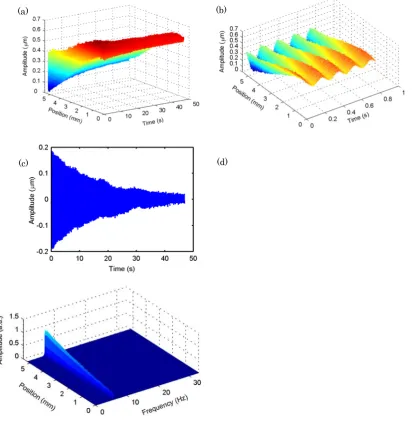
Fig.6 (a) the line vibration of the cantilevered beam captured by 2DOCVT system during the period of 46.9s; (b) the zoom line vibration for the range of 0 to 0.8s; (c) the point vibration signal from No.270 pixel of CCD camera; (d) the FFT of the line vibration shown in (a).
(a) (b)
[image:13.595.84.498.73.495.2]