A Dissertation on
A STUDY ON METABOLIC SYNDROME
IN YOUNG ISCHEMIC STROKE
Submitted to
THE TAMILNADU DR. M.G.R. MEDICAL UNIVERSITY
CHENNAI
In partial fulfillment of the regulations for the award of the degree of
M.D. (GENERAL MEDICINE)
BRANCH - I
KILPAUK MEDICAL COLLEGE
CHENNAI.
INTRODUCTION
Stroke is the leading cause of adult disability and is the second
commonest cause of death worldwide[1].More than two-thirds of the global
burden of stroke is borne by developing countries, where the average age of
patients with stroke is 15 years younger than in developed countries.[2] The
available data indicate that stroke occurring in young people is more often
atherothrombotic in origin in developing countries,[3-5] in contrast to the
developed countries where arterial dissection and cardioembolic etiologies
predominate.[6-9]
Ischemic stroke occurring in young Indians may be a manifestation of
accelerated cerebrovascular atherosclerosis, paralleling the early age of onset
of cerebrovascular diseases noted for this population.[10] Additionally based
on prior data on increased propensity for insulin resistance among South
Asians,[11,12] the ischemic stroke in young adults in India may be associated
with the metabolic syndrome.
The term metabolic syndrome refers to a cluster of metabolic
include insulin resistance, abdominal obesity, elevated blood pressure(BP),
triglycerides(TG) and low levels of High density lipoprotein(HDL).
To assess the association between the metabolic syndrome (according
to NCEP ATP III criteria)[14] and the acute ischemic non-embolic stroke a
case control study was conducted, comparing 60 cases aged less than 45
years with a first ischemic (non embolic) stroke with 30 controls of same age
group without prior history of stroke and heart disease.
Metabolic syndrome was diagnosed by using NCEP ATP III criteria
except waist circumference. Cutoff point for abnormal waist circumference
according to NCEP ATP III criteria is >102cm for males and >82cm for
females. This may be fit for western population but it is very high for
Indians. So the cutoff point for abnormal waist circumference was taken as
per the new International Diabetes Federation(IDF) criteria where ethnic
specific values were given. Cutoff point for South Asians as per the IDF
AIM OF THE STUDY
To assess the association between the metabolic syndrome and its
individual components- fasting blood sugar (FBS), blood pressure (BP),
HDL cholesterol(HDL-C), triglyceride(TG) and waist circumference(WC)
REVIEW OF LITERATURE
Stroke
Stroke or cerebrovascular accident is defined as an acute onset of
focal neurological deficit that is attributed to a vascular cause which lasts for
more than 24 hours. It may be due to atherosclerotic thrombosis or embolism
or hemorrhage-aneurysm, AV malformation etc. If the deficit recovers fully
within 24 hours it is named as transient ischemic stroke (TIA). Typically the
signs and symptoms of a TIA last for 5 to 15 minutes.
Stroke is the leading cause of adult disability and the second
commonest cause of death worldwide. More than two-thirds of the global
burden of stroke is borne by developing countries.
20-30% strokes in India occurs < 45years. There is widely recognized
race and ethnic disparity in stroke patients in general. Young Blacks and
Hispanics are having increased morbidity and mortality from stroke
compared to Whites.
Atherosclerosis remains the major cause not only for stroke but also
year 2020, atherosclerotic vascular diseases will become the leading global
cause of total disease burden, defined as the years subtracted from healthy
life by disability or premature death.
METABOLIC SYNDROME
Definition
Metabolic syndrome refers to a cluster of metabolic abnormalities
related to a state of insulin resistance which is often associated with obesity.
The major characteristics include insulin resistance, abdominal obesity,
elevated blood pressure and lipid abnormalities (elevated levels of
triglycerides and low levels of high density lipoprotein (HDL-C) cholesterol.
Metabolic syndrome is associated with proinflammatory and
prothrombotic state that may include elevated levels of C- reactive protein,
endothelial dysfunction, hyperfibrinogenemia, increased platelet aggregation
increased levels of plasminogen activator inhibitor 1,elevated levels of uric
acid, microalbuminuria and shift towards small, dense particles of low
History
The term "metabolic syndrome" dates back to at least the late 1950s,
but came into common usage in the late 1970s to describe various
associations of risk factors with diabetes, that had been noted as early as the
1920s.[15,16]
The Marseilles physician Dr. Jean Vague, in 1947, observed that
upper body obesity appeared to predispose to diabetes,
atherosclerosis, gout, and calculi.[17]
Avogaro, Crepaldi and co-workers described six moderately obese
patients with diabetes, hypercholesterolemia, and marked
hypertriglyceridemia all of which improved when the patients were
put on a hypocaloric, low carbohydrate diet.[18]
In 1977, Haller used the term "metabolic syndrome" for
associations of obesity, diabetes mellitus, hyperlipoproteinemia,
hyperuricemia and steatosis hepatis when describing the additive
effects of risk factors on atherosclerosis.[19]
The same year, Singer used the term for associations of obesity,
gout, diabetes mellitus, and hypertension with
In 1977 and 1978, Gerald B. Phillips developed the concept that
risk factors for myocardial infarction concur to form a
"constellation of abnormalities" i.e., glucose intolerance,
hyperinsulinemia, hypercholesterolemia and hypertriglyceridemia
and hypertension that is associated not only with heart disease, but
also with aging, obesity and other clinical states. He suggested
there must be an underlying linking factor, the identification of
which could lead to the prevention of cardiovascular disease; he
hypothesized that this factor was sex hormones.[21,22]
In 1988, in his Banting lecture, Gerald M. Reaven proposed insulin
resistance as the underlying factor and named the constellation of
abnormalities as Syndrome X. Reaven did not include abdominal
obesity, which has also been hypothesized as the underlying factor,
as part of the condition.[23]
The terms "metabolic syndrome," "insulin resistance syndrome," and
"Syndrome X" are now used specifically to define a constellation of
abnormalities that is associated with increased risk for the development of
Prevalence of Metabolic Syndrome in India and the World
With the formulation of NCEP/ATP III guidelines, some uniformity
and standardization has occurred in the definition of metabolic syndrome
and has been very useful for epidemiological purposes. At present,
metabolic syndrome is an all or none diagnosis.
The study results based on third National Health and Nutrition
Examination Survey (NHANES III), showed that approximately one fourth of the
US adults 20 years or older met the diagnostic criteria for metabolic syndrome.[24]
The prevalence of the metabolic syndrome depends on age, ethnic background,
and gender. It rises linearly from 20 to 50 years and plateaus thereafter.
Looking at various studies around the world, which included population
samples, aged from 20 and onwards, the prevalence varies from 8% (India) to
24% (United States) in men and from 7% (France) to 46% (India) in women.[25]
Two Indian studies, which differed in their definition of obesity: first[26]
used the obesity criteria suitable for Indians, while the second[27] used the
standard ATP III definition of obesity. Both studies used population based
41% in Chennai.[26] The prevalence of obesity in two study groups was quite
similar (31% versus 33%), despite the different definitions used. Far larger
differences were observed between the two studies for the prevalence of elevated
triglycerides (46% vs. 30%), hypertension (55% vs. 39%) and elevated fasting
plasma glucose (27% vs. 5%), each of which reported having used the same cut
off points.
Interestingly, a third Indian study,[28] also from Chennai, reported a
metabolic syndrome prevalence of 11.2% (Using EGIR criteria), which was
much closer to the prevalence rate reported for Jaipur than the other Chennai
study. Therefore, even within the same ethnic population group it appears that
there can be significant differences in the prevalence of both the individual
factors that constitute the metabolic syndrome and the metabolic syndrome itself.
Metabolic syndrome prevalence rates as described earlier vary among
ethnic groups as defined by the ATP III criteria among Finnish and Native
American men. Both studies involved subjects with comparable age ranges
(42-60 and 44-49 years, respectively), with the Finnish study showing prevalence of
only 14% compared with the prevalence in the Native American study of 43.6%.
The prevalence varies from a low of 13.9% in black men to a high of 27.2% in
Causes of the metabolic syndrome
Insulin resistance
Insulin resistance and the metabolic syndrome appear to be almost
inseparable. Insulin resistance was the basis of Reaven syndrome X and
definitions of the metabolic syndrome required presence of insulin
resistance. An elevated fasting blood glucose (used by some as a surrogate
for insulin resistance) is one of the 5 components of the ATP III/AHA,
NHLBI definition but any 3 conditions may be present for the diagnosis.
Obesity
Fat deposition in the upper body, and particularly intra-abdominal fat
(visceral adiposity), has been thought to have greater metabolic
consequences than fat on the hips or thighs, which is more common in
women. Visceral adiposity is approximately 20% and 6% of total body fat
in men and women, respectively. Unlike subcutaneous fat, blood circulation
from visceral fat flows directly into the liver, thereby exposing it to high
concentrations of free fatty acids and other chemicals and causing increased
Obesity increases the risk of elevated fasting blood glucose or type 2
diabetes, high triglycerides, elevated blood pressure or hypertension, and
low HDL cholesterol. At the present, almost 25% of adults in the United
States (about 47 million people) have the metabolic syndrome. In
non-Western countries such as India in which obesity is on the rise, the metabolic
syndrome soon follows.
The individuals who have fallen as victims to the obesity epidemic do
not necessarily have abdominal obesity. Therefore, it appears that
abdominal obesity, while probably a great risk for the syndrome, is not an
absolute requirement. Patients with normal blood glucose and weight who
have an elevated blood pressure and triglycerides and a low HDL have, by
definition, having the metabolic syndrome. While such individuals compose
a small number of all those with the metabolic syndrome, it seems that
insulin resistance or an elevated blood glucose are not necessary for the
diagnosis.
Sedentary lifestyle
Sedentary lifestyle, that is, the lack of aerobic exercise is a major
weight, FBS, insulin resistance, blood pressure, and triglycerides. With
sufficient daily physical activity, the metabolic syndrome would disappear.
Diet
Diet high in refined carbohydrates (sweets, regular soda, juice, white
flour, white potatoes) indirectly promotes the metabolic syndrome and leads
to weight gain, increased triglycerides, and a low HDL. Such diets are often
high in sodium (salt), which increases the risk of high blood pressure.
Age
Aging increases the incidence of high blood pressure and elevated
blood glucose; and older individuals tend to be less physically active (which
leads to higher blood pressure and blood glucose).
Genetics
Metabolic syndrome in the South Indian population has recently been
reported to be associated with Thr54 allele carriers of the Ala54Thr variant
of FABP2 gene.
Others
Polycystic ovary syndrome
Pathogenesis
The mechanisms underlying the metabolic syndrome are not fully
known; however insulin resistance plays a fundamental role in the
pathogenesis of metabolic syndrome. Resistance to insulin stimulated
glucose uptake seems to modify the biochemical responses in a way that
predisposes to metabolic risk factors.[30,31] Insulin resistance causes lipolysis
results in increased plasma free fatty acid. This promotes hepatic VLDL
release and lowers HDL cholesterol. Insulin resistance is associated with
impairment of endothelial nitric oxide system thus results in
vasoconstriction. Increased activity of sympathetic nervous system noted in
the metabolic syndrome causes hypertension.
A central role has been attributed to the pro-inflammatory cytokines,
tumor necrosis factor alpha (TNF-alpha) and interleukin (IL)-6, that both are
produced in substantial amounts by human adipose tissue. TNF- alpha
impairs insulin-stimulated glucose uptake in a variety of cells and decreases
lipoprotein lipase activity. Both cytokines increase hepatic lipogensis and
triglyceride rich VLDL results in insulin resistance by directly antagonizing
insulin and inducing cytokines.
Various aspects of the acute-phase response, such as fibrinogen and
plasminogen activator inhibitor-1 levels, whole-blood viscosity, and white
blood cell count, have recently been found to correlate positively with the
metabolic syndrome.[33] This is of particular interest because inflammation
plays an important role in the pathogenesis of atherothrombosis.[35]
Macrophage and T-cell infiltration is a major feature of atherosclerotic
plaques, especially at the sites of plaque rupture, and epidemiological studies
show strong positive associations of systemic markers of inflammation with
atherothrombotic disease[34,36,37,38] Moreover, C-reactive protein (CRP), the
classic and exquisitively sensitive acute phase reactant, shows a strong
independent association with the risk of Coronary Heart Disease and other
atherothrombotic events. CRP levels have also been found to correlate with
BMI and some features of the metabolic syndrome.
Insulin resistance and resulting hyperinsulinemia have been
hypertension, polycystic ovary syndrome, hypercoagulability and vascular
inflammation, as well as the eventual development of atherosclerotic
cardiovascular disease manifested as myocardial infarction, stroke and end
organ damage.
Signs and symptoms
• Fasting hyperglycemia — diabetes mellitus type 2 or impaired fasting
glucose, impaired glucose tolerance, or insulin resistance
• High blood pressure
• Central obesity (also known as visceral, male-pattern or apple-shaped
adiposity), overweight with fat deposits mainly around the waist
• Decreased HDL cholesterol
• Elevated triglycerides
Associated diseases and signs are: elevated uric acid levels, fatty liver
(especially in concurrent obesity), progressing to non-alcoholic fatty liver
disease, polycystic ovarian syndrome, hemochromatosis and acanthosis
Diagnostic criteria
There are currently two major definitions for metabolic syndrome
provided by the International Diabetes Federation (IDF) and the Revised
National Cholesterol Education Program (NCEP) respectively. The revised
NCEP and IDF definitions of metabolic syndrome are very similar and it can
be expected that they will identify many of the same individuals as having
metabolic syndrome. The two differences are that IDF excludes any subject
without increased waist circumference, while in the NCEP definition
metabolic syndrome can be diagnosed based on other criteria and the IDF
uses geography-specific cut points for waist circumference, while NCEP
uses only one set of cut points for waist circumference regardless of
geography. These two definitions are much closer to each other than the
original NCEP and WHO definitions.
WHO
The World Health Organization criteria (1999) require presence of
diabetes mellitus, impaired glucose tolerance, impaired fasting glucose or
insulin resistance and two of the following:
• dyslipidaemia:
triglycerides ≥1.695mmol/L(150mg/dl)
high density lipoprotein cholesterol
≤ 0.9mmol/L (male)
≤ 1.0 mmol/L (female)
• central obesity
waist: hip ratio > 0.90 (male); > 0.85(female) and/or
body mass index > 30 kg/m2
• microalbuminuria:
urinary albumin excretion ratio ≥ 20 mg/min or
albumin : creatinine ratio ≥ 30 mg/g
The WHO criteria differed from all subsequent definitions in two
respects:
1) One of the risk factors was a measure of renal impairment based on the
amount of protein excreted in the urine.
EGIR
The European Group for the Study of Insulin Resistance (EGIR)
(1999) requires insulin resistance defined as the top 25% of the fasting
insulin values among non-diabetic individuals and two or more of the
following:
1) Central obesity:
waist circumference ≥ 94 cm (male), ≥ 80 cm (female)
2) Dyslipidaemia:
TG ≥ 2.0 mmol/L and /or
HDL-C < 1.0 mmol/L or
Treated for dyslipidaemia
3) Hypertension:
Blood pressure ≥ 140/90 mmHg or on antihypertensive medication
4) Fasting plasma glucose ≥ 6.1 mmol/L(110mg/dl)
NCEP(2001):
In 2001, led by Dr. Scott Grundy, the National Cholesterol Education
Program Adult Treatment Panel (ATP III) was published and became what
is now probably the most widely used definition of the metabolic syndrome
single condition was a necessary component. The risk factor used as a
surrogate for insulin resistance could be either DM-2 or an impaired fasting
plasma glucose level (IFG).
The 2003 position statement by the American College of
Endocrinology reasserted the primacy of insulin resistance and dropped the
term metabolic syndrome. As in the earliest guidelines, insulin resistance
was made a necessary component of the syndrome. A specific number of
other risk factors were not included- DM-2 was not used in making the
diagnosis and several clinical scenarios not included in other guidelines were
added: family history of DM-2, ethic groups prone to DM, sedentary
lifestyle, advancing age, and polycystic ovary syndrome (a condition often
accompanied by insulin resistance and its associated abnormalities).
The US National Cholesterol Education Program Adult Treatment Panel III
(2001) requires at least three of the following
• central obesity: waist circumference ≥ 102 cm or 40 inches (male),
≥ 88 cm or 36 inches(female)
• dyslipidaemia: TG ≥ 1.695 mmol/L (150 mg/dl)
• dyslipidaemia: HDL-C < 40 mg/dL (male), < 50 mg/dL (female)
• fasting plasma glucose ≥ 6.1 mmol/L (110 mg/dl)
The new International Diabetes Federation (IDF) definition
According to the new IDF definition, for a person to be defined as
having the metabolic syndrome, he must have:
Central obesity
defined as waist circumference > 94cm for Europid men and > 80cm
for Europid women, with ethnicity specific values for other groups plus any
two of the following four factors:
• raised triglyceride level: > 150 mg/dL (1.7 mmol/L), or specific
treatment for this lipid abnormality
• reduced HDL cholesterol: < 40 mg/dL (1.0 mmol/L) in males and <
50 mg/dL (1.3 mmol/L) in females, or specific treatment for this lipid
abnormality
• raised blood pressure: systolic BP > 130 or diastolic BP > 85 mm Hg,
or treatment of previously diagnosed hypertension
• raised fasting plasma glucose (FPG) > 100 mg/dL (5.6 mmol/L), or
The IDF also delineated multiple, ethnic specific values for waist
circumference and defined more stringent criteria for whites of European
descent.
Europids:
The cut-off point for abnormal waist circumference decreased from
102 cm (40 inches) to 94 (37 inches) in men and from 88 cm (35 inches) to
80 (31.5 inches) for women. The IDF conceded that in the USA, the ATP
III values (male 102 cm, female 88 cm) are likely to continue to be used.
Chinese and South Asians (based on Chinese, Malay, and Asian-Indian
populations): male > 90 cm, female > 80 cm.
Japanese: male > 85 cm, female > 90 cm
2005 ATP III/AHA, NHLBI Diagnostic Criteria for the Metabolic
Syndrome:
There is confusion as to whether the American Heart Association and
National Heart, Lung, and Blood Institute intended to create another set of
guidelines or simply update the NCEP ATP III definition. According to
Texas, the intent was just to update the NCEP ATP III definition and not
create a new definition.[39]
Any 3 of the following 5 conditions fulfils the definition of the
metabolic syndrome (using abnormal FBG as currently defined)
• Elevated waist circumference:
Men - Equal to or greater than 40 inches (102 cm)
Women - Equal to or greater than 35 inches (88 cm)
• Elevated triglycerides:
Equal to or greater than 150 mg/dL
• Reduced HDL cholesterol:
Men - Less than 40 mg/dL
Women - Less than 50 mg/dL
• Elevated blood pressure:
Equal to or greater than 130/85 mm Hg or use of medication
for hypertension
• Elevated fasting glucose:
Equal to or greater than 100 mg/dL (5.6 mmol/L) or
PARAMETERS TO DIAGNOSE METABOLIC SYNDROME
The definitions and criteria discussed earlier provide the parameters
for the diagnosis of the syndrome:
• Fasting blood glucose (FBG)
• Fasting triglycerides
• HDL cholesterol
These three components of the metabolic syndrome require a fasting
blood test for both the glucose and triglyceride levels; that is, nothing should
be eaten or drunk other than water for 10 to 12 hours preceding the test.
Blood pressure, measured by a clinician
Waist circumference, measured by a clinician
Waist circumference measurement:
NHLBI recommendation for waist measurement is quite precise: place
a tape measure at the top of the right iliac crest (pelvis), circle the abdomen
on a horizontal plane parallel to the floor, make the tape snug without
Other methods: measurement at the umbilicus, where the waist is
narrowest; half-way between the last rib and the iliac crest; narrowest point
between the costal margin and iliac crest.
Why is waist circumference used instead of body mass index?
The definition of the metabolic syndrome uses waist circumference as a
surrogate for central obesity. Body mass index (BMI), a ratio of weight to
height (weight in kilograms divided by height in meters square), provides no
indication of the location of fat deposits. BMI is used to categorize the
weight.
Body Mass Index Categories:
• Underweight: below 18.5
• Desirable weight: 18.5-24.9
• Overweight: 25-29.5
• Obese: 30-39.5
• Severely obese: 40 or higher
According to BMI categories, the overweight and obese reflect greater
muscle mass). Those with a BMI in the obese range may not have visceral
obesity, and those with visceral obesity may have a BMI less than 30.
The waist-to-hip ratio, which was the WHO criterion for visceral
obesity, is another measure of the same condition:
Normal values
women : less than 0.8;
men : less than 1.0.
Hip measurement is less controversial than that of waist and is usually
measured at the maximum circumference above the buttocks.
Waist measurement indicates both too much fat and its central
location. Central or upper body obesity probably poses a greater risk for
CVD and DM-2. Central obesity is most accurately determined by imaging
techniques such as direct measurement of visceral fat by computer assisted
tomography or magnetic resonance imaging, which are expensive and
impractical in clinical research.
Treatment for the Metabolic Syndrome
No specific treatment is recommended for the metabolic syndrome
clinicians caring for individuals not only with diabetes and high blood
pressure but also for those with mild increases that are now called
prediabetes (fasting blood glucose 100 -125 mg/dL) and prehypertension
(systolic blood pressure 130-139 or diastolic blood pressure (80-89).
Therapeutic Lifestyle modification
As the most frequent causes of the metabolic syndrome are obesity,
sedentary lifestyle and poor diet, all the features of the metabolic syndrome
will improve with lifestyle modification.[40]
• Weight loss
Weight loss or more specifically decrease the percent body fat.
Weight loss improves insulin sensitivity, increases HDL cholesterol
and decreases FBG, blood pressure and triglycerides.
• Exercise [41-47]
Frequent aerobic exercise will improve the same parameters as losing
body fat. The current suggested minimum regimen is at least 30
minutes of brisk aerobic exercise (e.g. brisk walking) 4 days/week
plus a modest amount of strength training. The optimal amount of
• Diet
a) Fat[48-51]
Reduce the saturated fats.
Total fat intake should be 25-35% of total calories.
Low fat diets decrease triglycerides and increase HDL
b) Carbohydrates [52,53]
Reduce the processed food and refined carbohydrates (e.g. sugar,
soft drinks, juice,desserts, white flour)
Add whole grains, fruit, vegetables
c) Protein
Fish, preferably small fish low in mercury (sardines, herring, small
mackerel, salmon)
• Reduce salt in diet[54,55]
• Reduce alcohol
Alcohol increases appetite and triglycerides
Because the metabolic syndrome increases the risk of a CVD event,
other risk factors for that condition should be addressed:
Avoid Smoking
Treatment for DM
Treatment for high blood pressure
Medications
Obesity
Rimonaband- It is a cannabinoid-1 receptor antagonist.It inhibits
intake of fatty foods.
Orlistat- It inhibits pancreatic lipase and reduces fat digestion.
Insulin Resistance
Weight reduction and increased physical activity will reduce insulin
resistance.Two classes of drugs are currently available that reduce insulin
resistance. These are metformin [56] and insulin sensitizers such as
thiazolidinediones(TZDs).
Hyperglycemia
When patients with metabolic syndrome develop type 2 diabetes,they
are at high risk for atherosclerotic vascular diseases.All risk factors should
be intensively reduced. In addition, glucose levels should be appropriately
treated with lifestyle therapies and hypoglycemic agents asneeded to keep
Atherogenic dyslipidemia
Although statins typically are recognized to be LDL-lowering drugs,
they reduce all apolipoprotein B–containing lipoproteins. Clinical studies
demonstrate that abnormal lipoprotein patterns are doubly improved by
combined statin-fibrate therapy.
Elevated Blood Pressure
Hypertensive patients with metabolic syndrome deserve lifestyle
therapies to reduce blood pressure. In addition, antihypertensive drugs
should be used as recommendedby hypertension guidelines.
Prothrombotic state
No drugs are available that target PAI-1 and fibrinogen. Analternative
approach to the prothrombotic state is antiplatelettherapy. For example,
low-dose aspirin reduces CVD events inboth secondary and primary prevention.
Thus, use of aspirin for primary prevention in patients with metabolic
ATP III Guidelines for the Treatment of Patients with Metabolic
Syndrome
Targeted area Goal
Treat LDL cholesterol first.
CHD and CHD risk equivalent
(10-year risk for CHD >20 percent)
<100 mg per dL (<2.6 mmol per
L)
At least two risk factors
(10-year risk <=20 percent)
<130 mg per dL (<3.35 mmol per
L)
Institute weight control. 10 percent from baseline
Institute physical activity. 30 to 40 minutes per day
Monitor treatment of hypertension. <130/85 mm Hg
Treat elevated triglyceride levels
and low HDL cholesterol levels
Goal of non-HDL cholesterol for
patients with triglyceride levels of
> 200 mg per dL
High CHD risk: <130 mg per dL
Intermediate CHD risk: <160 mg
per dL Low CHD risk: <190 mg
per dL
ATP = Adult Treatment Panel; LDL = low-density lipoprotein; CHD =
MATERIALS AND METHODS
Study site
This study was conducted in Government Royapettah Hospital, Chennai
during the period of 2006- 2008.
Study Population:
Cases:
60 patients aged less than 45 years hospitalized with the history of first
ischemic stroke were included.
Inclusion Criteria:
1. Subjects aged less than 45 years.
2. Presented with first acute ischemic stroke-CT or/and MRI brain was
taken for confirmation of ischemic stroke.
Exclusion Criteria:
1. Prior history of Stroke
2. Hemorrhagic stroke
4. Embolic stroke – complete cardiac evaluation & carotid Doppler was
done to rule out embolic stroke.
5. Stroke due to intra cranial sinus thrombosis
Controls:
30 subjects from a community based sample of individuals aged less
than 45 years without prior history of stroke and heart disease were included.
Data collection:
Data collection was done by using a structured proforma. BP, fasting
blood sugar, fasting lipids were taken at approximately a week or later after
stroke onset, as elevations in BP, blood sugar and lipids are well
documented during the acute phase of stroke.[57,58]Waist circumference was
RESULTS AND ANALYSIS
Characteristics of study population were assessed and the values were
expressed as mean + standard deviation except for age, sex and smoking.
Prevalence of the individual risk factors and the metabolic syndrome in both
groups were compared.
The association between the metabolic syndrome and its individual
components and stroke was determined by the logistic regression analysis.
Odds ratio and their 95% confidence intervals were assessed.
Significance was defined as P value <0.05 in all cases.
Characteristics of the study population
Stroke patients had high level of fasting blood sugar, BP, total
cholesterol, triglycerides and increased waist circumference compared
to control group.
Stroke was common in males.73% stroke patients were males. Stroke
the age group of 41-45yrs. 60% of stroke patients had metabolic syndrome
Table no 1
CHARACTERISTIC FEATURES OF STUDY POPULATION
Sl.no Characterestic feature
Cases n – 60
Control n – 30
P value
Male 44[73.30%] 24[80.00%] 1 Gender
Female 16[26.70%] 06[20.00%]
30-35 05[08.30%] 01[03.30%]
36-40 23[38.30%] 11[36.70%] 2 Age
group
41-45 32[53.30%] 18[60.00%]
3 Smoking 33[55.00%] 08[26.7%] <0.01
4 FBS 115.73+28.11 90.73+18.30 <0.01
5 Syst BP 127.00+16.19 116.00+11.92 <0.01
6 Dias BP 81.58+08.90 78.17+08.90 0.07
7 HDL 42.62+08.44 46.63+09.12 0.04
8
Total cholesterol 196.80+59.35 164.90+40.78 0.01
9 Triglycerides 156.70+53.09 132.60+39.85 0.03
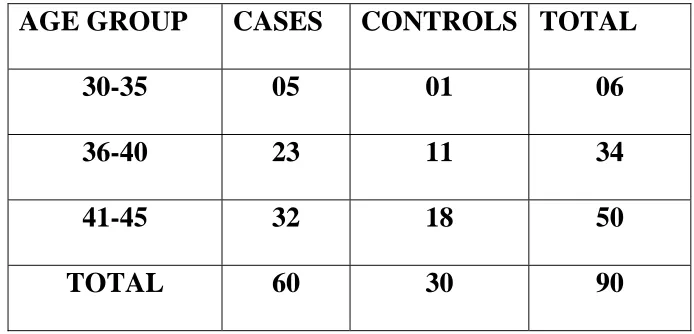
Table no 2
AGE DISTRIBUTION
AGE GROUP CASES CONTROLS TOTAL
30-35 05 01 06
36-40 23 11 34
41-45 32 18 50
TOTAL 60 30 90
AGE DISTRIBUTION
0 10 20 30 40
30-35 36-40 41-45
Age group
N
o
of
pa
ti
e
n
ts
CASES CONTROLS
[image:42.612.132.479.167.334.2]Table no 3
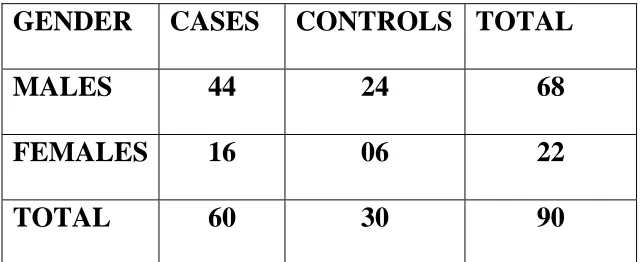
GENDER DISTRIBUTION
GENDER CASES CONTROLS TOTAL
MALES 44 24 68
FEMALES 16 06 22
TOTAL 60 30 90
GENDER DISTRIBUTION 0 5 10 15 20 25 30 35 40 45 50 Males Females Gender N o of pa ti e n ts cases controls
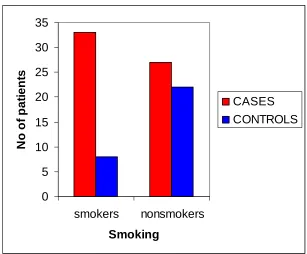
Table no 4
PREVALENCE OF SMOKING
SMOKING CASES CONTROLS TOTAL
SMOKERS 33 08 41
NON SMOKERS 27 22 49
Total 60 30 90
0 5 10 15 20 25 30 35 smokers nonsmokers Smoking N o of pa ti e n ts CASES CONTROLS
55% of stroke patients were smokers.
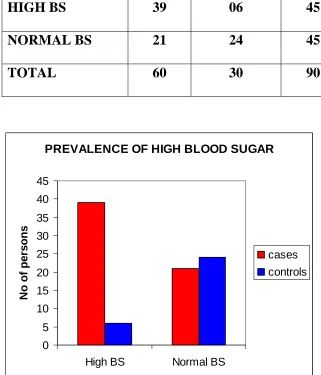
[image:44.612.145.452.331.585.2]Table no 5
PREVALENCE OF HIGH BLOOD SUGAR
[FBS >100mg/dl or diabetic on treatment]
BLOOD SUGAR CASES CONTROLS TOTAL
HIGH BS 39 06 45
NORMAL BS 21 24 45
TOTAL 60 30 90
PREVALENCE OF HIGH BLOOD SUGAR
0 5 10 15 20 25 30 35 40 45
High BS Normal BS
N o of pe rs on s cases controls
65% of stroke patients had high blood sugar.
20%of control group had high blood sugar.
P value <0.001
Table no 6
PREVALENCE OF HIGH BLOOD PRESSURE
[BP >130/85mmHg or on anti hypertensive]
BLOOD
PRESSURE
CASES CONTROLS TOTAL
High BP 28 05 33
Low BP 32 25 57
Total 60 30 90
PREVALENCE OF HIGH BLOOD PRESSURE 0 5 10 15 20 25 30 35
High BP Normal BP
N o of pe rs on s cases controls
46.7% of stroke patients had high BP.
16.7% of control group had high BP.
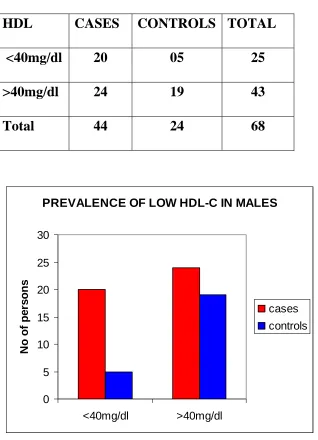
Table no 7
PREVALENCE OF LOW HDL-C IN MALES
[Males <40mg/dl]
HDL CASES CONTROLS TOTAL
<40mg/dl 20 05 25
>40mg/dl 24 19 43
Total 44 24 68
PREVALENCE OF LOW HDL-C IN MALES
0 5 10 15 20 25 30 <40mg/dl >40mg/dl N o of pe rs on s cases controls
45.5% of stroke patients had low HDL.
20.8% of control group had low HDL.
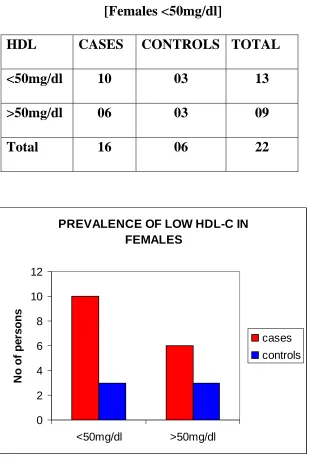
Table no 8
PREVALENCE OF LOW HDL-C IN FEMALES
[Females <50mg/dl]
HDL CASES CONTROLS TOTAL
<50mg/dl 10 03 13
>50mg/dl 06 03 09
Total 16 06 22
PREVALENCE OF LOW HDL-C IN FEMALES 0 2 4 6 8 10 12 <50mg/dl >50mg/dl N o of pe rs on s cases controls
62.5% of stroke patients had low HDL.
50% of control group had low HDL.
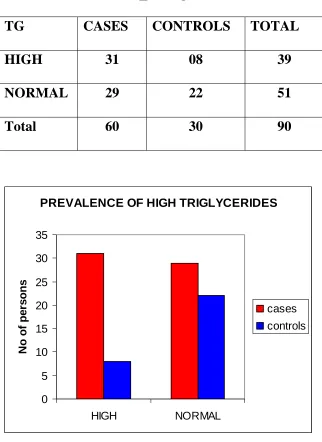
Table no 9
PREVALENCE OF HIGH TRIGLYCERIDES
[TG>150mg/dl]
TG CASES CONTROLS TOTAL
HIGH 31 08 39
NORMAL 29 22 51
Total 60 30 90
PREVALENCE OF HIGH TRIGLYCERIDES
0 5 10 15 20 25 30 35 HIGH NORMAL N o of pe rs on s cases controls
51.7% of stroke patients had high TG.
26.7% of control group had high TG.
P value 0.02.
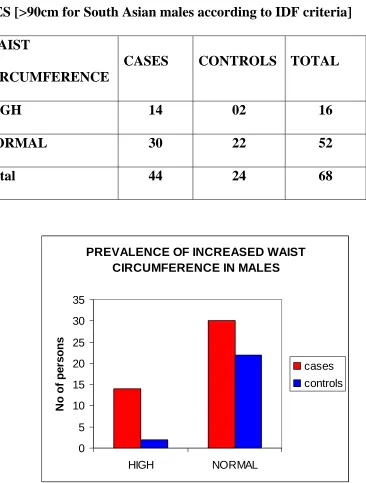
[image:49.612.145.467.152.594.2]Table no 10
PREVALENCE OF INCREASED WAIST CIRCUMFERENCE IN
MALES [>90cm for South Asian males according to IDF criteria]
WAIST
CIRCUMFERENCE
CASES CONTROLS TOTAL
HIGH 14 02 16
NORMAL 30 22 52
Total 44 24 68
PREVALENCE OF INCREASED WAIST CIRCUMFERENCE IN MALES
0 5 10 15 20 25 30 35 HIGH NORMAL N o of pe rs on s cases controls
31.8% of stroke patients had increased waist circumference.
8.3% of control group had increased waist circumference.
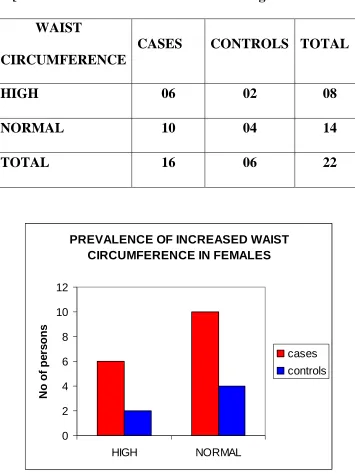
[image:50.612.129.495.133.616.2]Table no 11
PREVALENCE OF INCREASED WAIST CIRCUMFERENCE IN
FEMALES [>80cm for South Asian females according to IDF criteria]
WAIST
CIRCUMFERENCE
CASES CONTROLS TOTAL
HIGH 06 02 08
NORMAL 10 04 14
TOTAL 16 06 22
PREVALENCE OF INCREASED WAIST CIRCUMFERENCE IN FEMALES
0 2 4 6 8 10 12 HIGH NORMAL N o of pe rs on s cases controls
37.5% of stroke patients had increased waist circumference.
33.3% of control group had increased waist circumference.
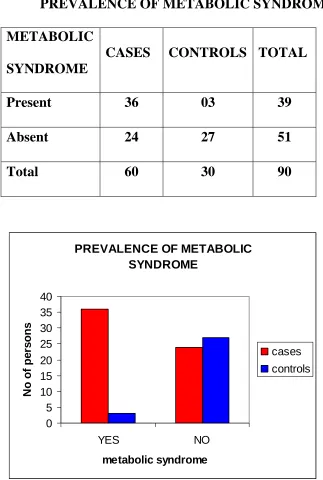
[image:51.612.149.504.150.624.2]Table no 12
PREVALENCE OF METABOLIC SYNDROME
METABOLIC
SYNDROME
CASES CONTROLS TOTAL
Present 36 03 39
Absent 24 27 51
Total 60 30 90
PREVALENCE OF METABOLIC SYNDROME 0 5 10 15 20 25 30 35 40 YES NO metabolic syndrome N o of pe rs on s cases controls
60% of stroke patients had metabolic syndrome.
10% of control group had metabolic syndrome.
[image:52.612.143.466.109.589.2]Table no 13
LOGISTIC REGRESSION ANALYSIS
Association between the metabolic syndrome and its components and the
acute ischemic stroke
Sl.no Features Odds ratio 95% CI P value
1 FBS>100mg/dl 4.05 1.810-8.84 0.01
2 Syst BP>130mmHg 1.08 0.968-1.205 0.17
3 Diast BP>85mmHg 1.02 0.848-1.221 0.85
4 Low HDL 2.18 1.01-4.011 0.03
5 TG>150mg/dl 1.00 0.990-1.022 0.38
6 High WC 1.04 0.996-1.090 0.73
7 Metabolic syndrome >3 9.60 2.022-19.97 0.01
8 Smoking 8.01 0.97-13.02 0.02
[image:53.612.90.515.231.527.2]DISCUSSION
In this case control study, stroke patients had higher fasting blood
sugar, BP, abnormal lipid profile and increased waist circumference
compared to community controls. Stroke was more prevalent in the age
group of 41-45yrs. 53.3% of stroke patients belong to 41-45 yrs. Incidence
of the stroke increases as the age advances. Stroke was more prevalent in
males than females. 73.3% of stroke patients were males and 26.7% were
females.
FBS was higher in stroke group than control group (115.73 VS 90.73,
P value <0.01). Higher FBS was associated with 4 fold stroke risk (4 odds,
P value 0.01) compared to control group and statistically significant. Insulin
resistance is the pathophysiological process underlying the clustering of
vascular risk factors in the metabolic syndrome.
BP was higher in stroke group than control group. The presence of
hypertension was associated with increased risk of acute ischemic stroke.
However, this association was not statistically significantbecause of the high
prevalence of hypertension rises with advancing age. For example, in the
Framingham cohort study,[59]aged 70 to 79 almost 50% had borderline
hypertension. Among metabolic syndrome components, hypertension is
considered the least"metabolic. It is multifactorial in origin, with increasing
arterial stiffness significantly contributing to systolic hypertension in the
elderly.
Dyslipidemia is a hallmark of the Metabolic Syndrome. Stroke
patients had low HDL-C, high total cholesterol (TC) to HDL-C ratio and
high triglyceride. HDL-C level was inversely related to the risk of ischemic
stroke. The protective role of HDL-C was attenuated in the presence of
metabolic syndrome. In a case control study involving 204 patients with
acute ischaemic stroke of all ages from Madras, South India, the authors
found that while low HDL cholesterol and high total cholesterol to HDL
cholesterol ratio were more frequent among patients.[60]
Abdominal obesity in association with metabolic syndrome carries
high risk for stroke. Visceral fat is associated with insulin resistance than
increased WC than the control group. But association with stroke risk was
not statistically significant.
According to NCEP-ATP III presence of three or more components
is defined as metabolic syndrome. In this study 60% of stroke patients had
metabolic syndrome and it was associated with nine fold stoke risk which
was statistically highly significant. (9 Odds, P value 0.01)
Smokers were associated with eight fold increased risk for stroke
than nonsmokers which is statistically highly significant.(8 Odds, P value
0.02).Smoking is an independent risk factor for stroke.
In this study, high fasting blood sugar, low HDL cholesterol,
smoking and metabolic syndrome were associated with increased stroke risk
which is statistically highly significant.
A case control study, conducted in 214 South Indian patients
aged between 15-45 years with first acute ischemic stroke in Sri Chitra
Trunal Institute, Trivandrum[61] showed high fasting blood sugar,
FBS associated with 4 fold stroke risk; smoking associated with 8 fold
stroke risk; Metabolic syndrome associated with 6 fold stroke risk than
community control group.
The two case control studies from India that included ischemic
stroke in all age groups suggested that Hypertension, Diabetes mellitus and
smoking are important risk factors.[62]
In the Baltimore–Washington Cooperative Young Stroke Study,[63]
which compared 296 cases of incident ischaemic stroke among black and
white adults aged 18–44 years with 1220 community based adults of the
same age group, hypertension, diabetes mellitus and current smoking
emerged as important risk factors.
Melbourne Risk Factor Study,[64] where 201 patients with first onset
stroke due to cerebralinfarction aged 15–55 years compared with the same
number of matched neighbourhood control subjects showed hypertension,
diabetes mellitus, current smoking, heart disease and long term heavy
from Western countries have emphasised the preponderance of cardiogenic
embolism, arterial dissection, procoagulant states and non-atherosclerotic
vasculopathies as possible aetiologies, careful analytic comparisons have
shown the importance of traditional risk factors in thepathogenesis of stroke
SUMMARY
1. Prevalence of stroke increases as the age advances.
2. Stroke was more prevalent in males than females.
3. Stroke patients had high fasting blood sugar, high BP, elevated total
cholesterol, triglyceride, low HDL-C and increased waist circumference
than control group.
4. Metabolic Syndrome was more prevalent in stroke patients. 60% of
stroke patients had metabolic syndrome ; 10% in control group.
5. High FBS was associated with 4 fold stroke risk (4 odds, p 0.01)
compared to control group.
6. Low HDL-C was associated with 2 fold stroke risk (2 odds, p 0.03)
compared to control group.
7. Metabolic Syndrome was associated with 9.6 fold stroke risk (9.6 odds,
p 0.01) compared to control group.
8. Smoking was associated with 8 fold stroke risk (8 odds, p 0.02)
CONCLUSION
1) Metabolic syndrome and its individual components (high FBS and low
HDL-C) were associated with increased risk for ischemic stroke in young
adults.
BIBILIOGRAPHY
1. Bonita R, Mendis S, Truelsen T et al. The global stroke initiative.
Lancet Neurol 2004;3:391–3.
2. Truelsen T, Bonita R, Jamrozik K. Surveillance of stroke: a global
perspective. Int J Epidemiol 2001;30:S11–16.
3. Nayak SD, Nair M, Radhakrishnan K, et al. Ischaemic stroke in the
young adult: clinical features, risk factors and outcome. Natl Med J
India 1997;10:107–12.
4. Lee T-S, Hsu W-C, Chen C-J, et al. Etiologic study of young
ischemic stroke in Taiwan. Stroke 2002;33:1950–5.
5. Garbusinski JM, van der Sande MAB, Bartholome EJ, et al. Stroke
presentation and outcome in developing countries. A prospective
study in the Gambia. Stroke 2005;36:1388–93.
6. Adams HP Jr, Kappelle LJ, Biller J, et al. Ischemic stroke in young
adults. Experience in 329 patients enrolled in the Iowa Registry of
stroke in young adults. Arch Neurol 1995;52:491–5.
7. Kristensen B, Malm J, Carlberg B, et al. Epidemiology and etiology
of ischemic stroke in young adults aged 18 to 44 years in Northern
8. Leys D, Bandu L, Henon H, et al. Clinical outcome in 287
consecutive young adults (15 to 45 years) with ischemic stroke.
Neurology 2002;59:26–33.
9. Nedeltchev K, der Maur TA, Georgiadis D, et al. Ischemic stroke in
young adults: predictors of outcome and recurrence.
J Neurol Neurosurg Psychiatry 2005;76:191–5.
10.Reddy KS. Cardiovascular diseases in non-western countries. N
Engl J Med 2004;350:2438–40.
11.McKeigue PM, Ferrie JE, Pierpoint T, et al. Association of
early-onset coronary heart disease in South Asian men with glucose
intolerance and hyperinsulinemia. Circulation 1993;87:152–61.
12.Dhawan J, Bray CL, Warburton R, et al. Insulin resistance, high
prevalence of diabetes, and cardiovascular risk in immigrants
Asians. Genetic or environmental effect? Br Heart J 1994;72:413–
21.
13.Hatano S. Experience from a multi centre stroke register: a
preliminary report. Bull WHO 1976;54:541–53.
14.Executive Summary of the Third Report of The National Cholesterol
and Treatment of High Blood Cholesterol In Adults (Adult
Treatment Panel III). JAMA 2001;285:2486–97
15.Joslin EP. The prevention of diabetes mellitus. JAMA 1921;76:79–
84.
16.Kylin E. [Studies of the hypertension-hyperglycemia-hyperuricemia
syndrome] (German). Zentralbl Inn Med 1923;44: 105-27.
17.Vague J. La diffférenciacion sexuelle, facteur déterminant des
formes de l'obésité. Presse Med 1947;30:339-40.
18.Avogaro P, Crepaldi G, Enzi G, Tiengo A. Associazione di
iperlipidemia, diabete mellito e obesità di medio grado. Acta
Diabetol Lat 1967;4:572-590.
19.Haller H. [Epidemiology and associated risk factors of
hyperlipoproteinemia] (German). Z Gesamte Inn Med
1977;32(8):124-8.
20.Singer P. [Diagnosis of primary hyperlipoproteinemias] (German). Z
Gesamte Inn Med 1977;32(9):129-33.
21.Phillips GB. Sex hormones, risk factors and cardiovascular disease.
22.Phillips GB. Relationship between serum sex hormones and glucose,
insulin, and lipid abnormalities in men with myocardial infarction.
Proc Natl Acad Sci U S A 1977;74:1729-1733.
23.Reaven GM. Banting lecture 1988. Role of insulin resistance in
human disease. Diabetes 1988;37:1595-607.
24.Ford GS, Giles WH, Dietz WH. Prevalence of the Metabolic
syndrome among US adults: findings from the hird National Health
and Nutrition Examination Survey. JAMA 2002;287:356-9.
25.Cameron AJ, Shaw JE, Zimmet PZ . . The metabolic syndrome:
prevalence in worldwide populations. Endocrinol Metab Clin N Am
2004;33:351-35
26.Ramachandran A, Snehalatha C, Satyavani K, Sivasankari S, Vijay
V. Metabolic syndrome in urban Asian Indian adults-a population
study using modified ATP III criteria. Diabetes Res Clin Pract
2003;60:199-204.
27.Gupta A, Gupta R, Sarna M, Rastogi S, Gupta VP, Kothari K.
Prevalence of diabetes, impaired fasting glucose and insulin
resistance syndrome in an urban Indian population. Diab Res Clin
28.Deepa R, Shantiram CS, Premlalitha G, Shanti NG, Mohan V.
Prevalence of insulin resistance syndrome in a selected south Indian
population-the Chennai urban population study-7 [CUPS-7]. Indian
J Med Res 2002;115:118-27.
29.Okosun IS, Liao Y, Rotimi CN, Prewitt TE, Cooper RS. Abdominal
Obesity and clustering of multiple factors in metabolic syndrome in
White, Black and Hispanic Americans. Ann Epidemiol 2000;10:
263-70
30.Defronzo RA, Ferrannini E. Insulin resistance: a multifaceted
syndrome responsible for NIDDM, obesity, hypertension,
dyslipidemia, and atherosclerotic cardiovascular disease. Diabetes
Care 1991;14:173-94.
31.Ferrannini E, Haffner SM, Mitchell BD, Stern MP.
Hyperinsulinemia: the key feature of a cardiovascular and metabolic
syndrome. Diabetologica 1991;34:416-27.
32.Manson JE, Willet WC, Stampfer MJ, Colditz GA, Hunter DJ,
Hankinson SE, et al. Body weight and mortality among women. N
Eng J Med 1995;333:677-85.
33.Juahan-Vague I, Alessi MC. PAI-1, obesity, insulin resistance and
34.Thompson SG, Kienast J, Pyke SD, Haverkate F, Van de Loo JC.
Hemostatic factors and the risk of Myocardial infarction or sudden
death in patients with angina pectoris. N Eng J Med
1995;332:635-41.
35.Ross R. Atherosclerosis: an inflammatory disease. N Eng J Med
1999;340:115-26.
36.Kannel WB, Anderson K, Wilson PW. White blood cell count and
cardiovascular disease: insights from the Framingham Study. JAMA
1992;257:1253-6.
37.Munro JM, Cotran RS. Biology of disease: atherogenesis and
inflammation. Lab Invest 1988;58:249-61.
38.Yarnell JW, Baker IA, Sweetnam PM, Bainton D, O'Brien JR,
Whitehead PJ, et al. Fibrinogen, viscosity and white blood cell count
are major risk factors for ischemic heart disease: the Caerphilly
Speedwell Collaborative Heart Disease studies. Circulation
1991;83:836-44.
39. Grundy SM, Brewer HB, Cleeman JI, Smith SC, Lenfant D, for the
Conference Participants. Definition of metabolic syndrome: report
Association conference on scientific issues related to definition.
Circulation. 2004;109:433-438.
40. Szapary PO, Hark LA, Burke FM. The metabolic syndrome: a new
focus for lifestyle modification. Patient Care 2002;36:75-88.
41. Gregg EW, Cauley JA, Stone K, Thompson TJ, Bauer DC,
Cummings SR, et al., for the Study of Osteoporotic Fractures
Research Group. Relationship of changes in physical activity and
mortality among older women. JAMA 2003;289:2379-86.
42. Duncan GE, Perri MG, Theriaque DW, Hutson AD, Eckel RH,
Stacpoole PW. Exercise training, without weight loss, increases
insulin sensitivity and postheparin plasma lipase activity in
previously sedentary adults. Diabetes Care 2003;26:557-62.
43. Goodpaster BH, He J, Watkins S, Kelley DE. Skeletal muscle lipid
content and insulin resistance: evidence for a paradox in
endurance-trained athletes. J Clin Endocrinol Metab 2001; 86:5755-61.
44. Keller C, Trevino RP. Effects of two frequencies of walking on
cardiovascular risk factor reduction in Mexican American women.
45. McInnis KJ, Franklin BA, Rippe JM. Counseling for physical
activity in overweight and obese patients. Am Fam Physician
2003;67: 1249-56.
46. Slentz CA, Duscha BD, Johnson JL, Ketchum K, Aiken LB, Samsa
GP, et al. Effects of the amount of exercise on body weight, body
composition, and measures of central obesity: STRRIDE-a
randomized controlled study. Arch Intern Med 2004;164:31-9.
47. Ross R, Dagnone D, Jones PJ, Smith H, Paddags A, Hudson R, et
al. Reduction in obesity and related comorbid conditions after
diet-induced weight loss or exercise-diet-induced weight loss in men. A
randomized, controlled trial. Ann Intern Med2000;133:92-103
48.Hooper L, Summerbell CD, Higgins JP, Thompson RL, Clements G,
Capps N, et al. Reduced or modified dietary fat for preventing
cardiovascular disease. Cochrane Database Syst Rev 2004;(2):
CD002137.
49.Pereira MA, Jacobs DR Jr, Van Horn L, Slattery ML, Kartashov AI,
Ludwig DS. Dairy consumption, obesity, and the insulin resistance
syndrome in young adults: the CARDIA Study. JAMA 2002;
50.Grundy SM, Abate N, Chandalia M. Diet composition and the
metabolic syndrome: what is the optimal fat intake? Am J Med
2002;113(suppl 9B):25S-29S.
51.Trichopoulou A, Costacou T, Bamia C, Trichopoulos D. Adherence
to a Mediterranean diet and survival in a Greek population. N Engl J
Med 2003;348:2599-608.
52. Liu S, Manson JE. Dietary carbohydrates, physical inactivity,
obesity, and the 'metabolic syndrome' as predictors of coronary heart
disease. Curr Opin Lipidol 2001;12:395-404.
53. Jenkins DJ, Kendall CW, Augustin LS, Vuksan V. High-complex
carbohydrate or lente carbohydrate foods? Am J Med 2002;113
(suppl 9B):30S-37S.
54. Hooper L, Bartlett C, Davey SG, Ebrahim S. Advice to reduce
dietary salt for prevention of cardiovascular disease. Cochrane
Database Syst Rev 2004;(2):
55. Vollmer WM, Sacks FM, Ard J, Appel LJ, Bray GA,
Simons-Morton DG, et al., for the DASH-Sodium Trial Collaborative
Research Group. Effects of diet and sodium intake on blood
pressure: subgroup analysis of the DASH-sodium trial. Ann Intern
56. Knowler WC, Barrett-Connor E, Fowler SE, Hamman RF, Lachin
JM, Walker EA, et al., for the Diabetes Prevention Program
Research Group. Reduction in the incidence of type 2 diabetes with
lifestyle intervention or metformin. N Engl J Med
2002;346:393-403.
57. Vega GL. Obesity, the metabolic syndrome, and Cardiovascular
disease. Am Heart J 2001;142:1108-16.
58. Britton M, Carlsson A, de Faire U. Blood pressure course in
patients with acute stroke and matched controls. Stroke
1986;17:861–4.
59. Seshadri S, Wolf PA, Beiser A, Vasan RS, Wilson PW, Kase CS,
Kelly-Hayes M, Kannel WB, D’Agostino RB. Elevated midlife
blood pressure increases stroke risk in elderly persons: the
Framingham Study. Arch Intern Med. 2001; 161: 2343–2350.
60. Sridharan R. Risk factors for ischemic stroke: a case control
analysis. Neuroepidemiology 1992;11:24–30.
61.K.Lipska,P.NSylaja,P.SSarma,K.R.Thankappan,V.R.Kutty,R.SVasa
n,K.Radhakrishnan et al. Risk factors for acute ischaemic stroke in
young adults in South India.Journal of Neurology, Neurosurgery,
62.Bharucha NE, Bharucha EP, Bharucha AE, et al. Case-control study
of completed ischemic stroke in the Parsis of Bombay: a
population-based study. Neurology 1988;38:490–2.
63.Rohr J, Kittner S, Feeser B, et al. Traditional risk factors and
ischemic stroke in young adults: the Baltimore–Washington
Cooperative Young Stroke Study. Arch Neurol 1996;53:603–7.
64.You RX, McNeil JJ, O’Malley HM, et al. Risk factors for stroke due
to cerebral infarction in young adults. Stroke 1997;28:1913–18.
ABBREVIATION
1. FBS-fasting blood sugar
2. BP-blood pressure
3. HDL-C-high density lipoprotein cholesterol
4. TC-total cholesterol
5. TG-triglycerides
6. WC-waist circumference
7. NCEP ATP III-National Cholesterol Education Programe Adult
Treatment Panel III
8. IDF-International Diabetes Federation
PROFORMA
Name: Age/Sex: Occupation:
Address: I.P NO:
Contact No: D.O.A:
Ref Dr: D.O.D:
Chief complaints:
Presenting illness:
Past History:
Treatment History:
Personal History:
General Examination:
Height:
Weight:
W.C.:
Anemia:
Jaundice:
Clubbing:
Cyanosis:
Lymphadenopathy:
Pedal Edema:
Vitals:
Temp:
Pulse:
BP:
RR:
JVP:
Systemic examination:
Cardiovascular system:
Abdomen:
Central nervous system:
Investigations:
1. Complete Hemogram
2. Fasting blood sugar
3. Renal parameters – Blood urea, Serum Creatinine, Serum
Electrolytes.
4. Fasting Lipid profile
5. ECG
6. CXR
7. CT Brain / MRI Brain
8. Echocardiogram
MASTER CHART
Sl no Group Name Gender FBS DM BP HT HDL TG WC MS Smoking
1 1 KUMAR 1 0 0 0 0 1 0 0 0 1
2 1 RAJESH 1 0 0 1 0 0 1 0 0 1
3 1 VIMALA 2 1 1 0 0 1 0 0 0 0
4 1 NAVEEN 1 0 0 0 0 0 0 0 1 1
5 1 SUMAN 1 1 1 1 0 1 0 1 1 1
6 1 GEETHA 2 1 1 0 0 1 1 1 1 0
7 1 GOKUL 1 1 1 1 1 1 1 0 1 0
8 1 HARISH 1 0 0 0 0 0 1 0 0 1
9 1 ARUN 1 1 0 1 1 1 1 0 1 1
10 1 SUDHA 2 1 1 1 0 1 0 0 1 0
11 1 MOHAMMED 1 1 1 0 0 1 0 1 1 0
12 1 MOHAN 1 0 0 0 0 0 0 0 0 1
13 1 NANDHINI 2 0 0 1 1 1 1 0 1 0
14 1 DINESH 1 0 0 0 0 0 1 0 0 1
15 1 RAMESH 1 1 1 0 0 1 1 0 1 1
16 1 GUNASEKAR 1 0 0 1 0 1 0 0 0 1
17 1 GANESH 1 0 0 1 0 0 1 0 0 1
18 1 ANTONY 1 1 1 0 0 1 0 1 1 1
19 1 GANGA 2 0 0 1 0 1 1 0 1 0
20 1 MANI 1 1 1 0 0 0 0 0 0 1
Sl no Group Name Gender FBS DM BP HT HDL TG WC MS Smoking
22 1 ARUL 1 1 0 1 1 1 1 0 1 0
23 1 PRASATH 1 0 0 0 0 0 0 0 0 1
24 1 KALYANI 2 1 0 1 1 1 1 0 1 0
25 1 MUNUSAMY 1 1 0 1 1 1 0 0 1 0
26 1 RAMASAMY 1 1 0 0 0 1 0 1 1 1
27 1 SUDAR 1 0 0 0 0 0 0 0 0 1
28 1 JAGAN 1 0 0 1 0 1 1 0 1 0
29 1 SUNDARI 2 1 0 0 0 0 1 0 0 0
30 1 SIVAJI 1 1 1 0 0 1 1 0 1 1
31 1 KANNAN 1 1 1 0 0 1 1 0 1 1
32 1 SANKAR 1 0 0 0 0 0 0 1 1 1
33 1 JAYANTHI 2 1 0 1 1 0 1 1 1 0
34 1 SHAMEEM 1 0 0 0 0 0 0 0 0 1
35 1 SASIKUMAR 1 1 1 0 0 1 1 1 1 1
36 1 JAMES 1 1 0 1 1 1 0 0 0 1
37 1 VINOTH 1 1 1 1 0 1 0 0 0 0
38 1 KUMUDHA 2 0 0 0 0 1 1 1 1 0
39 1 HUSSAIN 1 1 0 1 1 0 0 1 1 0
40 1 LALITHA 1 1 0 0 0 1 1 0 1 0
41 1 SELVAN 1 1 1 1 0 0 1 0 1 1
42 1 FATHIMA 2 0 0 0 0 1 1 1 1 0
43 1 MARY 2 1 1 0 0 0 0 0 0 0
Sl no Group Name Gender FBS DM BP HT HDL TG WC MS Smoking
45 1 SABAPATHY 1 1 0 1 0 0 0 0 0 1
46 1 SUMATHI 2 1 0 1 1 0 1 0 1 0
47 1 BOOPATHY 1 1 0 1 0 0 1 1 1 0
48 1 GANAPATHY 1 0 0 0 0 0 0 0 0 1
49 1 MURUGAN 1 1 0 0 0 0 0 1 0 0
50 1 VIJAY 1 1 0 0 0 0 0 1 0 1
51 1 LOGANADHAN 1 1 0 1 0 1 0 0 1 0
52 1 JOHN 1 1 0 1 1 1 0 0 1 1
53 1 BALA 1 0 0 0 0 0 1 1 0 1
54 1 KUMARAN 1 0 0 0 0 0 0 0 0 1
55 1 SRIKUMARAN 1 1 0 0 0 0 1 1 1 0
56 1 GOMADHI 2 1 0 1 0 0 0 0 0 0
57 1 AMALA 2 1 0 1 1 0 1 1 1 1
58 1 STEPHEN 1 1 0 1 0 0 1 0 1 1
59 1 NARMADHA 2 1 0 0 0 1 1 1 1 0
Sl no Group Name Gender FBS DM BP HT HDL TG WC MS Smoking
1 0 DIVYA 2 0 0 0 0 0 0 1 0 0
2 0 FEDRIK 1 0 0 0 0 0 0 0 0 0
3 0 GOKUL 1 0 0 0 0 1 0 0 0 0
4 0 VISU 1 0 0 0 0 0 0 0 0 0
5 0 KAMALI 2 1 1 0 0 0 0 0 0 0
6 0 NARESH 1 0 0 1 1 0 0 0 0 0
7 0 ANAND 1 0 0 0 0 0 1 0 0 0
8 0 PARUTHI 1 1 0 0 0 1 1 0 1 0
9 0 JACK 1 1 0 0 0 0 1 0 0 0
10 0 BAGAT SINGH 1 0 0 0 0 0 0 0 0 0
11 0 ANURADHA 2 0 0 1 0 1 0 0 0 0
12 0 VELU 1 0 0 9 0 0 0 1 0 0
13 0 RAJA 1 0 0 9 0 0 0 0 0 1
14 0 RATHNAM 1 0 0 9 0 0 0 0 0 0
15 0 SHANMUGAN 1 0 0 9 0 0 0 0 0 1
16 0 MATHI 1 0 0 9 0 0 0 0 0 0
17 0 NALINI 2 1 1 1 1 1 1 0 1 1
18 0 AZHAGAN 1 0 0 0 0 1 0 0 0 0
Sl no Group Name Gender FBS DM BP HT HDL TG WC MS Smoking
20 0 VIVEK 1 0 0 0 0 0 0 0 0 1
21 0 RUPA 2 0 0 1 0 1 1 0 1 0
22 0 NAGARAJ 1 0 0 0 0 0 0 0 0 1
23 0 RAMAN 1 0 0 0 0 0 0 0 0 0
24 0 PRIYA 2 0 0 0 0 0 0 1 0 0
25 0 THILAK 1 1 1 0 0 0 1 0 0 0
26 0 SEETHARAM 1 0 0 0 0 0 0 0 0 0
27 0 RAJARAMAN 1 0 0 0 0 0 0 0 0 1
28 0 BARANI 1 0 0 1 1 1 1 0 0 1
29 0 GNANASUNDAR 1 0 0 0 0 1 0 0 0 0
KEY TO MASTER CHART
Group
1- cases
2- controls
Gender
1- males
2- females
Age group
1- 31-35yrs
2- 36-40yrs
3- 41-45yrs
FBS-fasting blood sugar
0- <100mg/dl
1- >100mg/dl
DM-Diabetes Mellitus
0- not a known diabetic
1- known diabetic on treatment
0- <130/85mmHg
1- >130/85mmHg
HT-Hypertension
0- not a known hypertensive
1- known hypertensive on treatment
HDL- high density lipoprotein
0- >40mg/dl in males
>50mg/dl in females
1- <40mg/dl in males
< 50mg/dl in females
TG-triglycerides
0- <150mg/dl
1->150mg/dl
WC-waist circumference
0-<90cm in males
< 80cm in females
1- >90cm in males
MS-metabolic syndrome
0- absent
1- present
Smoking
0- absent