ASSESSMENT OF LV SYSTOLIC FUNCTION BY
VELOCITY VECTOR IMAGING
A DISSERTATION
SUBMITTED IN PARTIAL FULFILLMENT
OF DM – BRANCH II CARDIOLOGY EXAMINATION
OF THE TAMILNADU DR. MGR MEDICAL
CERTIFICATE
This is to certify that the thesis titled “Assessment of LV systolic function
by velocity vector imaging” is the bonafide work of the candidate
Dr.Kumar.N, towards partial fulfillment of DM - Branch II (Cardiology)
Examination of the Tamilnadu Dr. MGR Medical University, Chennai, to be
conducted in July/August 2008.
Dr. George Joseph,
MD DM (CARD)
Professor & Head
,
CERTIFICATE
This is to certify that the thesis titled “Assessment of LV systolic function
by velocity vector imaging” is the bonafide work of the candidate
Dr.Kumar N, towards partial fulfillment of DM - Branch II (Cardiology)
Examination of the Tamilnadu Dr. MGR Medical University, Chennai, to be
conducted in July / August 2008.
Guides:
Dr. Paul V George,
MD DM (CARD)Professor & Ag. Head
Department of Cardiology Unit II,
Christian Medical College,
Vellore – 632 004.
Dr. V. Jacob Jose
,
MD DM (CARD) FACC, MS, FCCP, FIAEProfessor
ACKNOWLEDGEMENTS
The DM thesis was a challenging but valuable learning experience. I thank God
for helping me to finish it successfully. All along, there have been people who
helped me and without whom this thesis would not have been possible.
I am immensely grateful to Professors Dr. V. Jacob Jose and Dr. Paul George
who provided guidance, encouragement and support for my thesis at all stages.
I am grateful to Dr. George Joseph, Head of the Department for his
encouragement and support.
I am thankful to Dr Sunil Chandy, Dr. Oommen George and the entire faculty in
the department who have provided a conducive and academic environment in
which to carry out the dissertation.
I thank Dr. Regi Oommen, Professor of Nuclear Medicine for facilitating smooth
performance and analysis of gated SPECT.
I would also like to thank my parents for providing moral support and
encouragement at all times.
Lastly, I am immensely grateful to all the patients who participated in this study
and who always form the epicenter of all our learning.
CONTENTS
Page
Abstract
1. Introduction ---- 1
2. Aims and Objectives ---- 3
3. Review of Literature ---- 4
4. Methodology ---- 42
5. Results ---- 45
6. Discussion ---- 54
7. Limitations ---- 59
8. Summary of Main Findings ---- 60
9. Bibliography ---- 61
10. Appendix:
Study Proforma
Master Chart
Abstract
ASSESSMENT OF LV SYSTOLIC FUNCTION BY VELOCITY VECTOR
IMAGING
BACKGROUND: Assessment of LV systolic function is an important parameter in evaluation of cardiac disease. Echocardiography is the most widely used non invasive imaging modality in the assessment of LV function. Current methods of assessing LV systolic function have limitations. Velocity vector imaging (VVI) is a new modality that uses 2D (B-mode) images to determine tissue motion and velocity by application of a tracking algorithm. In this study, we assessed the utility of VVI in the measurement of LV systolic function in comparison to radionuclide imaging and standard 2D echo.
METHODS: We measured global and regional LV systolic function by ejection fraction (EF) in 49 patients using VVI, standard 2D echo and nuclear imaging (SPECT). Patients were
categorized as normal; mild, moderate or severe LV systolic dysfunction based on American Society of Echocardiography classification. The results were analyzed by appropriate
statistical tests for correlations.
RESULTS: The mean EF for the study population as measured by VVI was 35 ± 12.08%, as compared to 54.2 ± 19.51% with SPECT (p<0.001 vs VVI) and 50.3 ± 8.92% with 2D
echo(p<0.001 vs VVI). There was a positive linear correlation between EF measured by VVI and the other modalities (Pearsons correlation coefficient 0.577 for SPECT and 0.573 for 2D; p = 0.01). However, VVI systematically underestimated the EF in comparison to SPECT. There were significantly greater proportion of patients classified as having moderate or severe LV systolic dysfunction by VVI (75.5%) when compared to SPECT (34.7%; p=0.026). We derived a correction factor to calculate SPECT EF from VVI EF: EF (SPECT) = EF (VVI) x0.9 + 21 or approximately VVI (EF) +20. There was good inter-observer correlation for EF
measured by SPECT.
INTRODUCTION
Cardiovascular disease is one of the leading causes of morbidity and mortality worldwide. Our country has faced an epidemic of ischemic heart disease over the past decade. Hence new tools for diagnosis and prognostication in heart disease are constantly being developed and evaluated.
Measurement of left ventricular (LV) function has a central role in the assessment of a wide variety of cardiac diseases. While measurement of systolic function is almost always done as a routine, detailed evaluation of diastolic function is done in selected instances. The degree of LV systolic dysfunction is a powerful predictor of cardiovascular morbidity and mortality1 and
is often crucial in deciding therapy. Clinical evaluation alone has been shown to have poor sensitivity and specificity to detect LV dysfunction, while the electrocardiogram and chest X-ray have only limited utility2. Though several new tools such as CT and MRI have entered the
diagnostic armamentarium, echocardiography continues to be the most important and widely used modality in the measurement of LV systolic function. In this regard, the ejection fraction (EF) has been the most commonly used measure of LV systolic function. With real-time two dimensional imaging of the heart, it has been possible to rapidly and non-invasively measure EF and also perform serial measurements to track the course of disease. EF is a simple and easy to understand numeric measure, and has been shown to predict survival3. Though EF
has limitations as a true indicator of LV function, it continues to have global appeal4. However,
a greater problem often is technical difficulties in measurement of EF, especially with respect to correct endocardial border detection which is crucial to the accuracy of measured EF5. In
resynchronization (CRT) and implantable cardioverter defibrillator (ICD) therapy6. Thus it is
important to look at ways and means of overcoming technical limitations in measurement of EF by echocardiography.
Speckle tracking echocardiography (STE) is an exciting new tool with promising potential which uses natural acoustic markers in conventional gray scale ultrasound images7. This can
be potentially used to track motion of the myocardium. A new technology based on speckle tracking is velocity vector imaging (VVI) which displays velocities of the myocardium using a unique and multi-dimensional tracking algorithm8. VVI may thus be helpful in accurately
AIMS AND OBJECTIVES
Aim:
The aim of the study is to assess the accuracy of the new echocardiographic modality, velocity vector imaging in measuring left ventricular ejection fraction by comparing it with nuclear gated SPECT and standard 2D echo.
Objectives:
1. To measure global and regional EF using velocity vector imaging in a cohort of patients. 2. To find out the correlation between EF measured by VVI and that measured by nuclear gated SPECT and standard 2D echo.
3. To classify patients into categories of LV dysfunction based on EF measured by VVI and compare it with similar categorization done using SPECT and 2D echo.
REVIEW OF LITERATURE
Echocardiography is an extremely useful and extensively used investigative modality. Its advantages include ease of performance, ready availability, portability and avoidance of intravenous contrast or radiation. The assessment of LV systolic function is a key part of the echocardiographic examination. Various methods are available to measure LV systolic function by echo, though none is perfect. It is being increasingly recognized that left
ventricular geometry9 and motion is complex and multi-dimensional, and a single measure of
LV systolic function may not be all-encompassing. Thus, there is a constant endeavour to develop newer echocardiographic techniques to better assess LV performance.
Physiology of Cardiac contraction:
The myocardial muscle cells or myocytes are the cells responsible for executing the
contraction-relaxation function of the heart. They constitute a major volume and mass of the myocardium. Groups of myocytes form myofibers. Myocytes are bound by a membrane called the sarcolemma which forms invaginations called T tubules. The major cellular organelle within the myocyte responsible for triggering contraction is the sarcoplasmic reticulum (SR) which has large stores of calcium. A wave of depolarization initially releases a small amount of calcium from the T tubules which then cause a larger release from the SR initiating
towards each other, resulting in shortening. Contraction is an energy-dependent process which is achieved by breakdown of adenosine triphosphate (ATP). The opposite process occurs in relaxation. An understanding of the molecular mechanisms involved in contraction-relaxation helps to clarify the role of physiologic and metabolic factors in modulating LV
contraction. For example, catecholamines increase LV contractility by acting on β1 adrenergic receptors which cause a cyclic AMP mediated increase of calcium release from the
sarcoplasmic reticulum.
The Cardiac Cycle:
Onset of left ventricular contraction caused by depolarization causes a build up of pressure in the LV. When left ventricular (LV) pressure exceeds left atrial pressure, closure of the mitral valve occurs producing the first heart sound. This is followed by isovolumic contraction, during which time pressure in the ventricle rapidly rises. When the LV pressure exceeds aortic
Frank-Starling Mechanism:
Within physiological limits, if a larger heart volume increases the initial length of the muscle fiber, the contraction is stronger and thus more blood would be ejected. The rate of rise of pressure is more rapid and so is the rate of relaxation11. This principle is important in changes
in cardiac output which occurs in physiological conditions.
Preload refers to the initial ventricular volume or pressure prior to onset of contraction, which would essentially be the state of the ventricle at end-diastole. As evident from the Frank-Starling principle described above, preload is important in determining the strength of the subsequent LV contraction.
Afterload refers to the systolic load on the ventricle once it has started to contract and essentially offers resistance to ventricular ejection. The degree of afterload dictates LV wall stress. In a normal heart, the LV can overcome most acute changes in load. However, if a significant resistance continues over a period of time, compensatory change in the form of hypertrophy would occur to generate additional pressures.
Definitions:
Systole is defined as the portion of the cardiac cycle from mitral valve closure to aortic valve closure.
Stroke volume is the amount of blood ejected from the left ventricle in a single cardiac cycle and the total amount of blood ejected in a minute is the cardiac output. Thus the cardiac output equals the product of the stroke volume and the heart rate.
increase in afterload results in a fall in the stroke volume. Thus, a pure measurement of ventricular contractility independent of loading conditions poses challenges.
Diastolic function refers to the relaxation properties of the LV. Normal diastolic function is also important to the overall function of the heart, as a proper and adequate relaxation determines the preload of the subsequent systole. Hence systolic and diastolic functions are not strictly separate and are in fact intertwined with each other. However, for clinical purposes, they are studied separately using different measures.
Various methods have been developed in echocardiography to measure LV systolic function including M-mode, 2D, Doppler and new techniques such as tissue Doppler imaging, strain and strain rate. In addition, 3D echo has now emerged as a potential tool for accurate LV volume measurement. A brief overview of these methods is given below before discussing the emerging avenues of speckle tracking and velocity vector imaging.
M-MODE:
The early attempts to measure LV function used M-mode echocardiogram to perform linear measurements of the LV. The advantage of M-mode is the superior temporal resolution compared to 2D echo. Measurement of the LV dimensions in end diastole and end systole give an idea of the LV volumes.
Fractional shortening (FS) can be calculated as the difference between the end diastolic and end systolic dimensions of the LV, divided by the end diastolic dimension. Fractional
shortening is a rough measurement of LV systolic function; with the measured value being compared to an established normal range 12. Although simple to measure, FS is dependent
on loading conditions and heart rate13.
Another linear measurement is the descent of the base. During LV contraction, the base of the heart moves toward the apex, and as the apex is relatively fixed; this movement is directly proportional to systolic function. M-mode interrogation of the lateral mitral annulus is done and the amount of excursion determined.
E-point septal separation: The magnitude of opening of the mitral valve, which is seen as the height of the E-wave in an M-mode cut, correlates with transmitral flow and therefore stroke volume. Similarly, the LV internal dimension in diastole correlates with end-diastolic volume. So, a comparison of the above two parameters can give an idea of the ejection fraction. This is obtained by measuring the distance between the mitral valve E point and the left side of the ventricular septum. An increase in this distance reflects a decreased ejection fraction.
Looking at the pattern of aortic valve opening also provides indirect assessment of LV function. If the stroke volume is reduced, there is a gradual reduction of forward flow in late systole, which results in a gradual closure of the aortic valve giving a rounded appearance15.
Regional function can be assessed by looking at systolic thickening. However, this requires both the endocardium and the epicardium to be defined; the latter posing technical difficulties. 2D guided M-mode imaging in different planes may have to be used for optimal visualization; however normal ranges for quantitative assessment have not been well defined.
more direct measures of LV size and function available from two dimensional echocardiography.
TWO DIMENSIONAL ECHOCARDIOGRAPHY:
Two-dimensional echocardiography (2 D echo) gives greater spatial resolution to measure LV function. Determination of LV volumes is based on endocardial border tracing at end-diastole and end-systole in one or more planes. Prerequisites for a good 2D examination include good image quality, adequate endocardial definition and proper visualization of the apex of the LV. A simple 2D measure of LV function is the fractional area change (FAC) which is calculated in the short axis view of the left ventricle by comparing the diastolic area with the systolic area. However, this represents LV function only at the level being interrogated and thus will not reflect regional dysfunction.
Ejection Fraction:
2D echo is used to measure left ventricular volumes and to calculate the ejection fraction (EF) from it. The difference between the end-diastolic and end-systolic volumes of the LV gives the stroke volume. Ejection fraction is defined as the stroke volume divided by the end-diastolic volume and expressed as a percentage.
Methods of assessment of EF by 2D echo:
Subjective Assessment: Since EF is a unitless ratio, it is often assessed by visual estimation, which in the hands of experienced echocardiographers has been found to have reasonable correlation with trackball measurements17. However, this does not measure actual LV
or significant tachycardia.
LV Volume Measurement: Due to the complex shape of the LV, geometric assumptions have to be made in extrapolating volumes from 2D images. Various geometrical formulas have been used such as the area-length method, single-plane ellipsoid, biplane-ellipsoid and hemisphere cylinder18, all of which have shortcomings and are based on the assumption that
the ventricle will adhere to a predictable shape. Regional dysfunction further decreases the accuracy of these methods.
Simpson’s Rule: With improvement of resolution in 2D echo, direct assessment of LV
volumes in apical views has become possible and the most commonly used method now for estimating EF is the Simpson’s rule. The endocardial border is defined in an apical 2 or 4 chamber view in end-diastole and end-systole. The ventricle is divided into a series of disks along the long axis from apex to base and the LV volume is obtained by summation of the volumes of individual disks19. This method is not completely free from geometric assumption
as each disk is expected to be circular. Foreshortening of the LV apex will result in incorrect measurement of EF. Other potential pitfalls include failure to direct the ultrasound beam through the center of the LV resulting in a tangential cut and inaccurate tracing of the endocardial borders due to myocardial dropout or poor image quality which results in erroneous volumes. Tissue harmonic imaging20 and contrast echocardiography21 help to
overcome the latter problem to some extent. Intravascular contrast agents significantly
improve endocardial border detection and EF measured using contrast echo has been shown to correlate with 3D echo and MRI22. Also, techniques for automated identification and
tracking of the endocardial border and automatic quantification of LV volume, such as acoustic quantification23 and colour kinesis24 have been developed but these require
Figure1. Simpsons method: Systolic and diastolic frames
Advantages of EF:
Ejection fraction is widely used as it is easy to obtain and has been shown to robustly predict mortality,3 i.e. lower the EF, lower the survival. EF has been shown to be more important
than the number of diseased coronary arteries25 or the degree of perfusion defects26. EF has
not only prognostic implications, but also guides therapeutic decision making. Many large multicenter trials have used EF as the sole measure of LV function. It has become the gatekeeper for biventricular pacing, defibrillator implantation6 and drug therapy initiation.
Thus, a lot of weightage is given to this particular parameter.
Disadvantages:
Technical difficulties in measurement, especially endocardial border definition have already been mentioned. Interobserver variability exists in measured EF. In addition, EF is dependent on both preload and afterload. In aortic stenosis, the increase in afterload due to outflow obstruction falsely attenuates the EF, which improves after the obstruction is removed. In mitral regurgitation, the low afterload due to decompression of the LV into the dilated left atrium (LA) falsely augments EF27. After the mitral valve is repaired or replaced, the EF could
volumes may be more useful to track remodelling28. In a situation of acute ischemia such as
during an acute coronary syndrome, non ischemic segments may become hyperkinetic and compensate for the poorly contracting ischemic area, with overall EF remaining in the normal range. As the function of the ischemic segment recovers, hyperkinesis would resolve and those segments would revert back to their normal state of contraction. All this while, EF has not changed, even though considerable pathophysiological processes have occurred.
Increasingly, use of EF alone has been considered insufficient as a comprehensive measure of LV systolic function especially in view of availability of new echocardiographic methods and better understanding of the dynamics of LV function in recent times29.
Load corrected parameters:
As mentioned above, loading conditions affect measurement of the LV function and there have been attempts to derive parameters which correct for the loading state. LV midwall shortening expresses the stress shortening relation of the ventricle. The use of midwall
shortening is less dependent on LV geometry than are endocardial measurements. The other approach is to draw pressure-volume loops to show the association between loading and inotropic state. The end systolic pressure volume relationship is drawn or LV wall stress against LV dimension can be plotted. An increase in the slope of the curve corresponds to increased contractility and decrease corresponds to reduction in contractility. These
parameters are not easy to measure non-invasively and are not used in routine practice18.
Three Dimensional Echocardiography:
shown in relationship to each other in all three spatial dimensions.
Earlier approaches to 3D echo used a series of 2D images to reconstruct a 3D data set using offline software. The quality of 3D reconstructions from 2D images depends on a number of factors, including the intrinsic quality of the ultrasound images, the number (or density) of the 2D images used to reconstruct the 3D image, the ability to limit motion artifact, and adequate ECG and respiratory gating. In general, the greater the number of images obtained (i.e., the smaller the space intervals between images), the better the 3D reconstruction. However, increasing the number of images also lengthens the acquisition time, which can potentially introduce motion artifact. Consequently, the optimal number of images necessary for 3D reconstruction depends on the cardiac structure being examined and the resolution required. For example, 4 to 6 serial images are usually adequate for volume reconstructions of the left ventricle (LV), whereas more images are often needed to visualize more complex, rapidly moving structures, such as mitral and aortic valves.
Figure 2. Progression from 2D imaging to 3D narrow-angle (NA) to 3D full-volume (FV) imaging.
Measurement of LV Volumes & function:
The wide-angle acquisition mode can be used to acquire the entire LV volume, from which a detailed analysis of global and regional wall motion can be done. Images may be displayed with either orthogonal long-axis views or multiple short-axis views. Intravenous contrast can be used as in 2D to better define the endocardial border. Multiple studies have validated the volumes measured by 3D against MRI and other modalities31, 32. It has been shown to be
it impacts clinical decision-making over and above the information provided by 2D.
Right Ventricle: As the right ventricle has an asymmetrical pyramidal shape, assessment by 2D echo has limitations as it does not conform to geometric assumptions. Three dimensional imaging of the entire RV, especially with real time 3 D echo holds potential to more accurately assess RV function. Studies done using 3D echo involving offline processing of 2D data have demonstrated improved accuracy in assessing the RV33.
The main limitation of 3D echo has been the difficult process of reconstruction using data from multiple 2D image sets, where even minor changes in transducer position will
significantly affect image quality and endocardial definition. The availability now of faster processors and improved computer algorithms which allow real time 3D data acquisition has been more accurate. 3D echo is likely to be the future technology of choice to assess
ventricular volumes and remodelling but the technology is not readily available at present.
Regional Function Assessment by 2D echo:
Subjective Assessment:
As echocardiography is frequently used to assess coronary artery disease, where perfusion is deficient to certain areas of the myocardium, assessment of regional function is particularly important. Subjective assessment can be done by describing regional wall motion abnormality (RWMA) i.e. the contractility of specific segments as normal, hypokinetic, akinetic or
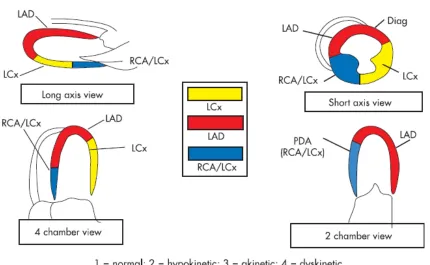
dyskinetic. The American Society of Echocardiography has proposed a standard 16 segment model for description of RWMA. Recently a 17th segment, namely the true apical segment has
as 1 for normal, 2, 3 and 4 for hyokinesia, akinesia and dyskinesia respectively. The total score thus obtained is divided by the number of segments analyzed to obtain the WMSI. This acts as an index of global LV function and has been shown to correlate with prognosis34.
Quantitative methods:
[image:22.612.64.494.286.551.2]In order to introduce an element of objectivity, certain quantitative methods to assess regional function have been proposed.
Figure.3 The 16 segment American Society of Echocardiography model for characterization of regional LV function, and usual coronary artery distribution of the segments.
by a series of chords extending perpendicular to the center line. This gives an idea of the displacement from
diastole to systole. This has also been called chordal shortening method. This method has shortcomings and is also time consuming.
2. Colour Kinesis method- This method uses acoustic quantification to define the border based on the difference in backscatter between the LV cavity and the endocardium. The excursion of the myocardium is tracked in successive frames and each is given a different colour code. The resultant display is overlaid on the 2D image and displacement calculated as segmental area shrinkage, is portrayed as stacked histograms. This method requires good image quality. Rotational and translational (movement of the heart within the chest cavity) movement of the heart contributes to errors18.
RWMA can be present without ischemia in conditions such as bundle branch block, pacing, pre-excitation and post cardiac surgery. However, in these conditions, systolic thickening is preserved, which is almost invariably affected in true regional dysfunction.
DOPPLER EVALUATION OF LV FUNCTION:
Doppler measurement of flow can be used to assess LV function. The simplest technique is to calculate stroke volume by measuring the time velocity integral (TVI) of the LV outflow tract (LVOT), which is then multiplied by the cross sectional area of the LVOT to obtain volume. Comparison of left and right sided ejections by this method can be used to calculate their ratio (Qp/Qs) in congenital heart disease. Though it is simple, small errors in measuring the
dimension of the LVOT would result in large variations in the final volume measured.
limiting the influence of afterload. Mitral regurgitation needs to be present in order for dp/dt to be measured by echo. It is determined by measuring the time it takes for the mitral
regurgitation jet velocity to increase from 1 m/sec to 3 m/sec which represents the time taken for a pressure change of 32 mm Hg to occur. The dp/dt is then calculated as 32 divided by the measured time. The negative dp/dt measured over the second half of the curve is an indicator of diastolic function and relaxing properties of the ventricle. Dp/dt overcomes the problem associated with using EF in a patient with significant MR which was described earlier. It has been found to be an independent prognostic indicator in heart failure35 and can help predict
the occurrence of LV dysfunction after mitral valve replacement36.
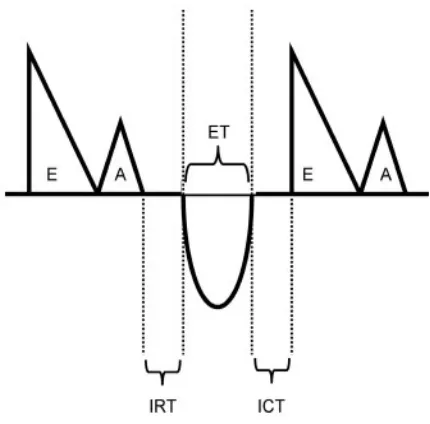
The myocardial performance index (MPI or Tei index) is a relatively load-independent
measure of LV function37. It is calculated as the sum of the isovolumic contraction time (ICT)
and isovolumic relaxation time (IRT), divided by the ejection time (ET). It is measured using the Doppler inflow of the mitral valve and that of the LVOT as shown in figure 4. This is said to be a measure of both systolic and diastolic function38 and is useful in assessing right
ventricular performance also39.
Figure 4. Tei Index measurement
Measurement of wall stress:
Wall stress is defined as the force over each unit of cross sectional area and the force is determined by pressure in the ventricular cavity. As it accounts for both wall thickness and pressure generation, it is relatively afterload-independent and has been used for
measurement of myocardial contractility. It can be calculated globally or regionally, as well as in mutually orthogonal planes i.e. meridional stress imposed by long axis (base-apex)
shortening and circumferential stress in the minor axis40, 41. Measures of wall stress are most
useful in ventricular pressure or volume overload states such as hypertension, aortic stenosis and mitral or aortic regurgitation.
TISSUE DOPPLER IMAGING:
Tissue Doppler imaging (TDI) is an exciting new tool that is easy to perform and
reproducible42. This technique uses specific receiver gains and frequency filters to eliminate
typically an order of magnitude below that of blood velocity. The signal from tissue movement is displayed as a colour display overlaid on the anatomical image itself, or more commonly pulsed Doppler is used for spectral analysis of TDI velocities which is more reliable. TDI has good spatial and temporal resolution. A number of parameters can be derived from TDI in systole and diastole which have been proposed to be useful in a variety of cardiac diseases43.
Magnitude of excursion of the mitral annulus has been shown to be a sensitive measure of LV function; is affected early by ischemia44 and correlates with LVEF45. Measuring this using
M-mode is tedious. Peak systolic velocity in ejection period measured using TDI at the mitral annulus (Sa) or at myocardial segments (Sm) is easier to perform. Peak myocardial systolic velocity averaged from 6 sites around the mitral annulus correlates well with LVEF, and a cut-off of >7.5 cm/s had a sensitivity of 79% and a specificity of 88% in predicting normal global LV function46. Reduced TDI velocities have been shown to be useful in detecting mild
impairment of LV systolic function in those with a normal EF or so called diastolic heart failure47 and in diabetic subjects without overt heart disease48 . Reduced TDI velocities can
Figure 5. TDI of septal mitral annulus
hypertrophy is not present49. Hence TDI can be used for early identification of hypertrophic
cardiomyopathy.
Peak early (Ea) and late (Aa) mitral annular diastolic velocities can also be measured as indices of diastolic function. Ea is a marker of the speed of myocardial relaxation50. Reduction
in Ea is one of the earliest indicators of diastolic dysfunction and it remains reduced at all stages of diastolic dysfunction51, 52. Thus Ea remains low even when there is
pseudonormalization or a restrictive filling pattern by conventional mitral inflow Doppler. Hence the E/Ea ratio increases as diastolic dysfunction worsens and has been shown to correlate with LV filling pressure or pulmonary capillary wedge pressure (PCWP) 53. E/Ea ratio
greater than 15 is said to correlate with a PCWP of > 20 mm Hg. This ratio predicts survival after acute myocardial infarction54 and has incremental prognostic value over EF55. Reduced
deceleration time in patients with heart failure and also in those with hypertrophy and normal ejection fraction.
Reduced annular systolic and diastolic velocities are independent predictors of mortality, with Ea being a stronger predictor. Reduced velocities of < 3 cm/sec were found to be associated with a lower survival56. They also add incremental risk above wall motion scores in coronary
artery disease and predict cardiac mortality. In patients with mitral regurgitation, reduced lateral mitral annulus systolic velocity could predict those who would develop reduction in EF after mitral valve replacement surgery.
TDI has been used to measure peak myocardial displacement and velocity in those
undergoing dobutamine stress echo. Reduced tissue velocity of < 6 cm/sec in stress echo has been shown to correlate with mortality and risk of acute coronary events even when assessment by wall motion score did not show a significant difference57. Another important
application of TDI is in measuring mechanical dyssynchrony in heart failure subjects. The time to onset or peak of systolic velocity is assessed in different segments and the delay
calculated58, 59. Dyssynchrony measured by TDI predicts clinical outcomes in heart failure
even in subjects with narrow QRS60 on ECG and can help predict response after CRT61.
The main limitation of tissue Doppler is the angle dependency of the technique, as accuracy depends on good alignment of the pulsed Doppler in line with the region of interest.
Assessment of apical function is therefore unsatisfactory. Also, use of tissue velocity examines tissue movement with respect to the transducer and not with respect to adjacent tissue. The movement of a given segment is influenced by the motion of the adjacent
STRAIN AND STRAIN RATE:
Strain or myocardial deformation imaging is conceptually appealing as it does not rely on motion with respect to the transducer but the relative motion between two segments within the myocardium. Two tissue Doppler samples can be recorded within the LV wall; if the sample volumes are moving apart, tension is produced just as if a rubber band is being stretched (positive strain). If the points are moving towards each other, then it would be as if the rubber band is being collapsed and tension decreases (negative strain). Thus, positive strain
corresponds to relaxation and negative strain corresponds to contraction. Raw Doppler information provides the rate of change of length of tissue (distance over time) or strain rate. A two dimensional assessment looking strictly at only length gives strain.
Strain & strain rate can be measured by TDI62 and more recently speckle tracking (described
later). Strain Rate (SR) is a more sensitive measure than strain because a weaker contraction could theoretically reach the same peak strain, but at a slower rate. However, SR is noisier, limiting its ability to differentiate normal from abnormal. Determination of timing intervals and peak values in both longitudinal and radial views for both strain and SR can be obtained and compared with established normal values63, 64. Measurements of myocardial deformation with
these techniques have been validated using microcrystals and magnetic resonance65, 66.
Strain and strain rate can be potentially used to identify viable myocardium67 and early
ischemia68. Reduction of strain and SR has been correlated with myocardial fibrosis which
itself is a marker of adverse cardiac risk69. It may also be useful as an indicator of subclinical
disease70 and in assessing response to therapy71. Though implications of strain responses to
therapy are not well established, it seems likely that an improvement in deformation is likely to have a beneficial outcome.
Significant data storage and computational ability is required for strain & SR studies. SR seems to be relatively independent of heart rate (chronotropy) 72 and relatively
afterload-independent70, but it would likely be preload-dependent, as initial diastolic dimension would be
expected to affect strain by the Frank-starling principle. Improvement in techniques and further studies would likely delineate the full potential of strain rate imaging.
SPECKLE TRACKING ECHOCARDIOGRAPHY:
Speckle tracking echocardiography (STE) has recently been introduced as a novel method for quantification of myocardial performance. It is angle-independent in contrast to TDI7.
Speckles are natural acoustic markers that occur as small and bright elements in
conventional grayscale ultrasound images73. They are produced as a result of constructive
and destructive interference of ultrasound, back-scattered from structures smaller than a wavelength of ultrasound74. These speckles are distributed equally around in the myocardium
on the ultrasound image and can be identified and followed in consecutive frames during the heart cycles. Software that has the ability to assess myocardial strain, strain rate, velocities and displacement from these speckles has recently been developed75. Different speckle
[image:30.612.139.395.533.708.2]tracking algorithms have been validated in experimental and human studies76, 77.
Longitudinal and radial strain can be estimated accurately by STE; in addition, myocardial velocities and displacement of the mitral annulus can be measured. Circumferential strain can also be measured due to angle-independency of the method. STE has also been used to predict response to cardiac resynchronization therapy and a recent clinical study
demonstrated that assessment of radial strain by STE may quantify dyssynchrony and predict immediate and long-term response to cardiac resynchronization therapy78. A limitation of STE
is that the time resolution in studies using STE has been in the range of 60-100 frames per second to optimize speckle quality. However, higher frame rates may be needed to reliably measure myocardial strain and velocity.
STE technology is still evolving and few systematic studies are available, but so far it seems to provide an accurate, simple and direct measure of myocardial deformation and velocity. Thus it has the potential to become a bedside clinical tool. Another novel technology that further builds upon STE is velocity vector imaging (VVI) which is described below.
VELOCITY VECTOR IMAGING:
Figure 7. Circumferential strain by STE. A, Circumferential strain from the apical LV level in a healthy individual. Note the homogenous circumferential distribution of normal systolic strain. B, Circumferential strain at the LV apical level in a patient with a LAD-related myocardial infarction. Note reduced systolic shortening (strain) in the anterior, septal, and inferior segments, with marked postsystolic contraction (white arrows). In addition, in the septal segments, there is early systolic stretching indicating dyskinesia (red arrow).
VVI is not a simple speckle tracking algorithm alone, but also includes global motion coherence, consistency of periodicity between cardiac cycles and other techniques. VVI extracts cardiac motion by tracking a user-defined trace which is typically drawn along an endocardial border. The trace is tracked throughout one or more cardiac cycles by successive applications of a series of tracking steps. By tracking key reference points, inward and
outward border motion, motion of tissue along the direction of the border, and by constraining the tracking to be periodic over the R-R interval, VVI computes robust estimates of the
cardiac motion. At each stage of the tracking, Fourier analysis is used and applies the constraint that the trace must return to the same location at the subsequent cardiac cycle79.
Thus, the borders are not “detected”, but “tracked” over time. Prerequisites to use the VVI algorithm include a good quality 2D image encompassing the entire region of interest and at least one full R-R interval must be captured to enable the algorithm to use the periodicity of the cardiac cycle.
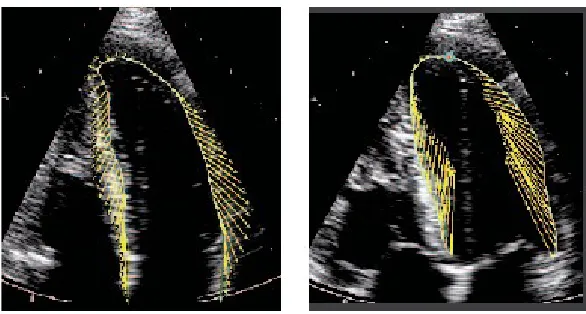
Image Display:
Yellow velocity vectors, placed on the B-mode image, indicate the direction and relative
Figure 8. VVI analysis of a normal heart in diastole and systole
Strain and strain rate are calculated along the border. Strain is computed from the changing distance between the tracked trace points plus the differences in velocity of the tissue moving behind these points. Thus, strain reflects the relative change in distance between points of tissue along the border, reflecting lengthening or shortening.
VVI can also be used to assess cardiac dyssynchrony. VVI displays the tangential and radial velocity, strain, strain rate, and tangential and radial displacement for different myocardial segments. The time to peak value of these measurements can be obtained and displayed; thus lack of synchrony in motion of the different segments can be identified. This can also be easily visually appreciated by observing a trace overlaid with velocity vectors showing the speed and direction of movement of different regions (figure 9).
It has been proposed that VVI would have additive value over TDI in analysis of dyssynchrony especially with regard to circumferential and radial mechanics of the ventricle and also be useful to assess resynchronization after CRT8. Cannesson et al. found that opposing wall
By reliably tracking the endocardial border, VVI can compute ventricular volumes and ejection fraction using Simpsons rule. Regional function can be assessed by dividing each side of the trace into 3 segments of equal length and identifying regions with abnormal contractile
function (figure 10). Another potential application of VVI is in assessing rotational movement of the LV. Along with movements along the longitudinal and radial axis, during every
[image:35.612.191.423.305.548.2]contraction, the LV apex rotates in a counterclockwise direction, while the base rotates in a clockwise direction. The term LV torsion has been applied to this movement, which is technically difficult to measure using conventional echocardiography.
Figure 10. Global and regional EF by VVI
Using velocity vector display in short axis views at the apex and base, rotational movement can be visualized and quantified. Measurement of LV torsion is an area of active research using speckle tracking echocardiography81, 75 and VVI is likely to contribute to this in future.
Other potential areas for use of VVI include assessment of right ventricular function82, left
atrial mechanics, stress echocardiography and fetal echo79.
Other Methods to assess LV Function:
Though echocardiography is the most widely used, other modalities are available to measure LV function. A brief mention is made of these.
Cardiovascular magnetic resonance (CMR)
to quantify structural and functional abnormalities and to follow a patient over time. A specific advantage of CMR over echo is the ability to acquire images in any selected plane along the specific cardiac axes or any other, which makes it possible to thoroughly study cardiac morphology and function irrespective of patient build or habitus.
Assessment of LV function: Bright blood gradient echo sequences, obtained during a 15- to
20-second breath-hold, are used to cover the entire LV with short-axis views from the mitral plane and slice thickness not exceeding 10 mm. Regional myocardial function is best assessed using a unique MR technique called myocardial tagging. Special modulation of magnetization is obtained by applying a radiofrequency pre-pulse that labels the heart muscle with a dark grid and enables three-dimensional analysis of cardiac rotation, strain (in the subendocardial, midwall, and subepicardial layers), displacement, and deformation of different myocardial layers during the cardiac cycle . The tags can be applied immediately after the R-wave on the electrocardiogram to image systolic function or in late systole to image diastolic function83.
Viability: Contrast-enhanced MRI is rapidly evolving as a means of accurately predicting
myocardial viability. On first-pass perfusion images, an area of hypoenhancement within the infarcted region, correlating with microvascular obstruction is observed. A second
enhancement pattern is noticed at 10 to 30 min after contrast injection (delayed
hyperenhancement [DHE]). The DHE can be used to detect changes after acute and chronic myocardial infarction. An association between transmural extent of DHE detected by
magnetic resonance and functional recovery after revascularization has been shown. End diastolic wall thickness and systolic thickening can also be used as markers of viability84. This
can be evaluated using dobutamine stress MRI.
is not ideal, it shows future promise in becoming a non-invasive modality to view the coronary tree85.
Thus, CMR has been shown to have good accuracy in measuring LV volumes as well as in assessment of viability, but is constrained by availability of equipment and cost86.
Computed Tomography (CT):
Conventional CT lacks the spatial or temporal resolution for adequate imaging of the heart; however recent use of multidetector array CT (MDCT) scanners and ECG gating has improved the imaging capability of CT.
Wall motion abnormalities and areas of hypoperfusion can be assessed on the short-axis, four-chamber or two-chamber views, along with evaluation of the volumes and ejection fraction. This is done by performing a multi-phasic reconstruction at 5% intervals from the base to the apex of the heart, at 8mm intervals with 8mm thick slices. This yields 10 to 12 "sections", each of which contains images at 5% intervals to allow smooth cine viewing. Overcoming cardiac motion artifacts is a significant problem and often heart rate needs to be lowered by the use of beta blockers to achieve adequate resolution in imaging87. Studies
have shown fair correlation between LV volumes and function obtained by MDCT and MRI88
as well as conventional echo and nuclear gated SPECT89. Further, with the use of 64 slice
CT, high resolution non invasive imaging of the coronary arteries has become possible and
has already entered the clinical arena. It has been shown to have good sensitivity and
most studies, which allows one to exclude coronary artery disease with a high degree of confidence in the presence of a normal CT angiogram.
However, at present there is not much data regarding the ability of CT derived LV function to predict risk in clinical practice18. Also the imaging is hampered by the presence of high heart
rate, arrhythmia and extensive calcification. Radiation exposure from MDCT has also been an issue of concern and the technique requires use of iodinated contrast. Nevertheless,
combined assessment of coronary anatomy and LV function by MDCT is likely to become useful in the diagnostic armamentarium in evaluating coronary artery disease.
Nuclear Imaging:
Nuclear imaging techniques to measure ventricular function include first pass
ventriculography, equilibrium radionuclide ventriculogram (gated blood pool scanning), and gated single photon emission computed tomography (SPECT), during myocardial perfusion scanning with thallium-201 or Tc99m-sestamibi. These methods have been shown to have prognostic value after a myocardial infarction91 and add to risk stratification92
SPECT is a highly sensitive and moderately specific tool to detect coronary artery disease. Wall motion and systolic thickening can also be seen to assess regional myocardial status. LV volumes and EF measured by gated SPECT has been shown to correlate well with other techniques. EF can be calculated both at rest and post stress and the latter has incremental prognostic value over data provided by the perfusion study. Gated SPECT can detect wall motion and systolic thickening changes induced by inotropic stimulation; thus it can assess contractile reserve and myocardial viability.
attenuation artifacts and radiation exposure. Extensive perfusion defects could reduce the accuracy of LV volume and EF measurement. This has been a rapidly growing field with new breakthroughs in technology and could possibly become a “one- stop-shop” for assessing coronary artery disease by combining CAD detection, LV function assessment and viability93.
Relevance of the present study
From the preceding discussion, it is clear that a variety of methods are available to measure LV systolic function. Left ventricular geometry is complex and contraction in systole involves movement in more than one axis. The arrangement of myocardial fibers is not uniform across the wall of the LV; subendocardial and subepicardial muscle bundles are aligned
longitudinally, with a slight spiral arrangement, and midwall fibers are aligned
circumferentially. The latter group of fibers are responsible mainly for short axis or radial contraction of the left ventricle, whereas the former cause long-axis contraction (figure 11)29.
Figure 11. Normal LV myocardium showing longitudinal fibers running between the apex and the mitral ring and occupying the subendocardial and subepicardial layers
METHODOLOGY
The study was performed among outpatients from the cardiology department of Christian Medical College, Vellore; a tertiary care institute in South India. Subjects who presented to
the outpatient area for evaluation of suspected coronary artery disease were prospectively recruited.
Inclusion Criteria:
Patients presenting to the outpatient department of Cardiology for evaluation of chest pain were eligible to be included in the study.
Exclusion Criteria:
1. Inability to obtain a good quality echo image due to a poor window or other factors. 2. Unwillingness to participate in the study.
Baseline clinical data including risk factors, history of previous myocardial infarction, previous coronary angiography and current drug list was collected in all patients. Patients underwent a 12 lead electrocardiogram and chest X-ray.
Echocardiography:
Conventional 2D echocardiography in long axis, short axis and apical views were performed, and the ejection fraction calculated using Simpson’s rule. Patients were categorized as normal or having mild, moderate or severe LV dysfunction based on American Society of Echocardiography classification94. (Normal ≥55%, mild LV Dysfunction 45-54%, moderate LV
Dysfunction 30-44%, severe LVDysfunction < 30%). Regional wall motion abnormalities were subjectively assessed and regions of reduced contractility described as hypokinetic, akinetic or dyskinetic.
VVI Analysis:
traced manually in the apical 4 chamber view to provide the basic trace which the VVI algorithm then used to automatically track endocardial border movement. LV volume was calculated based on the volume of sixty-four disks whose diameters fit between opposing sides of the trace and are parallel to the plane defined by the trace endpoints (mitral plane). Regional volumes were computed by dividing each side of the trace into three segments of equal length and then dividing the disks into two portions using a line from the apex to the center of the base. This helps to identify regions with abnormal contractile function (refer Fig 9. of literature review).
Nuclear Imaging:
Each patient also underwent nuclear perfusion study by gated SPECT using technetium 99m-sestamibi from which presence and extent of regional ischemia was analyzed and ejection fraction was also calculated. In addition SPECT EF was calculated by another observer independently in 12 randomly selected patients to assess inter-observer variability.
Statistics:
Pearson’s correlation coefficient was used to analyze the correlation between ejection fraction calculated by VVI, SPECT and 2D echo. The numerical relationship between VVI EF and SPECT EF was calculated using regression equation to get an idea of the magnitude of difference in measurements by the two modalities. Paired t test was used to analyze
RESULTS
A total of 49 patients were studied. Table 1 shows the demographic characteristics of the patients studied.
The mean age of the subjects was 55.04 ± 8.78 years; they were predominantly male (87.8%). A little over 40% were diabetics and hypertensives and 40.8 % had suffered a previous ST elevation myocardial infarction (STEMI). Twenty of the subjects had undergone a coronary angiogram out of which 2 (4.1%) were normal, 4 (8.2%) had minor coronary artery disease; 2 (4.1%), 6 (12.2%) and 5 (10.2%) subjects each had single, double and triple vessel coronary artery disease respectively. SPECT showed evidence of ischemia in about 27% of patients and fixed (irreversible) defects in about 30% of patients.
Measurement of Ejection Fraction:
The mean ejection fraction (EF) calculated by VVI was 35 ± 12.08%, as compared to 54.2 ± 19.51% with SPECT and 50.3 ± 8.92% with 2D echo. The difference between the EF
[image:45.612.141.410.623.724.2]measured by different modalities was analyzed using the paired samples t-test. Table 2 shows the paired samples statistics comparing VVI EF with SPECT and 2D echo. As seen from the table, the mean EF measured by VVI was significantly less than that measured by the other modalities (p<0.001).
Table 1 Demographic Characteristics (numbers in brackets indicate percentages)
Dyspnea 22 (44.9) NYHA Class I
Class II Class III
13 (26.5) 33 (67.3) 3 (6.3) Previous STEMI 20 (40.8) Previous ACS (other than STEMI) 14 (28.6) Q waves on ECG 15 (30.6) RWMA by ECHO 17 (34.7) Ischemia on SPECT 13 (26.5) Aspirin 32 (65.3) Beta blocker 28 (57.1) Statin 35 (71.4) ACEI/ARB 25 (51.1) Nitrate 22 (44.9)
[image:46.612.142.414.53.273.2]ACS = Acute coronary syndrome, ACEI = Angiotensin converting enzyme inhibitor, ARB = Angiotensin receptor blocker.
Table 2. Paired T-Test
Comparison Pair Paired differences Mean Std. Devn . Std. error mean 95% confidence inerval of the difference
Lower Upper t df
Sig. (2 tailed) SPECT
EF-VVI EF 19.22 15.96 2.28 14.64 23.81 8.432 48 <0.001 2D EF- VVI
EF 16.26 10.05 1.53 13.16 19.35 10.612 42 <0.001
Table 3. Pearson’s Correlation Coefficient Statistics
Modality Mean Standard Deviation
Pearson’s correlation with VVI EF
Significance (2 tailed)
SPECT 54.22 19.51 0.577 0.01 2D 50.37 8.92 0.573 0.01 VVI 35.00 12.08 1.000
[image:47.612.49.506.84.172.2]-Assessment of LV Dysfunction:
Table 4 shows the relative proportion of patients with normal LV function, mild, moderate, or severe LV dysfunction as per the different modalities of measurement using American Society of Echocardiography criteria. For purposes of comparison, normal and mild LV dysfunction was clubbed as one group and moderate and severe LV dysfunction as another group. This is
clinically relevant as therapeutic decisions would likely be quite different in these 2 categories. The Fisher’s exact test was then used to look for a significant difference in the proportion of patients in each group; comparing VVI with SPECT and then VVI with 2D echo (Tables 5 &
Fig.1 Scatter plot showing the relation between VVI EF and SPECT EF
20 30 40 50
[image:47.612.68.389.353.616.2]6). There were significantly greater proportion of patients categorized as having moderate or severe LV dysfunction by VVI (75.5%) when compared to SPECT (34.7%; p= 0.026 vs. VVI) as well as 2D echo (32.7%; p=.0.037 vs. VVI). Figure 2 gives a graphic comparison of the proportion of patients with LV dysfunction using SPECT or VVI. As easily seen from the graphs, significantly more patients are clustered in the moderate and severe LV dysfunction groups by VVI.
Table 4. LV Dysfunction by 2D echo, SPECT and VVI (percentages in parentheses)
LV Function 2D echo SPECT VVI Normal 27 (55.1) 28 (57.1) 2 (4.1) Mild dysfunction 6 (12.2) 4 (8.2) 10 (20.4) Moderate
dysfunction
16 (32.7) 10 (20.4) 22 (44.9) Severe
[image:48.612.67.508.454.628.2]Dysfunction 0 (0) 7 (14.3) 15 (30.6)
Table 5. Statistical Comparison of categorized LV function: SPECT & VVI EF
11 21 32
7.8 24.2 32.0
1 16 17
4.2 12.8 17.0
12 37 49
12.0 37.0 49.0
Count Expected Count Count Expected Count Count Expected Count none or mild
moderate or severe 2 categories SPECT
LV Dysfunction
Total
none or mild
moderate or severe 2 categories VVI LV
Dysfunction
Chi-Square Tests
4.874 1 .027
3.455 1 .063
5.763 1 .016
.026
4.774 1 .029
[image:49.612.65.396.64.189.2]Pearson Chi-Square Continuity Correction Likelihood Ratio Fisher's Exact Test Linear-by-Linear Association Value df Asymp. Sig. (2-sided) Exact Sig. (2-sided)
Table 6.Statistical Comparison of categorized LV function: 2D & VVI EF
11 22 33
8.1 24.9 33.0
1 15 16
3.9 12.1 16.0
12 37 49
12.0 37.0 49.0 Count Expected Count Count Expected Count Count Expected Count none or mild
moderate or severe 2D LV Dysfunction
2 categories
Total
none or mild
moderate or severe 2 categories VVI LV
Dysfunction
Total
Chi-Square Tests
4.274 1 .039
2.935 1 .087
5.061 1 .024
.037
4.187 1 .041
49 Pearson Chi-Square
Continuity Correction Likelihood Ratio Fisher's Exact Test Linear-by-Linear Association N of Valid Cases
Value df Asymp. Sig. (2-sided) Exact Sig. (2-sided)
Analysis of Regional Function:
While regional wall motion abnormality (RWMA) was assessed subjectively by 2D echo, regional EF was calculated using VVI as described earlier by dividing the trace into 3
LVD by SPECT
severe moderate mild normal P er ce n t 70 60 50 40 30 20 10 0
LVD by VVI
segments of equal length on each side. These segments labeled 1 to 6 correspond to basal inferoseptum, mid inferoseptum, apical septum, apical lateral, mid anterolateral and basal anterolateral respectively. The standard for segmental EF is different from that of global EF and segmental EF ≥ 35% has been considered normal95. Table 7 shows the distribution of
RWMA by 2D echo. About 40% of patients had RWMA in various regions by 2D echo; predominantly, this was in the anterior/septum/apical region. By VVI however, 34 of 49 patients (69.3%) had reduced segmental EF in one or more regions using a cut-off of 35%. The frequency of reduced EF (regional dysfunction) in each region is shown in Table 8.
Table 7. RWMA by 2D Echo (percentages in brackets)
RWMA Frequency
None 30 (61.2) Anterior/septum/ apex 15 (30.6) Inferior/Posterior/lateral 2 (4.1)
[image:51.612.157.451.488.719.2]Global hypokinesia 2 (4.1)
Table 8. Regional Dysfunction by VVI (percentages in brackets)
Region Dysfunction
Region 1- Basal inferoseptum
28 (57.1)
Region 2- Mid inferospetum
20 (40.8)
Region 3- Apical septum 22 (44.9) Region 4- Apical lateral 20 (40.8)
Region 5- Mid anterolateral
Region 6- Basal anterolateral
19 (38.8)
Inter-Observer Correlation for measurement of EF by gated SPECT:
The reliability of ejection fraction measured by gated SPECT in this study was tested by looking at the inter-observer variation in the calculation of EF from the SPECT images in 12 randomly selected patients by two independent nuclear physicians. Excellent agreement was seen for measured EF by SPECT (Pearsons correlation coefficient 0.992, p=0.01) between 2 observers, reflecting good reliability of measurement.
Correction Factor for VVI EF:
DISCUSSION
In this study we have evaluated the new echocardiographic modality of velocity vector
imaging in the assessment of LV systolic function by ejection fraction. Though VVI employs a complex multi-step algorithm, it is practically easy to use and involves only obtaining a good quality image and tracing the endocardial border of the region of interest. The advantage is that the border is then automatically tracked through successive cycles and hence cardiac motion may be delineated with greater accuracy. Measurement of global and regional EF by VVI was found to be simple and feasible enough to be used in routine clinical practice.
There was a positive linear correlation between the EF measured by VVI and the other
modalities viz SPECT and 2D echo. This means that as the value of EF measured by SPECT or 2D echo increases, so does that measured by VVI in a proportionate fashion, and vice versa for a fall in the EF. This positive relationship is important as it shows that in a given population, relative differences would be reflected well by the new modality even if absolute values are not the same. Thus, in the serial follow up of a patient for example, an
improvement or worsening in the EF reflected by gated SPECT or 2D echo would probably be seen on measurement by VVI as well. In other words, the directional trend of EF is the same by all three modalities tested.
systematically underestimates the ejection fraction as compared to gated SPECT or 2D echo.
In addition to showing that this difference is significant in absolute terms, we also analyzed whether it affects classification into different categories of LV dysfunction as this is more likely to directly affect therapy and clinical decision-making. Hence we classified patients by EF into normal, mild, moderate or severe LV dysfunction based on standard American Society of Echocardiography criteria. A significantly greater proportion of patients were classified as having moderate or severe LV dysfunction by VVI EF as compared to SPECT. Thus, the underestimation of EF by VVI is clinically significant.
Analysis of regional function also showed a difference between 2D echo and VVI. While about 40% of the patients had RWMA on assessment by 2D echo, close to 70% of patients had regional dysfunction as evidenced by reduced regional EF in at least one of the six segments studied by VVI. However, an allowance has to be made for the fact that visual estimation by 2D echo is subjective and may not have been accurate enough to pick out milder degrees of hypocontractility which a numerical measure like regional EF would pick up.
As SPECT was used as the gold standard for comparison in this study, reliability of measurement was checked by looking for any variation in measurement between 2
independent observers in 12 randomly selected patients. The inter observer correlation was excellent, showing that measurement error was not likely to be a significant issue in
calculating EF from gated SPECT. As mentioned previously, assessment of LV function by gated SPECT is a well accepted modality which has been validated against other techniques of LV function measurement93. Hence its use in this study as the standard is justified and
Finally, we looked at the numerical relationship between the calculated VVI EF and SPECT EF and found by regression equation that the VVI EF was numerically about 20 less than the SPECT EF. In other words, the “correct” (SPECT) EF can be known by adding 20 to the VVI EF. This can be incorporated as a correction factor in the VVI algorithm to improve its
accuracy. This will need to be prospectively validated.
It is difficult to speculate as to why there was a significant error in the EF measured by VVI. The software is automated and the role of the echocardiographer is limited to only tracing the endocardial border, making operator related error unlikely. To the best of our knowledge, this is the first study to attempt to validate EF measured by VVI against an existing standard. Studies assessing VVI in the clinical setting are sparse at present. Chen et al studied the use of VVI in a small number of post myocardial infarction patients by measuring strain, strain rate and segmental EF. They found that these parameters were significantly lower in infarct
segments than in the corresponding segments of the normal controls. There was good correlation between the strain measured by VVI and that measured by tissue Doppler. Inter and intraobserver variability in the VVI measurements was 4.6% and 7% respectively. They concluded that VVI could be a useful tool in measuring regional myocardial systolic function95.
Vannan et al., in a case report have described the measurement of strain using VVI in a patient undergoing CRT. They showed that although longitudinal and radial velocities of the LV were synchronized after CRT, VVI showed a persistent heterogeneity of circumferential strain8. Thus, VVI could possibly be a better tool for assessing the outcome of CRT by better
measuring the circumferential and radial dynamics of the LV, which are components of the torsional deformation of the LV described earlier.
to be “fine tuned” as data from more clinical studies become available. There is no doubt that VVI is a conceptually sound technology with good future potential and further trials will help delineate any possible sources of error which can then be addressed.
In conclusion, measurement of ejection fraction by VVI is simple and feasible for use in clinical practice. This study showed a positive linear correlation between EF measured by VVI, gated SPECT and 2D echo. However, VVI significantly underestimated EF in
LIMITATIONS
1. The number of patients studied was limited and hence the findings need to be confirmed in a larger population.
2. The patients studied are a heterogeneous population in terms of LV function and whether any variations exist in the measurement of EF by VVI in different subsets of patients cannot be adequately commented upon due to the limited numbers studied. However, in the current study, the relationship between VVI and SPECT EF appeared to be uniform irrespective of underlying pathology and extent of LV dysfunction.
SUMMARY OF MAIN FINDINGS
1. VVI is an easy to use technology from which global and regional EF can be calculated. 2. The mean ejection fraction (EF) calculated by VVI was 35 ± 12.08%, as compared to 54.2 ± 19.51% by SPECT (p<0.001 vs. VVI) and 50.3 ± 8.92% with 2D echo (p<0.001 vs. VVI). The mean EF measured by VVI was significantly less than that measured by the other modalities.
3. There was a positive linear correlation between the VVI EF and SPECT EF (correlation coefficient 0.577; p=0.01) as well as 2D EF (correlation coefficient 0.573; p=0.01).
4. Significantly greater proportion of patients were categorized as having moderate or severe LV dysfunction by VVI (75.5%) when compared to SPECT (34.7%) or 2D echo (32.7%). 5. There was excellent inter-observer correlation for EF measured by SPECT.
BIBLIOGRAPHY
1. Wang TJ, Evans JC, Benjamin EJ, et al. Natural history of asymptomatic left ventricular systolic dysfunction in the community. Circulation 2003; 108:977–82
2. Rihal CS, Davis KB, Kennedy JW, et al. The utility of clinical, electrocardiographic, and roentgenographic variables in the prediction of left ventricular function. Am J Cardiol 1995;75:220–3.
3. Curtis JP, Sokol SI, Wang Y, et al: The association of left ventricular ejection fraction, mortality, and cause of death in stable outpatients with heart failure. J Am Coll Cardiol 2003; 42:736–42
4. Dittoe N; Stultz D; Schwartz BP et al. Quantitative left ventricular systolic function: From chamber to myocardium. Crit Care Med 2007; 35[Suppl.]:S330–9.
5. Hundley W, Kizilbash A, Afridi I, et al: Administration of an intravenous perfluorocarbon contrast agent improves echocardiographic determination of left ventricular volumes and ejection fraction: Comparison with cine MRI. J Am Coll Cardiol 1998; 32: 1426–32
6. Hunt SA, Abraham WT, Chin MH, et al. ACC/AHA 2005 guideline update for the diagnosis and management of chronic heart failure in the adult: a report of the American College of Cardiology/American Heart Association Task Force on Practice Guidelines (Writing Committee to Update the 2001 Guidelines for the Evaluation and Management of Heart Failure). Circulation. 2005; 112 (12):e154-235.
7. Bohs LN, Trahey GE: A novel method for angle independent ultrasonic imaging of blood flow and tissue motion. IEEE Trans Biomed Eng.1991; 38:280-6.