White Rose Research Online URL for this paper:
http://eprints.whiterose.ac.uk/1026/
Article:
Westwood, M E, Whiting, P F and Kleijnen, J (2005) How does study quality affect the
results of a diagnostic meta-analysis? BMC Medical Research Methodology. p. 20. ISSN
1471-2288
https://doi.org/10.1186/1471-2288-5-20
[email protected] https://eprints.whiterose.ac.uk/ Reuse
Items deposited in White Rose Research Online are protected by copyright, with all rights reserved unless indicated otherwise. They may be downloaded and/or printed for private study, or other acts as permitted by national copyright laws. The publisher or other rights holders may allow further reproduction and re-use of the full text version. This is indicated by the licence information on the White Rose Research Online record for the item.
Takedown
If you consider content in White Rose Research Online to be in breach of UK law, please notify us by
Methodology
Open Access
Research article
How does study quality affect the results of a diagnostic
meta-analysis?
Marie E Westwood*, Penny F Whiting and Jos Kleijnen
Address: Centre for Reviews and Dissemination, University of York, UK
Email: Marie E Westwood* - [email protected]; Penny F Whiting - [email protected]; Jos Kleijnen - [email protected] * Corresponding author
Abstract
Background: The use of systematic literature review to inform evidence based practice in diagnostics is rapidly expanding. Although the primary diagnostic literature is extensive, studies are often of low methodological quality or poorly reported. There has been no rigorously evaluated, evidence based tool to assess the methodological quality of diagnostic studies.
The primary objective of this study was to determine the extent to which variations in the quality of primary studies impact the results of a diagnostic meta-analysis and whether this differs with diagnostic test type. A secondary objective was to contribute to the evaluation of QUADAS, an evidence-based tool for the assessment of quality in diagnostic accuracy studies.
Methods: This study was conducted as part of large systematic review of tests used in the diagnosis and further investigation of urinary tract infection (UTI) in children. All studies included in this review were assessed using QUADAS, an evidence-based tool for the assessment of quality in systematic reviews of diagnostic accuracy studies. The impact of individual components of QUADAS on a summary measure of diagnostic accuracy was investigated using regression analysis. The review divided the diagnosis and further investigation of UTI into the following three clinical stages: diagnosis of UTI, localisation of infection, and further investigation of the UTI. Each stage used different types of diagnostic test, which were considered to involve different quality concerns.
Results: Many of the studies included in our review were poorly reported. The proportion of QUADAS items fulfilled was similar for studies in different sections of the review. However, as might be expected, the individual items fulfilled differed between the three clinical stages. Regression analysis found that different items showed a strong association with test performance for the different tests evaluated. These differences were observed both within and between the three clinical stages assessed by the review. The results of regression analyses were also affected by whether or not a weighting (by sample size) was applied. Our analysis was severely limited by the completeness of reporting and the differences between the index tests evaluated and the reference standards used to confirm diagnoses in the primary studies. Few tests were evaluated by sufficient studies to allow meaningful use of meta-analytic pooling and investigation of heterogeneity. This meant that further analysis to investigate heterogeneity could only be undertaken using a subset of studies, and that the findings are open to various interpretations.
Conclusion: Further work is needed to investigate the influence of methodological quality on the results of diagnostic meta-analyses. Large data sets of well-reported primary studies are needed to address this question. Without significant improvements in the completeness of reporting of primary studies, progress in this area will be limited.
Published: 08 June 2005
BMC Medical Research Methodology 2005, 5:20 doi:10.1186/1471-2288-5-20
Received: 09 September 2004 Accepted: 08 June 2005
This article is available from: http://www.biomedcentral.com/1471-2288/5/20
© 2005 Westwood et al; licensee BioMed Central Ltd.
Background
The use of systematic literature review to inform evidence-based practice in diagnostics is rapidly expanding. Although the primary diagnostic literature is extensive, there remain a number of problems for systematic reviews of diagnostic tests. Appropriate methods for rigorous eval-uation of diagnostic technologies have been well estab-lished [1-5]. However, available studies have generally been poorly designed and reported [6-8]. Similarly, although a number of quality checklists for diagnostic accuracy studies have been proposed [9] and there is growing evidence on the effects of bias in such studies [10], there has been no rigorously evaluated, evidence-based quality assessment tool for diagnostic studies.
The objective of this study was to investigate the impact of quality on the results of a diagnostic meta-analysis, using regression analysis. A large diagnostic systematic review was required to enable the use of regression analysis to investigate the impact of components of quality upon results.
We have recently completed a systematic review, which aimed to determine the most appropriate pathway for the diagnosis and further investigation of UTI in children [11]. It included an assessment of the accuracy of tests for three different clinical stages of UTI: the diagnosis UTI, localisation of infection, and further investigation of patients with confirmed UTI. The nature of the tests included in these three clinical sections of this review dif-fered. Tests used to diagnose UTI were generally
labora-tory-based or near-patient methods, with relatively objective interpretation of results, e.g. dipstick tests and microscopy. By contrast, tests used to investigate con-firmed UTI mainly utilised imaging technologies which are largely subjective in their interpretation, and where diagnostic thresholds are difficult to define. Tests used to localise infection spanned both categories. We hypothe-sised that the components of methodological quality affecting results were likely to differ between the three sec-tions of the review. Such potential differences may indi-cate a need for topic-specific checklists for the assessment of quality in diagnostic studies.
A secondary aim of this study was to contribute to the evaluation of QUADAS, an evidence-based tool for the assessment of the quality of diagnostic accuracy studies that was specifically developed for use in systematic reviews of diagnostic tests [12], by investigating the importance of specific QUADAS items.
Methods
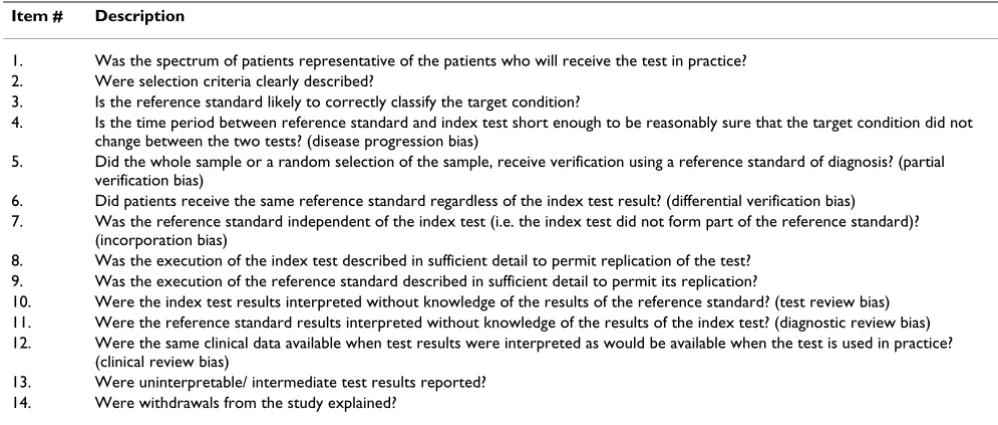
[image:3.612.53.552.478.690.2]We used QUADAS [12] (Table 1) to assess the quality of primary studies included in the review. Items were rated as 'yes', 'no', or 'unclear'. We examined differences in the individual QUADAS items fulfilled, as well as their impact on test performance. The review divided the diagnosis and further investigation of UTI into the following three clini-cal stages: diagnosis of UTI, loclini-calisation of infection, and further investigation of the UTI. Each stage used different types of diagnostic test, which were considered to involve different quality concerns.
Table 1: QUADAS
Item # Description
1. Was the spectrum of patients representative of the patients who will receive the test in practice? 2. Were selection criteria clearly described?
3. Is the reference standard likely to correctly classify the target condition?
4. Is the time period between reference standard and index test short enough to be reasonably sure that the target condition did not change between the two tests? (disease progression bias)
5. Did the whole sample or a random selection of the sample, receive verification using a reference standard of diagnosis? (partial verification bias)
6. Did patients receive the same reference standard regardless of the index test result? (differential verification bias)
7. Was the reference standard independent of the index test (i.e. the index test did not form part of the reference standard)? (incorporation bias)
8. Was the execution of the index test described in sufficient detail to permit replication of the test? 9. Was the execution of the reference standard described in sufficient detail to permit its replication?
10. Were the index test results interpreted without knowledge of the results of the reference standard? (test review bias) 11. Were the reference standard results interpreted without knowledge of the results of the index test? (diagnostic review bias) 12. Were the same clinical data available when test results were interpreted as would be available when the test is used in practice?
(clinical review bias)
We analysed results grouped by clinical stage. Within these groups, we pooled studies of similar tests or test combinations where sufficient data were available and where pooling was clinically meaningful. (Table 2) The minimum number of studies that we required for regres-sion analysis was ten. This choice was made based on pub-lished guidance [13,14].
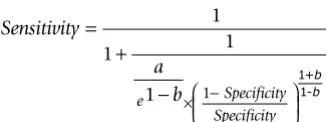
We estimated summary receiver operator characteristic (SROC) curves using the following equation [15]:
a and b were estimated by regressing D against S for each study:
D = a + bS
D = {logit (sensitivity) - logit (1-specificity)} = log diag-nostic odds ratio (DOR)
S = {logit (sensitivity) + logit (1-specificity)}
We used both weighted and unweighted models. For the weighted model we weighted on sample size. We chose to weight on sample size rather than inverse variance, a method sometimes used in this type of analysis, as we believe that weighting on the inverse variance can produce biased results. The reason for this bias is that the DOR is associated with its variance and so large DORs will inevi-tably have large variances, which will be reflected in the weightings.
We assessed between study heterogeneity through visual examination of forest plots and statistically using the Q statistic [16]. Where sufficient data were available, we used regression analysis to investigate whether individual QUADAS items and additional variables thought likely to be associated with diagnostic accuracy were associated with the DOR and hence whether differences in these items between the studies accounted for some of the observed heterogeneity. Where data were available, the following additional variables were investigated:
[image:4.612.56.219.556.617.2]• Patient age (<2 years, <5 years, <12 years and <18 years) was included to examine possible variation with age within the paediatric population.
Table 2: Tests included/excluded in the regression analysis
Tests included in the regression analysis (number of studies) Tests for which there were insufficient studies to permit regression analysis (number of studies)
Diagnosis
Dipstick: nitrite (23), LE (14), nitrite or LE positive (15) Clinical history (6)
Microscopy: pyuria (28), bacteriuria (22) Dipstick: nitrite and LE positive (9), glucose (4), protein (2), blood (1), protein and LE positive (1), combinations of 3 dipstick tests (5)
Microscopy: pyuria or bacteriuria (8), pyuria and bacteriuria (8)
Culture: standard (1), dipslide (1)
Combinations of different tests (10)
Localisation
Ultrasound (20) Clinical history (5)
Laboratory based tests (16)
Imaging techniques: MCUG (7), MRI (1), CT (1), IVP (4), cystography (2), scintigraphy (3)
Further investigation
Detection of reflux: Ultrasound (28): standard (11), contrast enhanced (17)
Detection of reflux: IVP (4), voiding radionuclide cystography (3), NAG/ creatinine ratio (1), scintigraphy, (3), risk scoring system (1)
Prediction of scarring: ultrasound (2), IVP (1), non-invasive indicators (1), MCUG (2)
Detection of scarring: IVP (4), static scintigraphy (7), dynamic scintigraphy (2), MCUG (4), cystography (1), MRI (1), US and MCUG (1)
Sensitivity
a b
e Specificity Specificity =
+
− × −
1
1 1
1 1
• The geographic region where studies were conducted was included to account for possible regional differences in test technology and infective agent.
• Specific variations in index test technique were also included. For microscopy for pyuria and bacteriuria a var-iable on whether the sample was centrifuged was included, and for microscopy for bacteriuria a variable for Gram stain was included. For ultrasound for the detection of reflux a variable for whether or not the ultrasound involved a contrast agent was included.
• The SROC model [15], was extended to include each of the 14 QUADAS items and each of the variables above as individual covariates [17]. As each QUADAS item can be scored as "yes", "no" or "unclear", we included QUADAS items as categorical variables with 3 possible outcomes, thus including the comparisons of "yes vs no", and "yes vs unclear". This allowed us to make some distinction between associations of aspects of methodological quality with test performance and associations of completeness of reporting with test performance. A number of QUADAS items only received two of the three possible scores (i.e. were scored either "yes" or "no", or "yes" or "unclear", or "no" or "unclear"). These items were therefore included as dichotomous variables.
A multivariate linear regression analysis was conducted. Initially, we performed univariate analysis with all items included separately in the model. Items that showed mod-erate evidence of an association with D, defined as p < 0.10, were investigated further using step-down regression analysis. All items found to show moderate evidence of an association in the univariate models were entered into the multivariate model, then dropped in a step-wise fashion with the item with the weakest evidence of an association (largest p-value) dropped first. For covariates with more than one level, evidence of an association of one indicator variable with test performance was considered sufficient for inclusion in the model. The final model was achieved when all items remaining showed strong evidence of an association with D, defined as p < 0.05. Interaction terms were not included. Associations of covariates with D were expressed as relative diagnostic odds ratios (RDOR). The DOR is used as an overall measure of diagnostic accuracy. It is calculated as the odds of positivity among diseased persons, divided by the odds of positivity among non-dis-eased. When a test provides no diagnostic evidence then the DOR is 1.0. The RDOR is calculated as the DOR when the covariate is present divided by the DOR when the cov-ariate is absent. It therefore provides an indicator of the overall impact on diagnostic accuracy of the presence of a given covariate.
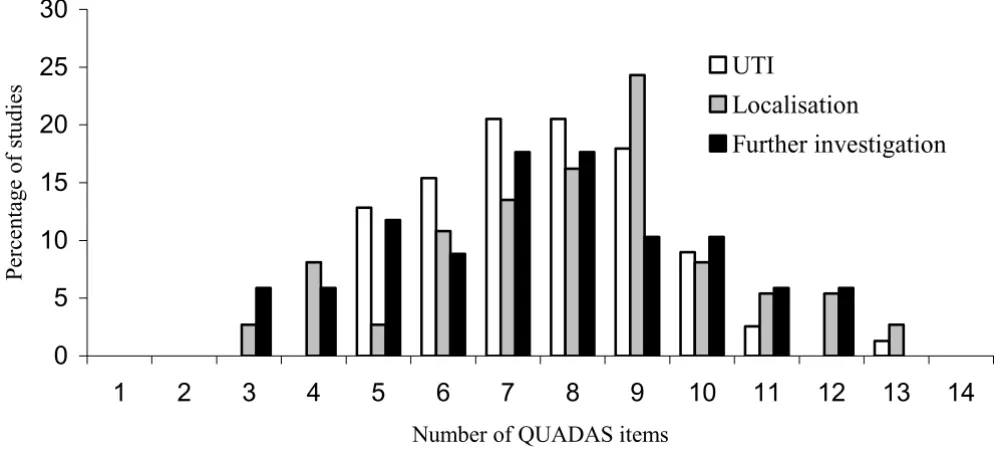
[image:5.612.55.557.415.641.2]Numbers of quality items fulfilled by studies in the three sections of the review
Figure 1
Numbers of quality items fulfilled by studies in the three sections of the review.
0
5
10
15
20
25
30
1
2
3
4
5
6
7
8
9
10
11
12
13
14
Number of QUADAS items
Percentage of studies
UTI
Localisation
Results
Results of QUADAS assessment
[image:6.612.60.554.93.336.2]The proportion of QUADAS items fulfilled by studies included in our systematic review was similar for each of the three clinical stages assessed in the review. Studies evaluating tests to diagnose UTI fulfilled a median of 8 (range 5–13) items, those evaluating tests used to localise infection also fulfilled a median of 8 (range 3–13) items, and those evaluating further investigations fulfilled a median of 7.5 (range 3–12) items. Figure 1 illustrates the number of QUADAS items fulfilled by studies in each cat-egory. The similarity in numbers of QUADAS items fulfilled masks apparent differences in the individual items fulfilled.
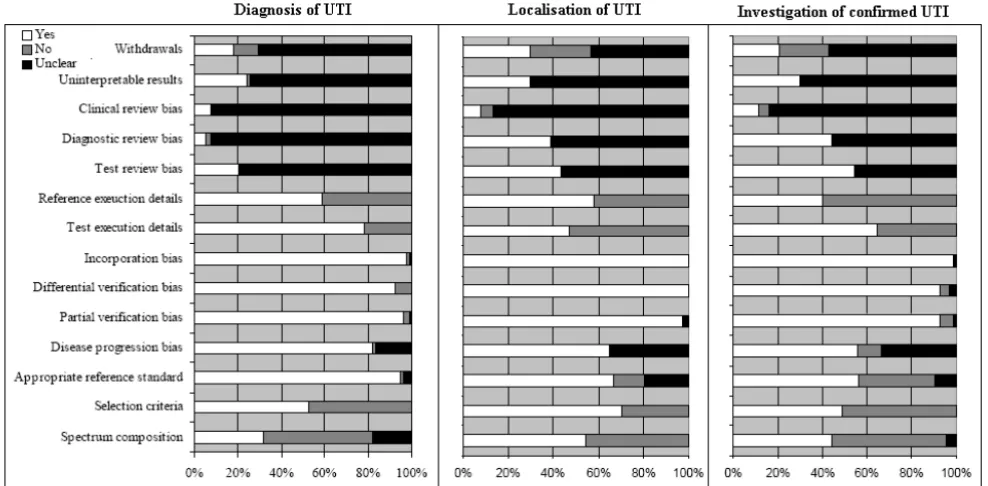
Figure 2 shows the proportion of studies that scored "yes", "no" and "unclear" for each of the QUADAS items, sepa-rately for the three sections of the review.
Tests for the diagnosis of UTI (n = 79 studies) [18-96]
The use of an inappropriate spectrum of patients and inadequate reporting of inclusion criteria were problem-atic for studies in this category. The majority of studies provided insufficient details on how the reference stand-ard was performed. Studies failed to report sufficient
details on clinical review bias, diagnostic review bias and test review bias to judge whether these were avoided. Study withdrawals and handling of uninterpretable results were also poorly reported.
Tests for the localisation of infection (n = 39 studies) [48,69,97-133]
The time delay between the index test and reference stand-ard was more of a problem with these studies than with those on the diagnosis of UTI. The use of an appropriate reference standard was also an issue in some of these stud-ies. Spectrum composition and reporting of details of how children were selected for inclusion in the study was better in these studies than in the studies of the diagnosis of UTI. Only around half of studies provided sufficient details of how the index test and reference standard were performed to allow replication of these tests. More studies in this cat-egory, almost 40%, provided information indicating that test and diagnostic review bias had been avoided, in the remainder of studies this information was not reported. As with studies of the diagnosis of UTI, reporting of clini-cal review bias, handling of uninterpretable results, and withdrawals from the study was poor.
Proportion of studies rated as yes, no or unclear for each of the QUADAS items, separately for diagnosis of UTI, localisation of infection and investigation of confirmed UTI
Figure 2
Tests for the further investigation of confirmed UTI (n = 71 studies) [134-204]
As with studies of the diagnosis of UTI, spectrum compo-sition and reporting of inclusion criteria were poor in this group. The time delay between the index test and refer-ence standard was also an issue in many of these studies. Around half of studies reported that diagnostic and test review bias had been avoided, the remaining studies did not report whether the index test and reference standard were interpreted blind to the results of each other. This was similar to the situation seen for studies on the locali-sation of infection. Reporting of the reference standard was poor. As in all previous groups, studies also provided very little information on whether appropriate clinical information was available when test results were interpreted, how uninterpretable results were handled, and whether there were any withdrawals from the study and if so whether all withdrawals were accounted for.
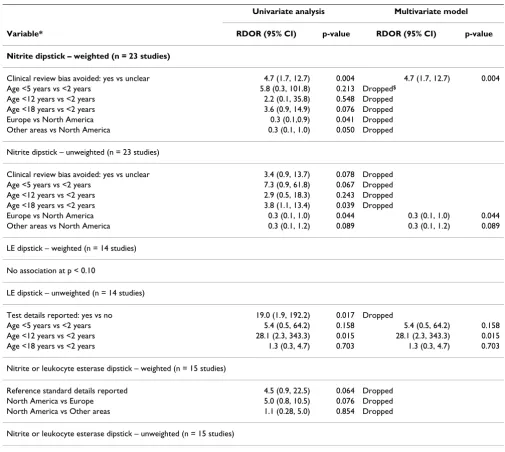
Results of multivariate regression analysis
Tests for the diagnosis of UTI
Tests involving dipstick or microscopy techniques were the only categories where enough studies were available to enable regression analysis. Table 3 summarises the results of the regression analysis for studies assessing dip-stick tests. For dipdip-stick to detect urinary nitrite (23 stud-ies) [20,26,28,34,36,40,41,43,52,54-57,60,63,66,72,74,84,88,93-95], the weighted analysis found that studies reporting that clinical review bias had been avoided had a DOR 4.7 (95% CI: 1.7, 12.7) times greater than those which did not report on whether clini-cal information was available to those interpreting the test results (p = 0.004). This is what would be expected, as the DOR is likely to be higher when those interpreting test results have access to appropriate clinical information similar to that, which would be available in practice. No studies reported the presence of clinical review bias. This was the only item investigated to show strong evidence of an association with test performance in the weighted mul-tivariate analysis, although age and geographic region did show moderate evidence of an association in the univari-ate analysis. The unweighted analysis showed slightly dif-ferent results. The same three items were found to show at least moderate evidence of an association in the univariate analysis. However, only country remained in the multi-variate model, suggesting that studies conducted in North America showed higher accuracy than studies conducted in Europe or other areas (p < 0.05).
For dipsticks measuring urinary leukocyte esterase (14 studies) [20,28,34,36,43,56,57,60,63,66,72,84,94,95] and for dipsticks for the presence of either nitrite or leuko-cyte esterase (15 studies) [19-21,28,34,56,60,63,66,84-86,92,94-96], no items showed strong evidence of an association with the DOR in the weighted analysis.
How-ever, for urinary leukocyte esterase, the unweighted anal-ysis found strong evidence of an association between patient age and the DOR. There was strong evidence (p = 0.015) that the dipstick was more accurate in children aged <12 years than in those aged <2 years (RDOR = 28.1, 95% CI: 2.3, 343.3). There was no evidence of any differ-ence in accuracy between children aged <18 years and those aged <2 years (p = 0.703), and very little evidence of any difference between children aged <5 years and those aged <2 years (p = 0.158).
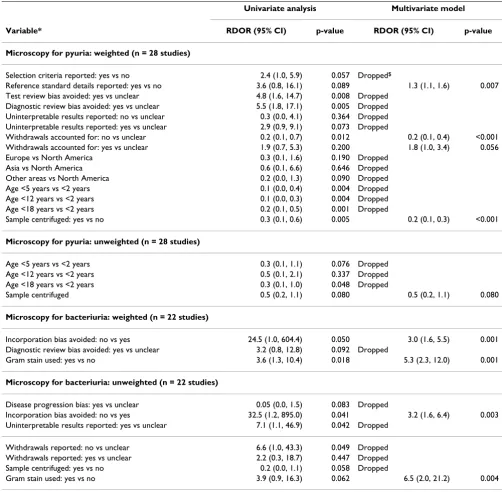
Table 4 summarises the results of the regression analysis for studies that assessed the accuracy of microscopy. In studies evaluating microscopy to detect pyuria three items showed a strong association with test performance in the weighted analysis (28 studies) [19-23,28,29,34,35,41,43,46,47,49,50,58,59,63,67,70,75,77, 80,81,83,85,92-94]. The DOR was 1.3 (95% CI: 1.1, 1.6; p = 0.007) times higher in studies that adequately reported details of the reference standard execution. The DOR was lower, RDOR = 0.2 (95% CI: 0.1, 0.4; p < 0.001) in studies that did not report on reasons for withdrawals compared to studies in which it was unclear whether there were any withdrawals, and 1.8 times higher (95 % CI: 1.0, 3.4; p = 0.056) in studies in which withdrawals were accounted for compared to those in which this was unclear. The DOR was lower, RDOR = 0.2 (95% CI: 0.1, 0.3; p < 0.001), in studies where samples were centrifuged compared to studies in which samples were not centri-fuged. In the unweighted analysis, only centrifugation showed any evidence of an association with test perform-ance (p = 0.08). All of these items, with the exception of centrifugation, relate to the completeness of reporting. The association for centrifugation is counter-intuitive, as we would expect centrifugation of the sample to lead to improved test accuracy.
Two items showed a strong evidence of an association with the DOR in the weighted analysis of studies evaluat-ing microscopy to detect bacteriuria (22 studies)
[20,21,23,28,34,35,41,47,50,61-64,67,70,76,77,80,85,90,91,94]. The DOR was 3.0 (95% CI: 1.6, 5.5, p = 001) times greater in studies in which incorporation bias was present compared to those in which it was avoided, and 5.3 (95% CI: 2.3, 12.0, p = 0.001) times greater if samples were Gram stained. We would expect both Gram staining and the presence of incorporation bias to increase test performance as found in the analysis. The unweighted analysis found very simi-lar results.
Tests for the localisation of infection
[48,69,97,99-102,109-111,113-115,117,118,121,126,128,132,133]. None of the QUADAS items, or other items investigated, showed moderate evidence of an association with the DOR in this analysis, using either the weighted or unweighted model.
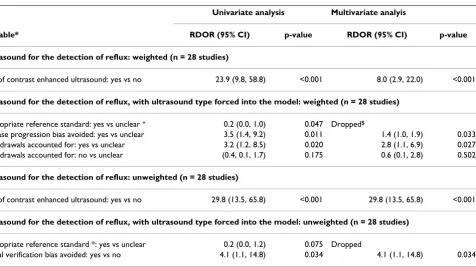
Tests for the further investigation of confirmed UTI
Table 5 summarises the results of the regression analysis for studies assessing this clinical stage. The use of ultra-sound to detect reflux was the only test in this category with sufficient data to support regression analysis (28
studies)
[image:8.612.52.557.97.549.2][69,135,137,140,141,150,152,153,155,164,169,170,172 ,176-178,181,185,187,189,190,195-198,202-204]. Three items showed strong evidence of an association with the DOR in the weighted analysis. The DOR was 8.0 (95% CI: 2.9, 22.0; p < 0.001) times greater in studies that used con-trast enhanced ultrasound compared to those that used standard ultrasound. As this was also thought to be a clin-ically important variable it was included in all further analyses. The DOR was 1.4 (95% CI: 1.0, 1.9; p = 0.033) Table 3: Results of the regression analysis for dipstick tests for the diagnosis of UTI
Univariate analysis Multivariate model
Variable* RDOR (95% CI) p-value RDOR (95% CI) p-value
Nitrite dipstick – weighted (n = 23 studies)
Clinical review bias avoided: yes vs unclear 4.7 (1.7, 12.7) 0.004 4.7 (1.7, 12.7) 0.004 Age <5 years vs <2 years 5.8 (0.3, 101.8) 0.213 Dropped$
Age <12 years vs <2 years 2.2 (0.1, 35.8) 0.548 Dropped Age <18 years vs <2 years 3.6 (0.9, 14.9) 0.076 Dropped Europe vs North America 0.3 (0.1,0.9) 0.041 Dropped Other areas vs North America 0.3 (0.1, 1.0) 0.050 Dropped
Nitrite dipstick – unweighted (n = 23 studies)
Clinical review bias avoided: yes vs unclear 3.4 (0.9, 13.7) 0.078 Dropped Age <5 years vs <2 years 7.3 (0.9, 61.8) 0.067 Dropped Age <12 years vs <2 years 2.9 (0.5, 18.3) 0.243 Dropped Age <18 years vs <2 years 3.8 (1.1, 13.4) 0.039 Dropped
Europe vs North America 0.3 (0.1, 1.0) 0.044 0.3 (0.1, 1.0) 0.044 Other areas vs North America 0.3 (0.1, 1.2) 0.089 0.3 (0.1, 1.2) 0.089
LE dipstick – weighted (n = 14 studies)
No association at p < 0.10
LE dipstick – unweighted (n = 14 studies)
Test details reported: yes vs no 19.0 (1.9, 192.2) 0.017 Dropped
Age <5 years vs <2 years 5.4 (0.5, 64.2) 0.158 5.4 (0.5, 64.2) 0.158 Age <12 years vs <2 years 28.1 (2.3, 343.3) 0.015 28.1 (2.3, 343.3) 0.015 Age <18 years vs <2 years 1.3 (0.3, 4.7) 0.703 1.3 (0.3, 4.7) 0.703
Nitrite or leukocyte esterase dipstick – weighted (n = 15 studies)
Reference standard details reported 4.5 (0.9, 22.5) 0.064 Dropped North America vs Europe 5.0 (0.8, 10.5) 0.076 Dropped North America vs Other areas 1.1 (0.28, 5.0) 0.854 Dropped
Nitrite or leukocyte esterase dipstick – unweighted (n = 15 studies)
No association at p < 0.10
*Only items that showed moderate evidence (p < 0.10) for an association with the DOR in the univariate analysis are included.
times higher in studies that reported that disease progres-sion bias had been avoided compared to those in which this information was not reported. No studies reported sufficient information to determine that disease progres-sion bias was present. Studies in which details were pro-vided on reasons for withdrawals had DORs that were 2.8 times higher (95% CI: 1.1, 6.9, p = 0.033) than those in
[image:9.612.53.555.100.592.2]which it was unclear whether there had been any with-drawals. There was no evidence of any difference in the DOR between studies that did not report on reasons for withdrawals and studies in which it was unclear whether there were any withdrawals (p = 0.502). In the unweighted analysis, only two items showed a strong evi-dence of an association with the DOR. As in the weighted Table 4: Results of the regression analysis for microscopy for the diagnosis of UTI
Univariate analysis Multivariate model
Variable* RDOR (95% CI) p-value RDOR (95% CI) p-value
Microscopy for pyuria: weighted (n = 28 studies)
Selection criteria reported: yes vs no 2.4 (1.0, 5.9) 0.057 Dropped$
Reference standard details reported: yes vs no 3.6 (0.8, 16.1) 0.089 1.3 (1.1, 1.6) 0.007 Test review bias avoided: yes vs unclear 4.8 (1.6, 14.7) 0.008 Dropped
Diagnostic review bias avoided: yes vs unclear 5.5 (1.8, 17.1) 0.005 Dropped Uninterpretable results reported: no vs unclear 0.3 (0.0, 4.1) 0.364 Dropped Uninterpretable results reported: yes vs unclear 2.9 (0.9, 9.1) 0.073 Dropped
Withdrawals accounted for: no vs unclear 0.2 (0.1, 0.7) 0.012 0.2 (0.1, 0.4) <0.001 Withdrawals accounted for: yes vs unclear 1.9 (0.7, 5.3) 0.200 1.8 (1.0, 3.4) 0.056 Europe vs North America 0.3 (0.1, 1.6) 0.190 Dropped
Asia vs North America 0.6 (0.1, 6.6) 0.646 Dropped Other areas vs North America 0.2 (0.0, 1.3) 0.090 Dropped Age <5 years vs <2 years 0.1 (0.0, 0.4) 0.004 Dropped Age <12 years vs <2 years 0.1 (0.0, 0.3) 0.004 Dropped Age <18 years vs <2 years 0.2 (0.1, 0.5) 0.001 Dropped
Sample centrifuged: yes vs no 0.3 (0.1, 0.6) 0.005 0.2 (0.1, 0.3) <0.001
Microscopy for pyuria: unweighted (n = 28 studies)
Age <5 years vs <2 years 0.3 (0.1, 1.1) 0.076 Dropped Age <12 years vs <2 years 0.5 (0.1, 2.1) 0.337 Dropped Age <18 years vs <2 years 0.3 (0.1, 1.0) 0.048 Dropped
Sample centrifuged 0.5 (0.2, 1.1) 0.080 0.5 (0.2, 1.1) 0.080
Microscopy for bacteriuria: weighted (n = 22 studies)
Incorporation bias avoided: no vs yes 24.5 (1.0, 604.4) 0.050 3.0 (1.6, 5.5) 0.001 Diagnostic review bias avoided: yes vs unclear 3.2 (0.8, 12.8) 0.092 Dropped
Gram stain used: yes vs no 3.6 (1.3, 10.4) 0.018 5.3 (2.3, 12.0) 0.001
Microscopy for bacteriuria: unweighted (n = 22 studies)
Disease progression bias: yes vs unclear 0.05 (0.0, 1.5) 0.083 Dropped
Incorporation bias avoided: no vs yes 32.5 (1.2, 895.0) 0.041 3.2 (1.6, 6.4) 0.003 Uninterpretable results reported: yes vs unclear 7.1 (1.1, 46.9) 0.042 Dropped
Withdrawals reported: no vs unclear 6.6 (1.0, 43.3) 0.049 Dropped Withdrawals reported: yes vs unclear 2.2 (0.3, 18.7) 0.447 Dropped Sample centrifuged: yes vs no 0.2 (0.0, 1.1) 0.058 Dropped
Gram stain used: yes vs no 3.9 (0.9, 16.3) 0.062 6.5 (2.0, 21.2) 0.004
*Only items that showed moderate evidence (p < 0.10) for an association with the DOR in the univariate analysis are included.
analysis there was very strong evidence that the DOR was higher in studies that used contrast enhanced ultrasound than those that used standard ultrasound (RDOR = 29.8, 95% CI: 13.5, 65.8, p < 0.001). Studies in which partial verification bias was avoided had DORs 4.1 times higher (95% CI: 1.1, 14.8) than those that did not (p = 0.034).
Discussion
[image:10.612.76.552.96.363.2]The methodological quality of primary studies remains a significant issue for systematic reviews of diagnostic tests [8,205,206]. The STARD initiative has provided clear guidance for the reporting of diagnostic accuracy studies [5]. This should have a positive impact on the quality of the diagnostic literature in the future. The QUADAS tool facilitates systematic evaluation of the quality of diagnos-tic accuracy studies, and was specifically developed for use in systematic reviews of diagnostic tests [12]. However, where studies are poorly reported the information that can be derived from quality assessment becomes limited. We cannot know whether an unreported QUADAS item reflects a true methodological flaw or poor reporting of a study that may be methodologically sound. Many of the studies included in our review were poorly reported. Our assessment of the impact of components of methodolog-ical quality on diagnostic accuracy may therefore partially reflect completeness of reporting. Whilst poor reporting
remains a widespread problem, it is almost impossible to assess the impact of components of methodological qual-ity on the results of diagnostic meta-analyses.
The common practice of using summary quality scores in systematic reviews has been widely debated elsewhere [207-209]. Summary scores, when used to inform quality-based analyses, may mask important effects of individual quality components [210]. As we report, the numbers of QUADAS items that were adequately addressed by studies included in our review were similar between the three clinical stages assessed in the review. Had the number of QUADAS items fulfilled been used as a summary score, potentially important variations in the individual items fulfilled would have been hidden. We therefore advocate that components of quality assessment should be reported fully, and their impact on outcome measures analysed individually rather than as summary scores.
Although ours was a large review, it included 187 studies reporting 487 data sets, our analysis of the impact of methodological quality on diagnostic accuracy was severely limited both by the diversity of the included stud-ies (few tests were evaluated by sufficient studstud-ies to allow meaningful use of meta-analytic pooling and investiga-tion of heterogeneity), and by incomplete reporting. All of Table 5: Results of the regression analysis for ultrasound for the diagnosis of reflux
Univariate analysis Multivariate analyis
Variable* RDOR (95% CI) p-value RDOR (95% CI) p-value
Ultrasound for the detection of reflux: weighted (n = 28 studies)
Use of contrast enhanced ultrasound: yes vs no 23.9 (9.8, 58.8) <0.001 8.0 (2.9, 22.0) <0.001
Ultrasound for the detection of reflux, with ultrasound type forced into the model: weighted (n = 28 studies)
Appropriate reference standard: yes vs unclear + 0.2 (0.0, 1.0) 0.047 Dropped$
Disease progression bias avoided: yes vs unclear 3.5 (1.4, 9.2) 0.011 1.4 (1.0, 1.9) 0.033 Withdrawals accounted for: yes vs unclear 3.2 (1.2, 8.5) 0.020 2.8 (1.1, 6.9) 0.027 Withdrawals accounted for: no vs unclear (0.4, 0.1, 1.7) 0.175 0.6 (0.1, 2.8) 0.502
Ultrasound for the detection of reflux: unweighted (n = 28 studies)
Use of contrast enhanced ultrasound: yes vs no 29.8 (13.5, 65.8) <0.001 29.8 (13.5, 65.8) <0.001
Ultrasound for the detection of reflux, with ultrasound type forced into the model: unweighted (n = 28 studies)
Appropriate reference standard *: yes vs unclear 0.2 (0.0, 1.2) 0.075 Dropped
Partial verification bias avoided: yes vs no 4.1 (1.1, 14.8) 0.034 4.1 (1.1, 14.8) 0.034
*Only items that showed moderate evidence (p < 0.10) for an association with the DOR in the univariate analysis are included.
+Only 1 unclear
the data sets used were sub-optimal, in that the numbers of observations were low in comparison to the number of variables investigated in the multivariate analyses[13]. Although different types of diagnostic tests were evaluated in the three clinical stages used by the review, generalisi-bility is limited in that all data concerned a single condition (UTI). A number of the items found to be asso-ciated with test performance related to specific test meth-odologies (e.g. Gram stain and contrast-enhanced ultrasound) and have no generalisability elsewhere. These items were found to show association in both the weighted and unweighted analyses. For the individual quality items there were some differences between the results of the weighted and unweighted analyses. In gen-eral, the results of weighted analyses showed more intui-tive associations. Unweighted analyses more often produced results that were difficult to explain, for exam-ple, in leukocyte esterase dipstick tests the unweighted analysis found that the test was more accurate in the group of children aged <12 years than in those aged <2 years. This might be expected and would probably reflect a higher likelihood of sample contamination in younger children, however, no difference in accuracy was found between under 18's and children aged <2 years. For both tests on the diagnosis of and further investigation of UTI weighted analyses showed an association between a number of variables relating to quality of reporting and diagnostic accuracy (well reported studies had higher DORs). We might expect this association to extend to diagnostic accuracy studies of all types of tests, but the present study is not adequate to demonstrate this. Weighted analysis of studies of ultrasound for the detec-tion of reflux showed that the DOR was higher where studies reported information to determine that disease progression bias had been avoided. Disease progression bias is a particular issue for imaging studies of this type where follow-up examinations (used as the reference standard of diagnosis) may be scheduled some time after ultrasound (usually the initial examination). This associ-ation was not shown in the unweighted analysis.
The information derived from these analyses is also lim-ited by the use of the summary ROC approach to pool studies. This method takes the DOR as the dependent var-iable. The DOR is used as a single indicator of test per-formance and shows how much more frequently a positive test result occurs in a person with the condition of interest than in one without the condition, relative to how much more frequently a negative result occurs in a person without the condition than in one with the condi-tion. Using the DOR to investigate heterogeneity means that we cannot assess whether the factors investigated are associated with paired measures of diagnostic accuracy, such as sensitivity and specificity, or positive and negative likelihood ratios. Often factors that lead to an increase in
sensitivity will lead to a decrease in specificity and vice versa. Factors that lead to this pattern of change may have no effect on an overall measure such as the DOR. Using the DOR to investigate heterogeneity may thus miss rele-vant clinical associations. Recently a new method for pooling sensitivity and specificity has been developed. This method is known as the "bivariate model" [211]. It preserves the underlying two-dimensional nature of the data and produces direct pooled estimates of sensitivity and specificity, incorporating any correlation that might exist between these two measures. The model can be extended to include explanatory variables leading to sep-arate effects on sensitivity and specificity. This method has two advantages over the standard methods: (1) the pooled estimates of sensitivity and specificity take into account the correlation between these two measures; (2) the effect of possible sources of heterogeneity on both sensitivity and specificity can be investigated in a single model rather than just looking at the effect of these varia-bles on a single measure of test performance, the DOR. These methods may have potential applications in future studies of this type.
Conclusion
Given the limitations we describe, the results of this study should be treated as hypothesis generating. Further work is needed to elucidate the influence of components of the methodological quality of primary studies on the results of diagnostic meta-analyses. Large data sets of well-reported primary studies are needed to address this question. Without significant improvements in the reporting of primary studies, progress in this area will be limited. The components of quality assessment should always be reported, and their impact on summary out-come measures be investigated, individually rather than as summary quality scores. Careful consideration should be given to the choice of weighting when conducting regression analyses. Weighting by sample size appears the most appropriate method for analyses of diagnostic accu-racy studies, but this area requires further investigation.
Competing interests
The author(s) declare that they have no competing interests
Authors' contributions
All authors contributed towards the conception and design of the study and the interpretation of the data. They also read and approved the final manuscript. PW and MW participated in data extraction, the analysis of data, and drafted the article.
Acknowledgements
The work was done as part of a project commissioned and funded by the NHS R&D Health Technology Assessment Programme (project number 01/66/01). The views expressed in this review are those of the authors and not necessarily those of the Standing Group, the Commissioning Group, or the Department of Health.
References
1. Deeks JJ: Using evaluations of diagnostic tests: understanding their limitations and making the most of the available evidence. Annals of Oncology 1999, 10:761-768.
2. Sackett DL, Haynes RB: The architecture of diagnostic research. BMJ 2002, 324:539-541.
3. Irwig L, Bossuyt PMM, Glasziou P, Gatsonis C, Lijmer JG: Designing studies to ensure that estimates of test accuracy are transferable. BMJ 2002, 324:669-671.
4. Knottnerus JA, Muris JW: Assessment of the accuracy of diag-nostic tests: the cross-sectional study. Journal of Clinical Epidemiology 2003, 56:1118-1128.
5. Bossuyt PMM, Reitsma JB, Bruns DE, Gatsonis C, Glasziou P, Irwig L, Moher D, Rennie D, de Vet HCW, Lijmer JG: The STARD state-ment for reporting studies of diagnostic accuracy: Explana-tion and elaboraExplana-tion. Annals of Internal Medicine 2003,
138:W1-W12.
6. Sheps SB, Schechter MT: The assessment of diagnostic tests. A survey of current medical research. JAMA 1984, 252:2418-2422. 7. Reid MC, Lachs MS, Feinstein AR: Use of methodological stand-ards in diagnostic test research. getting better but still not good. JAMA 1995, 274:645-651.
8. Revicki DA, Yabroff KR, Shikiar R: Outcomes research in radio-logic imaging: Identification of barriers and potential solutions. Academic Radiology 1999, 6:S20-S28.
9. Whiting P, Rutjes AWS, Dinnes J, Reitsma JB, Bossuyt PM, Kleijnen J:
A systematic review finds that diagnostic reviews fail to incorporate quality despite available tools. J Clin Epidemiol 2005, 58:1-12.
10. Whiting P, Rutjes AWS, Reitsma JB, Glas AS, Bossuyt PM, Kleijnen J:
Sources of Variation and Bias in Studies of Diagnostic Accu-racy: A Systematic Review. Annals of Internal Medicine 2004,
140:189-202.
11. Whiting P, Westwood M, Ginnelly L, Palmer S, Richardson G, Cooper J, Watt I, Glanville J, Sculpher M, Kleijnen J: A systematic review of tests for the diagnosis and evaluation of urinary tract infec-tion (UTI) in children under five years. HEALTH TECHNOLOGY ASSESSMENT . In press
12. Whiting P, Rutjes AWS, Reitsma JB, Bossuyt PM, Kleijnen J: The development of QUADAS: a tool for the quality assessment of studies of diagnostic accuracy included in systematic reviews. BMC Med Res Methodol 2003, 3:25.
13. Altman DG: Practical statistics for medical research. London, Chapman & Hall; 1991.
14. Vamvakas EC: Meta-analyses of studies of the diagnostic accu-racy of laboratory tests: a review of the concepts and methods. Archives of Pathology & Laboratory Medicine 1998,
122:675-686.
15. Moses LE, Shapiro D, Littenberg B: Combining independent stud-ies of a diagnostic test into a summary ROC curve: data-ana-lystic approaches and some additional considerations.
Statistics in Medicine 1993, 12:1293-1316.
16. Fleiss JL: The statistical basis of meta-analysis. Statistical Methods in Medical Research 1993, 2:121-145.
17. Lijmer JG, Bossuyt PMM, Heisterkamp SH: Exploring sources of heterogeneity in systematic review of diagnostic tests. Statis-tics in Medicine 2002, 21:1525-1537.
18. Ahmad T, Vickers D, Campbell S, Coulthard MG, Pedler S: Urine collection from disposable nappies. Lancet 1991, 338:674-676. 19. Anad FY: A simple method for selecting urine samples that
need culturing. Annals of Saudi Medicine 2001, 21:104-105. 20. Armengol CE, Hendley JO, Schlager TA: Should we abandon
standard microscopy when screening for urinary tract infec-tions in young children? Pediatric Infectious Disease Journal 2001,
20:1176-1177.
21. Armengol CE, Hendley JO, Schlager TA: Urinary tract infection in young children cannot be excluded with urinalysis. Pediatric Research 2000, 47:172A.
22. Aronson AS, Gustafson B, Svenningsen NW: Combined suprapu-bic aspiration and clean-voided urine examination in infants and children. Acta Paediatrica Scandinavica 1973, 62:396-400. 23. Arslan S, Caksen H, Rastgeldi L, Uner A, Oner AF, Odabas D: Use of
urinary gram stain for detection of urinary tract infection in childhood. Yale Journal of Biology and Medicine 2002, 75:73-78. 24. Bachur R, Harper MB: Reliability of the urinalysis for predicting
urinary tract infections in young febrile children. Archives of Pediatrics & Adolescent Medicine 2001, 155:60-65.
25. Baum JD, Darrell JH, Lambert RA: Evaluation of dip inoculum urine culture. Archives of Disease in Childhood 1972, 47:977-978. 26. Boreland PC, Stoker M: Dipstick analysis for screening of
paedi-atric urine. Journal of Clinical Pathology 1986, 39:1360-1362. 27. Braude H, Forfar JO, Gould JC, McLeod JW: Diagnosis of urinary
tract infection in childhood based on examination of pared non-catheter and catheter specimens of urine. British Medical Journal 1967, 4:702-705.
28. Bulloch B, Bausher JC, Pomerantz WJ, Connors JM, Mahabee-Gittens M, Dowd MD: Can urine clarity exclude the diagnosis of uri-nary tract infection? Pediatrics 2000, 106:E60.
29. Rodriguez Caballero AM, Novoa Vazquez P, Perez Ruiz A, Carmona Perez A, Cano Fernandez J, Sanchez Bayle M: Assessment of leuko-cyturia in the diagnosis of urinary tract infections. Revista Espanola de Pediatria 2001, 57:305-308.
30. Rodriguez Cervilla J, Alonso Alonso C, Fraga Bermudez JM, Perez Munuzuri A, Gil Calvo M, Ariceta Iraola G, Fernandez Lorenzo JR:
Urinary tract infection in children: Clinical and analytical prospective study for differential diagnosis in children with suspicion of an infectious disease. Revista Espanola de Pediatria 2001, 57:144-152.
31. Cid E, Fernandez Seara MJ, Buznego R, Pavon P, Rodrigo E, Castro-Gago M: Comparative study between Uricult and urine cul-ture for the diagnosis of urinary infections in infants. Revista Espanola de Pediatria 1992, 48:23-25.
32. Cohen HA, Woloch B, Linder N, Vardi A, Barzilai A: Urine samples from disposable diapers: an accurate method for urine cultures. Journal of Family Practice 1997, 44:290-292.
33. Craver RD, Abermanis JG: Dipstick only urinalysis screen for the pediatric emergency room. Pediatric Nephrology 1997,
11:331-333.
34. Dayan PS, Bennett J, Best R, Bregstein JS, Levine D, Novick MK, Son-nett FM, Stimell-Rauch ML, Urtecho J, Wagh A, Miller SZ: Test char-acteristics of the urine Gram stain in infants less than 60 or 60 days of age with fever. Pediatric Emergency Care 2002, 18:12-14. 35. Dayan PS, Chamberlain JM, Boenning D, Adirim T, Schor JA, Klein BL:
A comparison of the initial to the later stream urine in chil-dren catheterized to evaluate for a urinary tract infection.
Pediatric Emergency Care 2000, 16:88-90.
36. Demi M, Costa L, Zanardo V: [Urinary tract infections in new-borns: sensitivity, specificity, and predictive value of urinary screening with the reagent strip test]. Pediatria Medica e Chirurgica 1993, 15:29-31.
37. Dosa S, Houston IB, Allen LB, Jennison R: Urinary glucose unreli-able as test for urinary tract infection in infancy. Archives of Dis-ease in Childhood 1973, 48:733-737.
38. Farrell M, Devine K, Lancaster G, Judd B: A method comparison study to assess the reliability of urine collection pads as a means of obtaining urine specimens from non-toilet-trained children for microbiological examination. Journal of Advanced Nursing 2002, 37:387-393.
39. Feasey S: Are Newcastle urine collection pads suitable as a means of collecting specimens from infants? Paediatric Nursing 1999, 11:17-21.
40. Fennell RS, Wilson SG, Garin EH, Pryor ND, Sorgen CD, Walker RD, Richard GA: The combination of two screening methods in a home culture program for children with recurrent bacteriu-ria. An evaluation of a culture method plus a nitrite reagent test strip. Clinical Pediatrics 1977, 16:951-955.
41. Benito Fernandez J, Garcia Ribes A, Trebolazabala Quirante N, Mint-egi Raso S, Vazquez Ronco M, Urra Zalbidegoitia E: [Gram stain and dipstick as diagnostic methods for urinary tract infection in febrile infants]. Anales Espanoles de Pediatria 2000, 53:561-566. 42. Benito Fernandez J, Sanchez Echaniz J, Mintegui Raso S, Montejo F:
deter-mine the reliability of culture specimen of urine collected in perineal bag. Anales Espanoles de Pediatria 1996, 45:149-152. 43. Giraldez M, Perozo M, González F, Rodríguez M: Infección urinaria
cinta reactiva y sedimento urinario vs. urocultivo para deter-minación de bacteriuria. Salus militiae 1998, 23:27-31.
44. Godard C, Frutiger P, Delarue C, Christen JP, Wavre D, Girardet P:
Testing for bacteriuria by home culturing in preschool girls.
Helvetica Paediatrica Acta 1979, 34:209-212.
45. Gorelick MH, Shaw KN: Clinical decision rule to identify febrile young girls at risk for urinary tract infection. Archives of Pediat-rics & Adolescent Medicine 2000, 154:386-390.
46. Hardy JD, Furnell PM, Brumfitt W: Comparison of sterile bag, clean catch and suprapubic aspiration in the diagnosis of uri-nary infection in early childhood. British Journal of Urology 1976,
48:279-283.
47. Hiraoka M, Hida Y, Hori C, Tsuchida S, Kuroda M, Sudo M: Urine microscopy on a counting chamber for diagnosis of urinary infection. Acta Paediatrica Japonica 1995, 37:27-30.
48. Hitzel A, Liard A, Vera P, Manrique A, Menard JF, Dacher JN: Color and power Doppler sonography versus DMSA scintigraphy in acute pyelonephritis and in prediction of renal scarring. Jour-nal of Nuclear Medicine 2002, 43:27-32.
49. Hoberman A, Wald ER, Reynolds EA, Penchansky L, Charron M: Is urine culture necessary to rule out urinary tract infection in young febrile children? Pediatric Infectious Disease Journal 1996,
15:304-309.
50. Hoberman A, Wald ER, Reynolds EA, Penchansky L, Charron M: Pyu-ria and bacteriuPyu-ria in urine specimens obtained by catheter from young children with fever. Journal of Pediatrics 1994,
124:513-519.
51. Hoberman A, Wald ER, Penchansky L, Reynolds EA, Young S:
Enhanced urinalysis as a screening test for urinary tract infection. Pediatrics 1993, 91:1196-1199.
52. Holland PD, Doyle CT, English L: An evaluation of chemical tests for significant bacteriuria. Journal of the Irish Medical Association 1968, 61:128-130.
53. Kohler L, Fritz H, Schersten B: Screening for bacteriuria with Uriglox in children. Acta Paediatrica Scandinavica Supplement 1970,
206:76-78.
54. Kunin CM, DeGroot JE: Sensitivity of a nitrite indicator strip method in detecting bacteriuria in preschool girls. Pediatrics 1977, 60:244-245.
55. Labbe J: [Usefulness of testing for nitrites in the diagnosis of urinary infections in children]. Union Medicale du Canada 1982,
111:261-265.
56. Lagos Zuccone R, Carter S J, Herrera Labarca P: Utilidad de una tira reactiva y del aspecto macroscópico de la orina para des-cartar la sospecha clínica de infección del tracto urinario en niños ambulatorios. Rev Chil Pediatr 1994, 65:88-94.
57. Lejeune B, Baron R, Guillois B, Mayeux D: Evaluation of a screen-ing test for detectscreen-ing urinary tract infection in newborns and infants. Journal of Clinical Pathology 1991, 44:1029-1030.
58. Lin DS, Huang FY, Chiu NC, Koa HA, Hung HY, Hsu CH, Hsieh WS, Yang DI: Comparison of hemocytometer leukocyte counts and standard urinalyses for predicting urinary tract infec-tions in febrile infants. Pediatric Infectious Disease Journal 2000,
19:223-227.
59. Lin DS, Huang SH, Lin CC, Tung YC, Huang TT, Chiu NC, Koa HA, Hung HY, Hsu CH, Hsieh WS, Yang DI, Huang FY: Urinary tract infection in febrile infants younger than eight weeks of age.
Pediatrics 2000, 105:E20-20.
60. Liptak GS, Campbell J, Stewart R, Hulbert WC: Screening for uri-nary tract infection in children with neurogenic bladders.
American Journal of Physical Medicine & Rehabilitation 1993, 72:122-126. 61. Littlewood JM, Jacobs SI, Ramsden CH: Comparison between microscopical examination of unstained deposits of urine and quantitative culture. Archives of Disease in Childhood 1977,
52:894-896.
62. Lockhart GR, Lewander WJ, Cimini DM, Josephson SL, Linakis JG:
Use of urinary gram stain for detection of urinary tract infec-tion in infants. Annals of Emergency Medicine 1995, 25:31-35. 63. Lohr JA, Portilla MG, Geuder TG, Dunn ML, Dudley SM: Making a
presumptive diagnosis of urinary tract infection by using a urinalysis performed in an on-site laboratory. Journal of Pediatrics 1993, 122:22-25.
64. Manson R, Scholefield J, Johnston RJ, Scott R: The screening of more than 2,000 schoolgirls for bacteriuria using an auto-mated fluorescence microscopy system. Urological Research 1985, 13:143-148.
65. Marret M, Tay S, Yap HK, Murugasu B: Comparison of two rapid screening tests for urinary tract infection in children. Annals Academy of Medicine Singapore 1995, 24:299.
66. Marsik FJ, Owens D, Lewandowski J: Use of the leukocyte este-rase and nitrite tests to determine the need for culturing urine specimens from a pediatric and adolescent population.
Diagnostic Microbiology & Infectious Disease 1986, 4:181-183. 67. Matthai J, Ramaswamy M: Urinalysis in urinary tract infection.
Indian Journal of Pediatrics 1995, 62:713-716.
68. Mongeau JG, Robillard JE, Brousseau Y: Screening for bacteriuria in children: comparison of two dip-tests. Canadian Medical Asso-ciation Journal 1972, 107:227-229.
69. Morin D, Veyrac C, Kotzki PO, Lopez C, Dalla Vale F, Durand MF, Astruc J, Dumas R: Comparison of ultrasound and dimercapto-succinic acid scintigraphy changes in acute pyelonephritis.
Pediatric Nephrology 1999, 13:219-222.
70. Morton RE, Lawande R: The diagnosis of urinary tract infection: comparison of urine culture from suprapubic aspiration and midstream collection in a children's out-patient department in Nigeria. Annals of tropical paediatrics 1982, 2:109-112.
71. Dominguez Navarrete N: [Evaluation of triphenyl tetrazolium chloride as a diagnostic test in urinary infections]. Anales de la Facultad de Medicina, Universidad Nacional Mayor de San Marcos de Lima 1966, 49:294-307.
72. Villanustre Ordonez C, Buznego Sanchez R, Rodicio Garcia M, Rod-rigo Saez E, Fernandez Seara MJ, Pavon Belinchon P, Castro-Gago M:
Comparative study of semiquantitative methods (leuko-cytes, nitrite test and uricult) with urine culture for the diag-nosis of urinary tract infection during infancy. Anales Espanoles de Pediatria 1994, 41:325-328.
73. Palmer LS, Richards I, Kaplan WE: Clinical evaluation of a rapid diagnostic screen (URISCREEN) for bacteriuria in children.
Journal of Urology 1997, 157:654-657.
74. Parmington J, Kornberg A: Nitrite screening for urinary tract infection in a Pediatric Emergency Department. Pediatric Emergency Care 1989, 5:285-286.
75. Pryles CV, Eliot CR: Pyuria and bacteriuria in infants and chil-dren. The value of pyuria as a diagnostic criterion of urinary tract infections. American Journal of Diseases of Children 1965,
110:628-635.
76. Purwar VN, Agrawal SP, Dikshit SK: Gram stained urine slides in the diagnosis of urinary tract infections in children. Journal of the Indian Medical Association 1972, 59:387-388.
77. Pylkkanen J, Vilska J, Koskimies O: Diagnostic value of symptoms and clean-voided urine specimen in childhood urinary tract infection. Acta Paediatrica Scandinavica 1979, 68:341-344.
78. Ramage IJ, Chapman JP, Hollman AS, Elabassi M, McColl JH, Beattie TJ: Accuracy of clean-catch urine collection in infancy. Journal of Pediatrics 1999, 135:765-767.
79. Rich G, Glass NJ, Selkon JB: Cost-effectiveness of two methods of screening for asymptomatic bacteriuria. British Journal of Pre-ventive & Social Medicine 1976, 30:54-59.
80. Santos MA, Mos EN, Schmidt BJ, Piva S: Comparacion entre el estudio bacterioscopico cuantitativo y el urocultivo para el diagnostico de infeccion urinaria en pediatria. Bol Méd Hosp Infant Méx 1982, 39:526-530.
81. Saxena H, Ajwani KD, Mehrotra D: Quantitative pyuria in the diagnosis of urinary infections in children. Indian Journal of Pediatrics 1975, 42:35-38.
82. Schersten B, Dahlqvist A, Fritz H, Kohler L, Westlund L: Screening for bacteriuria with a test paper for glucose. JAMA 1968,
204:205-208.
83. Schreiter G, Buhtz P: [Diagnostic value of the cytologic and bac-teriologic urine examinations in pediatrics. II. Comparison of leukocyturia and bacteriuria]. Deutsche Gesundheitswesen 1971, 26:1318-1323.
84. Sharief N, Hameed M, Petts D: Use of rapid dipstick tests to exclude urinary tract infection in children. British Journal of Bio-medical Science 1998, 55:242-246.
86. Shaw KN, Hexter D, McGowan KL, Schwartz JS: Clinical evalua-tion of a rapid screening test for urinary tract infecevalua-tions in children. Journal of Pediatrics 1991, 118:733-736.
87. Struthers S, Scanlon J, Parker K, Goddard J, Hallett R: Parental reporting of smelly urine and urinary tract infection.
ARCHIVES OF DISEASE IN CHILDHOOD 2003, 88:250-252.
88. Tahirovic H, Pasic M: A modified nitrite test as a screening test for significant bacteriuria. European Journal of Pediatrics 1988,
147:632-633.
89. Todd J, McLain L, Duncan B, Brown M: A nonculture method for home follow-up of urinary tract infections in childhood. Jour-nal of Pediatrics 1974, 85:514-516.
90. Vangone G, Russo G: [Bacteria and leukocyte count in the urine in the diagnosis of urinary tract infections]. Pediatria Medica e Chirurgica 1985, 7:125-129.
91. Vickers D, Ahmad T, Coulthard MG: Diagnosis of urinary tract infection in children: fresh urine microscopy or culture? Lan-cet 1991, 338:767-770.
92. Waisman Y, Zerem E, Amir L, Mimouni M: The validity of the uris-creen test for early detection of urinary tract infection in children. Pediatrics 1999, 104:e41.
93. Wammanda RD, Aikhionbare HA, Ogala WN: Use of nitrite dip-stick test in the screening for urinary tract infection in children. West African Journal of Medicine 2000, 19:206-208. 94. Weinberg AG, Gan VN: Urine screen for bacteriuria in
sympto-matic pediatric outpatients. Pediatric Infectious Disease Journal 1991, 10:651-654.
95. Wiggelinkhuizen J, Maytham D, Hanslo DH: Dipstick screening for urinary tract infection. South African Medical Journal 1988,
74:224-228.
96. Woodward MN, Griffiths DM: Use of dipsticks for routine anal-ysis of urine from children with acute abdominal pain. BMJ 1993, 306:1512.
97. Andrich MP, Majd M: Evaluation of febrile urinary tract infec-tions in children utilizing Technetium-99m DMSA scanning.
Journal of Nuclear Medicine 1992, 33:976.
98. Barnett GR, Abbott GD: Localization of gram negative urinary tract infection by immunofluorescence in infants and children. Australian Paediatric Journal 1978, 14:143-146.
99. Benador D, Benador N, Slosman DO, Nussle D, Mermillod B, Girar-din E: Cortical scintigraphy in the evaluation of renal paren-chymal changes in children with pyelonephritis. Journal of Pediatrics 1994, 124:17-20.
100. Biggi A, Dardanelli L, Pomero G, Cussino P, Noello C, Sernia O, Spada A, Camuzzini G: Acute renal cortical scintigraphy in children with a first urinary tract infection. Pediatric Nephrology 2001,
16:733-738.
101. Bircan ZE, Buyan N, Hasanoglu E, Ozturk E, Bayhan H, Isik S: Radio-logic evaluation of urinary tract infection. International Urology & Nephrology 1995, 27:27-32.
102. Boudailliez B, Berro Y, Hosri JA, Esper IE, Grumbach Y: A prospec-tive study of imaging modalities in acute pyelonephritis (49 cases): DMSA renal scintigraphy versus power Doppler (PD) renal sonography. Pediatric Nephrology 1998, 12:C132.
103. Buyan N, Bircan ZE, Hasanoglu E, Ozturk E, Bayhan H, Rota S: The importance of 99mTc DMSA scanning in the localization of childhood urinary tract infections. International Urology & Nephrology 1993, 25:11-17.
104. Capa Kaya G, Taskiran Y, Bak M, Aydin A, Toksavul O, Uslu Y, Ozturk E, Durak H: Urinary N-acetyl-beta-glucosaminidase in chil-dren with upper urinary tract infection, in relation to Tc-99m DMSA scintigraphy. European Journal Of Nuclear Medicine 2001, 28:1156-1156.
105. Dacher JN, Pfister C, Monroc M, Eurin D, Le Dosseur P: Power Doppler sonographic pattern of acute pyelonephritis in chil-dren: Comparison with CT. American Journal of Roentgenology 1996, 166:1451-1455.
106. Everaert K, Raes A, Hoebeke P, Samijn W, Delanghe J, Vande Wiele C, Vande Walle J: Combined use of urinary alpha1-microglob-ulin and 99mTc DMSA scintigraphy in the diagnosis and fol-low-up of acute pyelonephritis and cystitis in children.
European Urology 1998, 34:486-491.
107. Fretzayas A, Moustaki M, Gourgiotis D, Bossios A, Koukoutsakis P, Stavrinadis C: Polymorphonuclear elastase as a diagnostic marker of acute pyelonephritis in children. Pediatrics 2000,
105:E28.
108. Gervaix A, Galetto-Lacour A, Gueron T, Vadas L, Zamora S, Suter S, Girardin E: Usefulness of procalcitonin and C-reactive protein rapid tests for the management of children with urinary tract infection. Pediatric Infectious Disease Journal 2001, 20:507-511. 109. Castello Girona F, Vilaplana Canto E, Yeste Fernandez D, Roca Bielsa I, Enriquez Civico G: 99mTc dimercaptosuccinic scan in the study of the first urinary tract infection in infants. Anales Espa-noles de Pediatria 1995, 42:118-122.
110. Guermazi F, Lenoir P, Verboven M, Smets A, Braeckman J, Jonckheer MH, Piepsz A: [Technetium 99m labeled dimercaptosuccinic acid (99m Tc-DMSA) scintigraphy in the diagnosis and fol-low-up of urinary infections in children]. Archives Francaises de Pediatrie 1993, 50:391-398.
111. el Hajjar M, Launay S, Hossein-Foucher C, Foulard M, Robert Y:
[Power Doppler sonography and acute pyelonephritis in chil-dren: comparison with Tc-DMSA scintigraphy]. Archives de Pediatrie 2002, 9:21-25.
112. Hellerstein S, Kennedy E, Nussbaum L, Rice K: Localization of the site of urinary tract infections by means of antibody-coated bacteria in the urinary sediments. Journal of Pediatrics 1978,
92:188-193.
113. Hitzel A, LiardZmuda A, Manrique A, Dacher JN, Vera P: Compar-ative study of DMSA scintigraphy (DMSA) and Doppler sonography (DS) in the diagnosis of acute pyelonephritis and scarring in children. Journal of Nuclear Medicine 2000, 41:209-209. 114. Ilyas M, Mastin ST, Richard GA: Age-related radiological imaging in children with acute pyelonephritis. Pediatric Nephrology 2002,
17:30-34.
115. Jakobsson B, Nolstedt L, Svensson L, Soderlundh S, Berg U:
99mTechnetium-dimercaptosuccinic acid scan in the diag-nosis of acute pyelonephritis in children: relation to clinical and radiological findings. Pediatric Nephrology 1992, 6:328-334. 116. Jantausch BA, Rifai N, Getson P, Akram S, Majd M, Wiedermann BL:
Urinary N-acetyl-beta-glucosaminidase and beta-2-microglobulin in the diagnosis of urinary tract infection in febrile infants. Pediatric Infectious Disease Journal 1994, 13:294-299. 117. Jequier S, Jequier JC, Hanquinet S: Acute childhood pyelonephri-tis: Predictive value of positive sonographic findings in regard to later parenchymal scarring. Academic Radiology 1998,
5:344-353.
118. Krzemien G, Roszkowska-Blaim M, Brzewski M, Kostro I, Szmigielska A, Karpinska M, Marcinski A: Comparison of power Doppler ultrasonography with 99mTc-DMSA renal scintigraphy in the diagnosis of acute pyelonephritis. Polski Merkuriusz Lekarski 2002, 12:405-407.
119. Landau D, Turner ME, Brennan J, Majd M: The value of urinalysis in differentiating acute pyelonephritis from lower urinary tract infection in febrile infants. Pediatric Infectious Disease Journal 1994, 13:777-781.
120. Landau D, Brennan J, Turner ME, Majd M: A negative urinalysis predicts the absence of acute pyelonephritis in febrile infants. Pediatric Research 1994, 35:185.
121. Lavocat MP, Granjon D, Allard D, Gay C, Freycon MT, Dubois F:
Imaging of pyelonephritis. Pediatric Radiology 1997, 27:159-165. 122. Lonergan GJ, Pennington DJ, Morrison JC, Haws RM, Grimley MS,
Kao TC: Childhood pyelonephritis: comparison of gadolin-ium-enhanced MR imaging and renal cortical scintigraphy for diagnosis. Radiology 1998, 207:377-384.
123. Montplaisir S, Courteau C, Martineau B, Pelletier M: Limitations of the direct immunofluorescence test for antibody-coated bacteria in determining the site of urinary tract infections in children. CMAJ: Canadian Medical Association Journal 1981,
125:993-996.
124. Pylkkanen J: Antibody-coated bacteria in the urine of infants and children with their first two urinary tract infections. Acta Paediatr Scand 1978, 67:275-279.
125. La Cava G, Sciagra R, Materassi M, Ienuso R, Meldolesi U: Accuracy of renal sequential scintigraphy for the recognition of renal involvement in pediatric patients affected by urinary tract infection. European Journal of Nuclear Medicine 1990, 16:415. 126. Sfakianakis GN, Mylonakis T, Zilleruelo G, Leon M, Flores F, Ganz W,