promoting access to White Rose research papers
White Rose Research Online
Universities of Leeds, Sheffield and York
http://eprints.whiterose.ac.uk/
This is an author produced version of a paper published in Physics of Fluids.
White Rose Research Online URL for this paper: http://eprints.whiterose.ac.uk/3717/
Published paper
Sharpe, G.J. and Short, M. (2007) Ignition of thermally sensitive explosives
between a contact surface and a shock. Physics of Fluids, 19 (12). Art. No.
126102.
Ignition of thermally-sensitive explosives between a contact
surface and a shock.
Gary J. Sharpe†& Mark Short‡
†School of Mechanical Engineering, University of Leeds,
Leeds, LS2 9JT, UK. Email: [email protected]. ‡Los Alamos National Laboratory,
Los Alamos, New Mexico, NM 87545, USA.
(Dated: March 15, 2008)
Abstract
I. INTRODUCTION
Ignition of explosive fuels by the passage of a shock wave is an important issue from
the perspective of safety (e.g. storage and handling). For fuels which can be characterized
by a single exothermic reaction model with an Arrhenius form of the reaction rate, the
evolutionary mechanisms of the shock-to-detonation transition process are well understood
in the case that the shock is driven by a constant velocity piston, or equivalently by the
reflection of a weaker shock from a stationary wall.
Indeed, a complete theoretical picture of the shock-to-detonation transition process exists
for the asymptotic limit of large activation energy of the reaction [1–3]. This theory shows
that the evolution begins with an induction stage during which the shocked material slowly
evolves from the uniform initial shocked state due to weak heat release. This stage ends with
a thermal runaway event at the piston (where the material has been shocked for the longest).
The fuel subsequently burns to complete reaction on a timescale which is exponentially short
compared to the induction time. However, this thermal runaway event is just the first in
a series of local thermal runaways, which occur sequentially due to a gradient in induction
times created by the passage of the shock. A locus of thermal runaways thus moves away from
the initial point of runaway, which represents the leading order the path of a weak detonation
wave (a shockless reaction wave which is supersonic throughout in its own rest frame) [1–3].
Since the reaction rates are exponentially rapid in the high activation energy limit, this wave
is assumed quasi-steady, i.e. the particle transit time through the wave is short compared to
the evolution time of the wave. This quasi-steady weak detonation decelerates very rapidly,
and once it reaches the Chapman-Jouguet (CJ) speed, a sonic point appears in the region of
reaction burnout [1]. At this point unsteady effects become important, which results in the
formation of a secondary shock. This interior shock subsequently accelerates, and propagates
rapidly through the remaining part of the upstream weak detonation, transforming it into
a strong detonation [1]. This theory predicts that the strong detonation forms very close to
the piston in gaseous fuels [2].
However, numerical simulations of the piston driven shock-to-detonation process with
finite, but realistic activation energies [4, 5] show qualitatively different evolution scenarios
than that predicted by the asymptotic theory . For moderately large activation energies, the
weak detonation, with the remainder of the wave complex comprising an unsteady
com-bustion zone followed by part of a quasi-steady fast-flame (an expansive, subsonic reaction
wave). Due to this unsteadiness, the secondary shock forms internal to the reaction wave
complex, sometimes closer to the head of the wave complex than to the rear, and the spatial
location of the shock formation may be orders of magnitude further from the piston face
than the asymptotic prediction. As the effective activation energy is decreased (e.g. as the
strength of the initiating shock increases), the region of the reaction wave consisting of a
weak detonation rapidly diminishes, and the wave becomes more and more unsteady. The
points of formation of the secondary shock and strong detonation also move further from
the piston face and closer to the initiating shock [5].
The disparity between the large activation energy asymptotic picture and the finite
ac-tivation energy calculations is due to the assumption in the asymptotics that the reaction
wave which emerges from the induction phase is quasi-steady. In the high activation energy
limit, the weak detonation decelerates extremely rapidly, and hence the secondary shock
forms extremely close to the piston face [2]. For such rapid decelerations, the post-shock
temperature scaled activation energy would need to be very high in order for the main
re-action zone to be sufficiently thin that the quasi-steady approximation holds. For the finite
activation energies considered in [4, 5], the main reaction zone times are not short compared
to the asymptotic wave deceleration time, and hence unsteadiness needs to be considered,
which profoundly affects the evolution [5].
A more general problem than the piston driven shock case described above is that of
ignition between a contact surface and a shock. This scenario arises, for example, when
two weak shocks merge, producing an expansion wave, contact surface, and stronger shock
triad [6, 7] with an increased temperature (and hence shorter induction time) in the region
between the contact surface and the shock. This occurs, for example, in the
deflagration-to-detonation transition experiments of Urtiew & Oppenheim [8], where an accelerating flame
produces a series of shocks which subsequently merge. It also can occur as part of the piston
driven shock initiation scenario itself, when the secondary shock formed in the ignition
process overtakes the original initiating shock [5]. In addition, the contact-shock problem
arises in shock-initiation experiments on condensed phase (solid and liquid) explosives. In
these experiments, a gas gun is used to drive flier plates into the explosive, e.g. [10, 11].
back into the projectile; the contact surface is the material interface between projectile and
explosive. Another scenario where the contact-shock configuration occurs is in shock tubes
when a diaphragm between a higher pressure driver gas and the explosive gas is burst, again
producing an expansion, contact and shock triad, e.g. [12]. A related problem occurs in
the failure and subsequent re-ignition of a strong detonation wave [13]. In the failing strong
detonation, the shock and reaction decouple into a weak shock and a fast-flame, with the
latter acting as a contact discontinuity separating the induction zone behind the weak shock
from the burnt products. The strong regime of shock-induced ignition in gaseous explosives
and the flier plate experiments in condensed phase explosives are reproducible, essentially
one-dimensional events [8, 11].
In ignition between a contact surface and shock, the role of the contact surface is to
enhance chemical reaction by partially reflecting acoustic pressure waves created by the
evo-lution of the induction zone ahead of it. These waves are also partially transmitted into
the material behind the contact surface. Thus the contact-shock problem is more general
than the problem of ignition between a piston and a shock. The former includes an extra
variable, namely the acoustic impedance of the material behind the contact surface[6]. In
fact, the more general contact-shock problem includes the piston driven shock case
consid-ered previously. The latter is recovconsid-ered in the limit of infinite acoustic impedance behind
the contact surface [6].
Solutions of the contact-shock problem have been obtained in the large activation energy
asymptotic limit [2, 6, 7, 9], which are described more fully in §III below. The induction
time is found to increase as the acoustic impedance of the contact surface decreases, due to
larger acoustic leakage through the contact surface. However, in contrast to the piston driven
shock case, the point of first thermal runaway may occur not at the contact surface itself,
but a small distance ahead of it. Thus, somewhat counter-intuitively, the particle which has
been shocked the longest is not necessarily the first one to reach ignition. The reason is that,
as the temperature begins to rise, the material is able to expand locally near the contact
surface more readily than in the piston case due to the finite impedance of the contact
surface. This results in a relative deceleration of the contact surface, and a competition
develops between expansion of the material and heat accumulation, thus delaying ignition
at the contact surface [6]. However, the first ignition still occurs close to the contact surface,
to the thermal runaway time. As the acoustic impedance of the contact surface is increased,
the point of first runaway moves closer to it [6, 7, 9].
In the asymptotic solution of the contact-shock ignition problem, particles subsequently
runaway sequentially in both the upstream and downstream directions from this first point
of ignition. This signifies weak detonations moving both forward and backward away from
this point. The forward moving wave still decelerates rapidly, but not as quickly as in the
piston driven shock scenario. However, the backward weak detonation that moves towards
the contact surface is found to decelerate much more rapidly than the forward moving wave,
so that, despite the very small distance between the contact surface and the origin of the
wave, its speed still drops significantly before it reaches the contact surface. Depending on
the acoustic impedance, the weak detonation may slow to the CJ speed before it reaches
the contact surface. In such cases this would signify the birth of a strong detonation wave
moving towards the contact surface.
Due to the very small length and time scales involved in the asymptotic solutions, i.e.
the very small distance between the contact surface and the point of first runaway, and
the rapidity of the deceleration of the backward weak detonation, very high post-shock
temperature scaled activation energies would be required for the main reaction stage to
be thin compared to these scales, and hence for the assumptions of the asymptotics to be
realized. Furthermore, given the qualitative differences between the large activation energy
asymptotic and finite activation energy numerical solutions that appear even in the piston
case (where the backward wave, and its associated smaller scales, do not appear), one would
also expect that the numerical solutions for large, but finite activation energies would be
profoundly different to those identified in the high activation energy limit for the ignition
between a contact surface and shock wave.
Previous numerical simulations of the contact-shock initiation scenarios have been
per-formed for various finite activation energy chemical kinetic models [12, 14]. These
simu-lations indicate that ignition may indeed occur ahead of the contact surface, resulting in
reaction waves moving in both directions. However, due to the temperature sensitive nature
of the induction region, and to the very small scales which may be inherent in the solution
(as indicated by asymptotic analysis for one-step Arrhenius chemistry), very high
resolu-tion simularesolu-tions will be required to resolve the igniresolu-tion dynamics on these fine scales. In
Arrhenius reaction model, such that the ignition dynamics near the contact surface are, for
the first time, properly resolved. We examine how the evolution depends on the activation
energy, and compare and contrast these finite activation energy numerical results with the
large activation energy asymptotic predictions, as well as with the piston driven shock
initi-ation numerical solutions. The plan of the paper is as follows: in§II the governing equations
of the model are given; the asymptotic solutions are briefly described in §III; the results of
the numerical simulations are examined in §IV; §V contains the conclusions.
II. GOVERNING EQUATIONS
We consider the standard model system consisting of one irreversible reaction, A→B,
with an Arrhenius form of the reaction rate. In one-dimension, the dimensionless versions
of the governing equations are
∂ρ ∂t +u
∂ρ ∂x +ρ
∂u
∂x = 0, (1)
∂u ∂t +u
∂u ∂x +
1
ρ ∂p
∂x = 0, (2)
∂e ∂t +u
∂e ∂x−
p ρ2
"
∂ρ ∂t +u
∂ρ ∂x
#
= 0, (3)
∂λ ∂t +u
∂λ ∂x =
1
(γ−1)QE(1−λ) exp(E[1−1/T]), (4)
whereuis the fluid velocity,ρthe density (withV = 1/ρthe specific volume),pthe pressure,
e the internal energy per unit mass, λ the mass fraction of the product (so that λ = 0 in
the unburnt state and λ = 1 in the completely burnt state), E and Q the dimensionless
activation energy and heat of reaction, respectively, γ is the (constant) ratio of specific
heats in the case of gaseous explosives, and
T = p
ρ
defines the temperature. The distance,x, and material velocity,u, in Eqns. 1-4 are measured
with respect to a frame of reference to be specified below. We assume a polytropic equation
of state so that the internal energy is given by
e(ρ, p, λ) = p
Note that such an equation of state model using a polytropic index of γ ≈ 3 is also often
employed as a simple, qualitative model of condensed phase explosives [15]. Eqns. 1-5 are
supplemented by the standard Rankine-Hugoniot jumps conditions across shock waves and
contact discontinuities.
Here we consider the scenario of a shock with initial Mach number M0 propagating into
a reactive material whose initial state is denoted by a zero subscript, and moving away
from a contact discontinuity, behind which the density is initially ρB. The initial conditions
correspond to the time at which the shock and contact surface separate. At this time the
contact-shock complex is located at xl = 0, where an l superscript denotes the laboratory
frame (e.g. xl = 0 is the point at which the shocks collide in the shock merging problem, or is
the position of the diaphragm in the shock tube scenario). The initial state between the shock
and contact surface (and hence also the initial pressure and material velocity immediately
behind the contact surface) just after they separate is denoted by an s subscript. If there
was no heat release (i.e. the inert case), the solution would be self-similar corresponding to
a shock of constant speed moving away from the contact discontinuity, with a uniform state
in between and with the density immediately behind the contact surface remaining at ρB.
The (constant) speed at which the contact surface subsequently moves in the inert case is
given by the post-shock particle speed in the laboratory frame, ul
s, since a contact moves with the fluid.
In the corresponding reactive version, just after the shock and contact surface separate
att = 0+, the contact surface will still move away fromxl = 0 with speed uls. However, the
contact surface will subsequently decelerate due to the thermal expansion induced by the
exothermic reaction ahead of it, which is switched on by the passage of the shock. At very
early times on the ignition time scale the configuration will remain close to the self-similar
solution of the inert problem since the total heat released is then very small. Here we work
in the non-accelerating rest frame of the contact surface in the inert version of the problem,
or equivalently in the instantaneous rest frame of the contact at t = 0+ for the reactive
version. Hence in Eqns. 1-4, x=xl−ul
st denotes distance from the contact surface in the non-reactive solution. Similarly,u=ul−ul
s measures the fluid speed relative to the contact
surface’s speed in the non-reaction solution. Thus for the inert version, the contact surface
would remain stationary at x= 0, while in the reactive case it will be pushed backwards in
that, for infinite acoustic impedance of the contact surface, this is just the piston rest frame
used in [5].
In contrast to the inert version, in the reactive ignition between a contact surface and a
shock wave, the density just behind the contact surface will not remain at ρB, due to the
partial transmission through it of acoustic waves induced by the heat release in the induction
zone ahead of it.
Equations 1-5 have been non-dimensionalized using the following self-consistent scalings
ρ= ρ˜ ˜
ρs
, p= p˜ ˜
ps
, T = p
ρ =
˜
Rρ˜s ˜
ps ˜
Ts, u= ˜
ρs ˜
ps
!1/2
˜
u,
where a tilde denotes dimensional quantities. The dimensionless upstream, quiescent state
ahead of the shock (denoted by a zero subscript) is then given by the shock jump conditions
as
ρ0 =
γ−1
γ+ 1 + 2 (γ+ 1)M2
0
, p0 =
γ + 1
γ+ 1 + 2γ(M2 0 −1)
, T0 =p0/ρ0,
u0= (ρ0−1)M0
γp0
ρ0 !1/2
, λ0 = 0. (6)
Time is non-dimensionalized using the high activation energy, spatially homogeneous
con-stant volume explosion time corresponding to the initial shocked state[16], i.e.
t= ˜˜t
texp
, ˜texp =
˜
CVT˜s2 ˜
kE˜Q˜ exp
˜ E ˜ Ts ! ,
where ˜k is the dimensional rate multiplier and ˜CV is the specific heat at constant volume.
Distance is then scaled as
x= ρ˜s ˜
ps
!1/2
˜
x
˜
texp
,
characteristic of the distance an acoustic wave disturbance would travel in the shocked
material during time t = 1 (˜t = ˜texp). The dimensionless initial value of the density just
behind the contact surface is thenρB = ˜ρB/ρ˜s, and the initial acoustic impedance, as defined
in [6], of the material here is α0 = √ρB. The limit α0 → ∞ corresponds to the constant
velocity piston case considered previously.
In this paper, when unspecified, the parameter set considered isγ = 1.4,Q= 4,M0 = 1.5,
since these are the values considered in detail in both the asymptotic studies of the
contact-shock ignition problem in [2, 6] and in the finite activation energy numerical simulations of
the present results. However, we also briefly consider a case with γ = 3, in order to examine
how the details of the evolution changes when a simple condensed phase equation of state
model is used.
III. LARGE ACTIVATION ENERGY ASYMPTOTICS
In this section we briefly describe and examine the solutions obtained for the
contact-shock ignition problem in the large activation energy asymptotic limit,E → ∞or= 1/E →
0, where is the inverse activation energy. In this limit the reaction history of a particle can
be split into two main stages: an induction stage where the state remains within O() of the
initial state for an O(1) timescale, followed by a main reaction or ignition stage where the
burning proceeds to completion on an timescale which is exponentially short compared to the
induction time [16]. Although the state changes by only O() amounts during the induction
phase, it is this weak reactive gas-dynamical evolution which determines the path of the
supersonic reaction wave that emerges from the first point of ignition. The leading-order
structure of the reaction wave itself is determined by the ignition stage [2].
TheO() induction stage solution is obtained via the expansions
T = 1 +T1+O(2), p= 1 +p1+O(2), ρ= 1 +ρ1+O(2),
u=u1+O(2), λ= 1 +λ1+O(2),
in the region between the contact surface and the shock. Inserting into Eqns. 1-5, one
obtains Clarke’s leading order induction equations [17], which in the scales used here are
∂p1
∂t +γ ∂u1
∂x = exp(T1), ∂u1
∂t + ∂p1
∂x = 0,
∂T1
∂t −
(γ−1)
γ
∂p1
∂t =
1
γ exp(T1), ρ1 =p1−T1. (7)
Equations 7 admit solutions which have local finite-time blow-ups of T1 and p1 (“thermal
runaway”). These events signal the end of the induction stage for a particle and the onset of
the exponentially short main reaction stage [1]. The time at which thermal runaway occurs
is termed the induction time.
The initial conditions for Eqns. 7 correspond to the time at which the shock and contact
problem or the time the diaphragm bursts in the shock tube problem). For the problem of
ignition between a contact surface and a shock, Eqns. 7 are subject to the linearized shock
jump conditions at the shock front [6], together with the condition at the contact surface
ucontact =−
pcontact
α0
,
which is derived from continuity of pressure and velocity across the contact surface together
with a radiation condition [6]. Note that for the piston case, corresponding to the limit
α0 → ∞, this reduces to the condition u = 0. For an analysis correct to O(), these
boundary conditions are applied on the leading order contact surface (x = 0) and shock
(x=M0√γp0ρ0t) paths [6].
Equations 7 are solved using the parametric integration method described in [2]. Here
complete asymptotic solutions are obtained for a few cases which have not been characterized
before. Only the solution for the case α0 = 1.5 was given in [2]. Also while Parkins [7]
calculated some weak detonation paths using parametric variable integration described in
Short & Dold [2], the weak detonation speeds (which are necessary for calculating the point
of transition to strong detonation, see below) were not shown. Furthermore, much higher
resolution is employed than was attainable for the calculations presented in [2, 7], an essential
element to describing the path of the backward facing weak detonation.
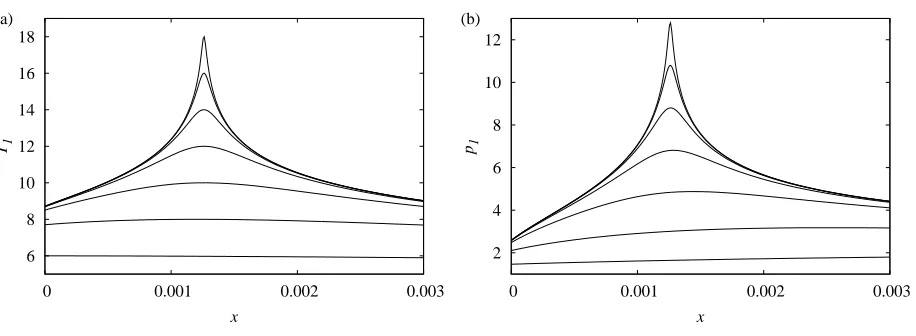
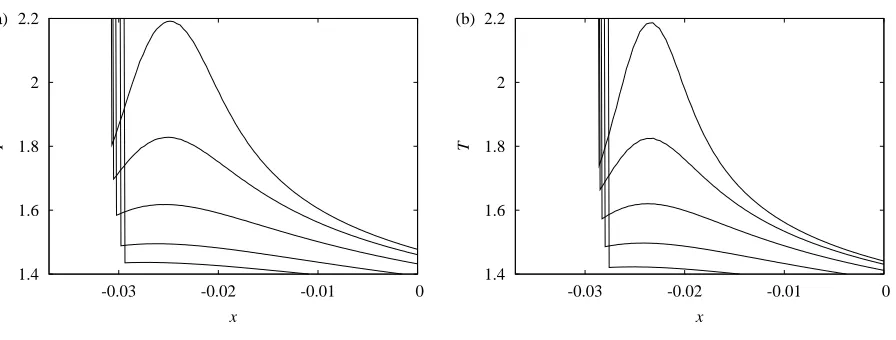
Figure 1 shows the evolution of the temperature and pressure during the latter part of
the induction stage for the gas phase model, with γ = 1.4, in the case α0 = 0.5 (chosen
because lowα0 exemplifies the difference between the contact-shock problem from the piston
driven case, cf [6]). During the early stages of rapid temperature growth, the temperature
remains monotonically increasing as one moves back from the shock to the contact surface
(particles nearer the contact surface have been shocked, and hence reacting and releasing
heat, for the longest). However, the temperature maximum moves off the contact surface
att = 1.31928, which is only slightly before the initial blow-up time is reached. The reason
for this is as follows. Throughout the induction stage, the gradient in fluid velocity, ∂u/∂x,
is positive and largest at the contact surface (the largest negative value of the fluid velocity
occurs at the contact surface) [2]. As the induction time is approached and the rate of heat
release begins to accelerate in the region ahead of the contact surface, the contact surface
is driven backwards at an increasing rate and hence the fluid velocity gradient (or “rate of
local sink of thermal energy [18], and since it is largest at the contact surface, a competition
between the rate of expansion and heat release occurs there, causing the temperature to
begin to rise more rapidly in the interior than at the contact surface. Figure 1(a) shows
that subsequently the temperature maximum continues to grow rapidly in an increasingly
narrow boundary layer [6], indicating the onset of thermal runaway here. For α0 = 0.5,
thermal runaway first occurs at time t0 = 1.3203 at a distance of x = 0.00125 from the
contact surface (cf the values of t0 = 1.186, x= 0 for the piston case α0 → ∞).
Meanwhile, Fig. 1(b) shows that even during the initial stages, the pressure is not
monotonically increasing with distance behind the shock as occurs for the piston case, but
instead has an internal maximum, due to acoustic pressure wave leakage at the contact
surface. In fact for finiteα0, an early time analysis shows that initially the pressuredecreases
linearly with distance behind the shock, with gradient proportional toα−1
0 [6]. As runaway
is approached the pressure maximum moves backward, and a finite time blow-up also occurs
inp1 at the same position as the temperature runaway [6]. Note, however, that bothu1 and
ρ1 remain bounded and monotonic [6].
As one moves away from this point of first runaway in either direction, particles will
sequentially ignite at later times as they reach their induction times in turn. Thus two loci
of thermal runaway times emerge from the initial point of ignition. It can be shown that the
thermal runaway paths must move supersonically [1], through an essentially frozen induction
region ahead of it. Thus Eqns. 7 can continue to be integrated in the regions ahead (in
the direction of propagation) of the thermal runway loci and hence their paths determined.
Since thermal runaway signals the onset of the ignition stage, one can associate a thermal
runaway locus with the path of a vigorous reaction wave involving O(1) variations in the
material state through the wave. As the main reaction time and lengths are exponentially
rapid in the asymptotic limit due to the Arrhenius form of the reaction rate, this wave will
be quasi-steady to leading order, i.e. the timescale for a particle to traverse the reaction
wave is much shorter than the timescale for changes in the wave’s speed. In fact, it can
be shown that the reaction wave takes the form of a quasi-steady weak detonation, i.e. a
shockless compression wave which is supersonic throughout in the wave’s rest frame [1, 2].
Consequently, the thermal runaway loci represent to leading order the paths of two weak
detonations arising from the first point of thermal runaway. It is emphasized that in the
backward weak detonations move away from this point of initial runaway.
Note that here we do not describe the asymptotic structure of an initial rapid ignition
transient: this is not explicitly needed for a description of the weak detonation path or
struc-ture [2], which is the the concern of the present paper. However, for the large activation
limit, the structure of the initial ignition point could be described by the standard re-scaling
analysis in [19]. Indeed, both Parkins [7] and Bauwens [9] have described the hot-spot
struc-ture for θ→ ∞and (γ−1)→0. One would not expect qualitatively different results to the
hot-spot structure when the second (Newtonian) limit approximation is dropped. However,
this transient is not the concern of the present paper, which is focused on description of the
weak detonation behaviour.
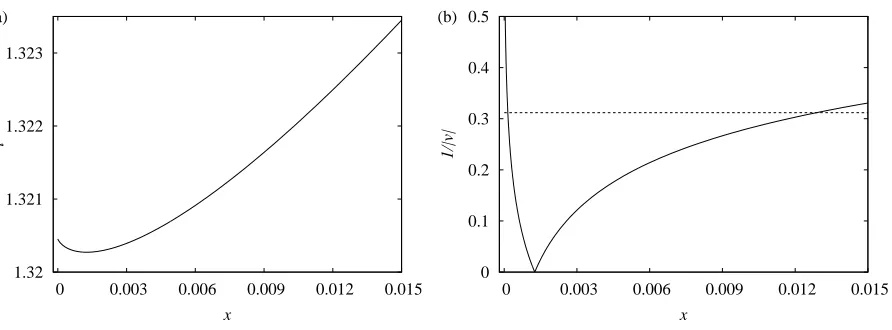
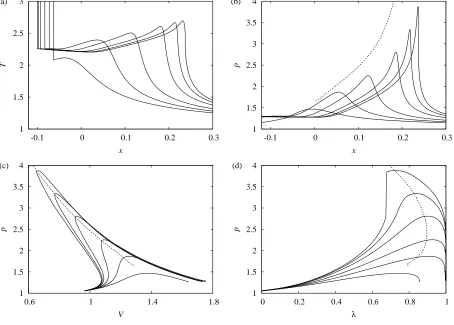
Figure 2 shows the weak detonation paths in the (x, t) plane for the case α0 = 0.5,
as well as the magnitude of the inverse of the weak detonation speeds, |v|−1. As can be
seen, the forward and backward moving weak detonations emerge from the point of first
thermal runaway at x = 0.00125, t = t0 = 1.3203, with initially infinite speeds (v−1 = 0).
However, the waves then decelerate rapidly as they move away. While the time scale for
deceleration of the forward moving wave speed by an O(1) amount is still very short, it
decelerates more slowly than in the corresponding piston driven case (α0 → ∞). On the
other hand, the deceleration of the backward wave is extremely rapid. It can be shown that
when, α0 ≤1, this backward wave’s speed asymptotes to √γ (i.e. sonic) in the asymptotic
or Newtonian limitγ →1 as it approaches the contact surface [7]. Nevertheless, despite this
rapid deceleration, the wave reaches the contact surface at t = t0 + 1.82×10⁻⁴, i.e. very
soon after its formation.
A weak detonation only remains a valid structure whilst its speed remains above the
Chapman-Jouguet (CJ) speed. Once the wave’s speed drops to the CJ speed, DCJ, the flow
in the reaction burn-out region of the wave becomes sonic [1]. In the asymptotic scenario,
this signals the birth of a secondary shock very near the rear of the wave, which rapidly
accelerates through the remaining part of the weak detonation reaction zone ahead, trailing
a fast-flame behind which couples with the secondary shock to form a strong detonation
[1]. The transition from weak to strong detonation is exponentially rapid, so that the
detonation formation. In the scalings used here, the CJ speed is given by
D2
CJ = (γ2−1)Q+γ+ h
(γ2
−1)Q((γ2
−1)Q+ 2γ)i1/2. (8)
Note that the weak detonation path is independent of Q since it does not appear in Eqns.
7, but it does affect where the transition to strong detonation occurs. Equation 8 shows
that the transition occurs earlier (where the weak detonation speed is higher) for larger Q.
The CJ speed forQ= 4 is also shown in Fig. 2(b). For this value ofQ, the transition point
of the forward moving wave is at x = 0.0128. Again, while this is still a small distance,
due to the slower deceleration of the forward wave, it is significantly larger than for the
piston driven case where the transition occurs at x = 0.002 [5]. The transition point for
the backward moving weak detonation, however, is 1.5×10⁻⁴, i.e. the transition to strong
detonation occurs virtually at the contact surface. The transition of the backwards wave
occurs first, and very soon after ignition, at t =t0+ 1.1×10⁻⁴, while the transition of the
forward moving wave follows at t=t0+ 2.5×10⁻³.
As α0 increases, the thermal runaway time decreases (and approaches that in the piston
driven case), but the length scales characteristic of the thermal runaway region also rapidly
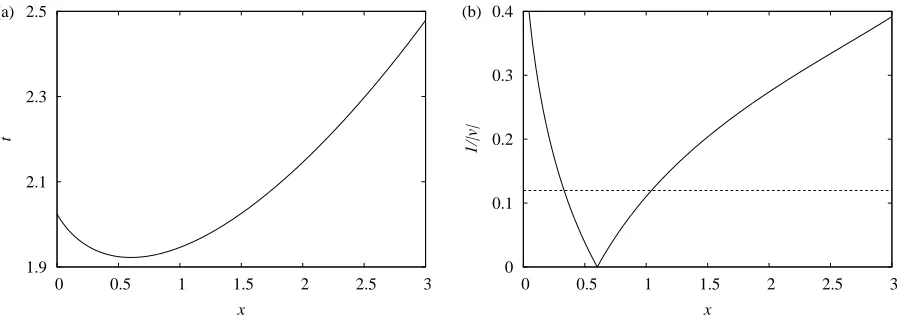
decrease. Figure 3 shows the weak detonation paths and speeds for the caseα0 = 1. Thermal
runaway first occurs at timet0 = 1.2840, and atx= 5.48×10⁻⁴, i.e. about half the distance
closer to the contact surface as for theα0 = 0.5 case. WhenQ= 4 andα0 = 1, the transition
to strong detonation of the backwards moving weak detonation wave occurs earlier and even
closer to the contact surface, at t = t0 + 4.7×10⁻⁵, x = 2.6×10⁻⁵. The forward weak
detonation wave also transitions earlier than in the α0 = 0.5 case, at t = t0 + 1.9×10⁻³,
x= 0.0093.
For an even larger value of α0 = 2, thermal runaway is found to occur at t0 = 1.2396,
x = 1.61×10⁻⁴, while the transition points occur at t =t
0+ 1.06×10⁻⁵, x = 1.1×10⁻⁶
and at t = t0 + 1.4× 10⁻³, x = 0.0063 for the backward and forward weak detonation
waves, respectively. However, an important difference occurs when α0 > 1, in that the
backward weak detonation no longer slows to the sound speed at the contact surface [2],
hence transition to strong detonation is not guaranteed in these cases. For α0 = 2,v = 3.16
at the contact surface, which corresponds to 0.99DCJ when Q = 4. For slightly smaller
values ofQ, the backwards weak detonation wave would not transition to strong detonation
Since the weak detonation decelerates extremely rapidly in these asymptotic solutions,
the post-shock temperature scaled activation energy would need to be very high in order for
the main reaction zone to be sufficiently thin such that the quasi-steady assumption in the
asymptotic theory holds. Thus as in the piston case [4, 5], we expect that for moderately
large finite activation energies the solutions will be qualitatively different to the asymptotic
predictions, since the main reaction zone times will not short compared to the asymptotic
wave deceleration time, and hence unsteadiness needs to be considered [5]. Furthermore,
since the length and time-scales involved in the asymptotic become shorter as α0 increases,
larger activation energies can be expected to be required for the quasi-steady assumption to
become valid.
Sharpe & Short [5] also described an interesting difference for the piston-shock case when
a high polytropic index, more representative of condensed phase (liquid or solid) explosives
[15] is used in the equation of state. In this case, the asymptotic evolution to detonation
was found to be qualitatively different to those corresponding to gaseous values of γ. The
weak detonation decelerated comparatively slowly, such that the transition point occurred
at a distance of the order of unity from the piston face. This indicated that the
quasi-steady assumption for the weak detonation should hold even for moderately large activation
energies. Indeed finite E simulations showed that the asymptotic predictions were actually
quantitatively good even for moderate E, in stark contrast to the gaseous equation of state
cases.
Given this difference it is worth briefly considering how the induction phase and weak
detonation behaves for a high polytropic index in the scenario of ignition between a contact
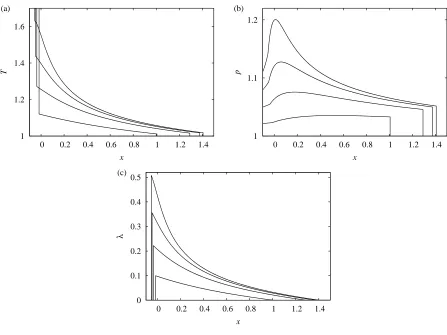
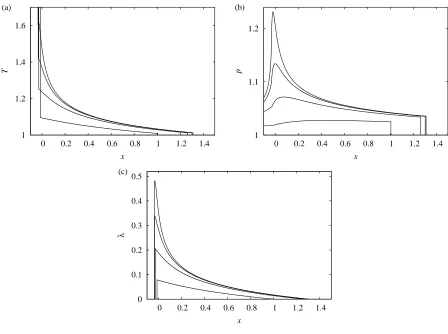
surface and a shock in the limit of large activation energy. Figure 4 shows the induction
stage solution when γ = 3 and α0 = 0.5. In this case, the temperature maximum moves
off the contact surface comparatively much earlier, and thermal runaway first occurs at a
relatively large distance from the contact surface. Ignition occurs at t = t0 = 1.9223 and
x= 0.6018, i.e. about three orders of magnitude more distant from the contact surface than
for the γ = 1.4 case considered above.
The reasons for the large differences between the model condensed phase and gas phase
cases can be understood by considering the temperature equation in Eqns. 7. In the limit
γ → 1, the evolution of T1 decouples from the pressure evolution to leading order [7], and
temperature induced by the heat release of the reaction, which is switched on by the passage
of the shock. The rise in temperature is initially greatest at the contact surface where the
material has been heated the longest. Forγ−1 =O(1), however, the temperature evolution
is also strongly coupled to the pressure evolution through the ((γ−1)/γ)∂p1/∂t material
compressibility term. As for the gaseous γ cases considered above, theγ = 3 solution has an
internal pressure maximum due to the acoustic leakage at the contact surface. The pressure
maximum initially occurs at the shock, but grows and moves backward towards the contact
surface. For γ−1 =O(1), localized increases in temperature occur not only via local heat
release (which is initially largest at the contact surface where the material has been shocked
the longest), but also due to localized increases in pressure, which are largest around the
internal pressure maximum. Thus the growth of pressure internally has a much stronger
role in determining the temperature profiles, and hence the first point of thermal runaway,
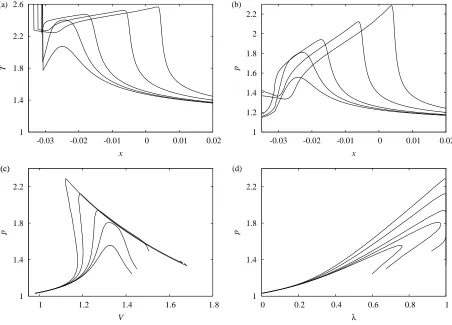
whenγ = 3 than for γ = 1.4 . Figure 5 shows the weak detonation paths and speeds for the
γ = 3 case. The forward moving weak detonation decelerates much more slowly than for the
gaseous equation of state cases, as was also found for the piston scenario [5]. ForQ= 4, the
forward wave transitions to strong detonation at x= 1.0426, t= 1.9508 whenα0 = 0.5, i.e.
transition occurs a distance of 0.44 from the point of first thermal runaway, which is over
twice the transition distance of 0.20 in the α0 → ∞case [5] when γ = 3. Figure 5(b) shows
that the backward wave also decelerates relatively slowly: transition occurs at x = 0.3320,
t = 1.9371 when Q = 4. The backward wave transitions first, at a distance of 0.27 from
the point of first ignition. Thus, in contrast to the gaseous case, due to the magnified scales
involved in the asymptotic solution for γ = 3 (e.g. the relatively slow evolution timescale
of the weak detonations), one may expect that the quasi-steady structure will hold for the
backward wave also even for moderate E. This prediction is also examined via the finite
activation energy simulations in §IV.
Note that the results obtained by using a more realistic equation of state,e(p, ρ), for
con-densed phase explosives should not be qualitatively different to those of the large polytropic
index solutions. This is because the linearized equations resulting from a general equation
of state are still of the same form as Eqns. 7, but with the polytropic index γ replaced
by the constant c2, where c is the dimensionless sound speed in the initial shocked state.
Note that under our scalings, c2 is, by definition, the value of adiabatic γ at the initial
shock state. Hence c2
and thus the solutions will be qualitatively similar to the large polytropic index results. If
changes in the thermal equation of state,T(p, ρ), are also taken into account, there will then
be a difference in how temperature feeds into acoustic fluctuations. However, the resulting
linearized equations are still of the same form as Eqns. 7.
IV. NUMERICAL SIMULATIONS FOR FINITE ACTIVATION ENERGY
In order to obtain the solutions for finite E, Eqns. 1-5 are solved numerically in the
AMRITA computational environment [20, 21]. Adaptive mesh refinement is employed as described below. For accurate results it is important that the contact discontinuity is not
smeared out by numerical diffusion such that its effective length becomes comparable to any
other physical length-scales of the solution, as can readily occur with standard Eulerian shock
capturing schemes [22]. Since potentially very short length-scales may appear in the ignition
evolution for the current problem based on the asymptotic results in§III, the contact surface
needs to be treated essentially as a discontinuity in the numerical solutions. To achieve this
we utilize the mass-weighted Lagrangian second-order Godunov solver within the general
equation of state AMRITA package described in [23]. The contact surface is then treated as a discontinuous material interface. However, for purposes of displaying the results, all
solutions have been converted back into the more intuitive Eulerian (x, t) co-ordinates so as
to clarify, for example, the movement of the contact surface, etc.
Our intention is to examine the generic problem of ignition between a contact surface
and a shock, rather than a specific initial value problem which produces this configuration.
Thus in the simulations, as in the asymptotic analysis, the initial conditions correspond
to the time the shock and contact surface separate, i.e. to that of an initially stationary
contact surface located at x = 0 with a shock of initial Mach number M0 moving away
from it (x > 0) into a state ahead given by Eqns. 6. Behind the contact surface the initial
conditions consist of the dimensionless constant state withp= 1,u= 0 andρ=ρB (so that
α0 = √ρB). The left boundary of the numerical domain is placed sufficiently far behind
the contact surface, such that no disturbances can reach it during the calculation period
and hence is an inactive boundary. Similarly the right boundary of the domain is placed
sufficiently far ahead that the initiating shock does not reach it.
tube scenarios, a backwards propagating expansion wave can also be produced behind the
contact surface, which propagates away from the contact surface leaving behind a uniform
state (in the inert case) between them where ρ=ρB, e.g. [6]. Since the rarefaction travels
at the local sound speed, any acoustic disturbances originating in the reactively evolving
induction zone ahead of the contact surface, which are subsequently transmitted into the
region behind it, cannot catch up with this expansion wave. Thus the presence of the
expansion will not affect our domain of interest and is not required as part of the calculation
(note that this fact also underlies the formulation of the radiation condition at the contact
surface in the large activation energy asymptotic solution [6]).
In the present simulations, the region behind the contact surface is taken to be inert. In
the shock merging problem, for example, where it is guaranteed that α0 > 1, the material
behind the contact surface would be reactive. In such problems though, it is assumed that
the temperature behind the contact surface resulting from the shock merging is sufficiently
low (based on a given E), that the characteristic ignition time is long (otherwise significant
reaction would have occurred before the shock merging occurs). When the contact-shock
complex is formed, the temperature behind the contact surface is lower than that behind
the second shock before the merging, while both of these temperatures are lower than that
between the contact surface and the shock. Consequently, for a sufficiently large E or α0,
to a first approximation, the reactivity of the material behind the contact surface can be
ignored on the time-scale of the induction time in the region between contact surface and
shock [6].
Even for the one-dimensional calculations, dynamical adaptive gridding is employed due
to the large disparity between the induction length and time scales and those of the main
reaction stage (these become exponentially disparate as the activation energy is increased).
Resolution studies were performed to ensure that the solutions presented here are converged.
The coarsest (base) grid, which covers the whole domain, is chosen to have a mesh spacing
of 1000 points per unit length based on the initial shocked state. Dynamic grid refinement
levels are then defined in regions when and where they are required. The Lagrangian mesh
spacing is reduced by a factor of four on each subsequent grid level. The induction region
between the contact surface (inclusive) and the shock is always covered by the first refinement
level. Subsequent to the end of the induction stage, a finer mesh spacing may be necessary
pressure gradients, up to a grid refinement level N, say, which depends on the activation
energy. The most stringent condition on the resolution is to resolve the secondary shock in
thepλplane (see below) subsequent to its formation, i.e. to ensure there is no burning within
the captured secondary shock structure. More refinement grids (larger N) are required as
the activation energy is increased. The initiating shock is always resolved on the finest grid
level defined to ensure that this captured shock remains appropriately narrow compared to
any physical length-scale of the problem. Also, in the initial conditions the shock is placed
one grid point of this finest grid level ahead of the contact surface. To ensure the
length-scales associated with the numerical shock are small compared to any of the physical length-scales,
a minimum of least five refinement levels are defined.
AsE increases, it rapidly becomes difficult to resolve (in both space and time) the main
reaction stage, and the problem becomes very stiff, due to the exponential shortening of the
characteristic main reaction length and time scales (see the discussion in [5]). Furthermore,
asE increases, local induction times become sensitive to decreasingly small perturbations in
the temperature history. As = 1/E →0, O() perturbations in the temperature produce
O(1) changes in the induction times [18]. Hence as E increases, even very small amounts
of numerical noise can be amplified during the induction stage, rendering it very difficult to
obtain highly accurate solutions. Analogously, in experiments, when the temperature
sensi-tivity of the fuel becomes sufficiently large, ignition no longer occurs along a one-dimensional
locus, but thermal runaways occur at discrete isolated points (resulting in so called ‘mild
ig-nition’) due to the amplification of small inhomogeneities in the fuel or geometry [24], hence
producing a three-dimensional problem. For the above numerical reasons, the simulations
of the full evolution are hence limited to cases E ≤ 20 as in [5] for the piston driven case,
while the initial stages of the evolution are also consider for somewhat larger values of E
in order to demonstrate the trends as E increases. Indeed, the purpose of the simulations
is precisely to contrast these moderately large finite activation energy solutions with the
asymptotic prediction, and not an attempt to recover the asymptotics solutions.
At this point, it is worth comparing the values of E used in the simulations with
rep-resentative values for fuels which may be described, at least to a first approximation, by a
one-step Arrhenius rate, i.e. those for which the chemical heat release is characterised by
a weak heat release induction zone, terminated by a much more rapid thermal explosion.
hydrogen-oxygen-diluent mixtures at initial temperatures below the chain-branching crossover
tem-perature, where chain-recombination is dominant over chain-branching [25, 26]. Note that
an analysis of constant volume explosions in a generic three-step chain-branching model
(which includes chain-initiation, -branching and -recombination steps) shows that, for
ini-tial temperatures sufficiently below the crossover temperature, the heat release rate and
hence temperature evolution does indeed effectively reduce to that of an overall one-step
model [27, 28]. Furthermore, the one-step model then also recovers the shock ignition
dy-namics of the chain-branching model when the initial shock temperature is below that of
the cross-over temperature [28].
Note that, for a given mixture, the effective (shock temperature scaled) activation energy,
E, will depend intimately on the initial shock strength. Values of E at different initial
temperatures (> 1000K) and pressures were found by considering changes of the constant
volume explosion induction time with temperature [25], givingE ∼15 for methane-oxygen,
∼ 15−25 for ethane-oxygen, and ∼ 20−25 for hydrogen-oxygen-diluent mixtures in the region below the cross-over temperature. The induction time data given in [26] also indicates
that an upper bound for E is 20 for methane-oxygen, 18 for propane-oxygen, and 25 for
hydrogen-air, for initial temperatures greater than ∼1000K.
In order to interpret the results of the simulations we use the diagnostic methods described
in [29], which involve plotting the solutions in the pressure-specific volume, pV, and pressure
concentration, pλ, planes. These pV and pλ diagrams allow one to identify components of
quasi-steady reaction waves, induction zones, unsteady combustion zones and burnt regions
in the solution, as well as where these various features occur [4, 5, 29].
A. Results
We consider first the caseα0 = 0.5. Recall that for this value ofα0, in the high activation
energy asymptotic limit, thermal runaway occurs first at x= 0.00125 and t= 1.3203, while
the backward and forward weak detonation waves transition to strong detonation at 9×10⁻⁵
and x= 0.013, respectively (Fig. 2).
Figure 6 shows the initial evolution during the induction phase for E = 15. For the
finite activation energy cases, we will define the induction phase as lasting until the time
and reaction progress variable profiles remain monotonically increasing as one moves back
from the shock to the contact surface, as in the finite activation energy piston driven shock
scenario. Note, however, that the contact surface has been pushed backwards (relative to
its position at any given time in the corresponding non-reactive case) due to the reaction
induced thermal expansion ahead of it. The temperature maximum remains at the contact
surface, even up to the point when half the fuel is consumed there. This is in contrast to the
asymptotic prediction that rapid burning first occurs a small distance ahead of the contact
surface.
Figure 7 shows the later time evolution for E = 15. At the the first time shown,
cor-responding to t = 1.693, the temperature maximum has now moved ahead of the contact
surface. The pressure profiles also indicate that the pressure maximum has begun to move
forward again. While the temperature maximum does move into the interior region between
the contact surface and the shock for E = 15, it only does so once the fuel is largely
con-sumed there, specifically λ= 0.85 in the region near the temperature maximum at the time
it moves off the contact surface. This is in contrast to the movement of the temperature
maximum off the contact surface during the O() induction phase evolution that occurs in
the large activation energy limit. Indeed, the progression of the temperature maximum away
from the contact surface only occurs forE = 15 since the rate of heat release is diminishing
at the contact surface due to the near total consumption of fuel there.
At the second time shown in Fig. 7, the fuel near the contact surface has fully depleted,
and the temperature and pressure maxima have moved further forward towards the shock,
with the location of the maximum in the temperature beginning to catch up with that
in the pressure. Subsequent profiles show the emergence and propagation of a reaction
wave structure. This is clearly shown in the pV diagrams (Fig. 7c), which reveal that as
one moves back from the shock various different reaction regimes begin to arise. Initially
following the shock is a region which has positive slope in the pV plane, representing an
unsteady induction region. This is followed by a region through which pressure increases
along an approximately straight line in the pV plane with negative slope. This region of the
solution thus constitutes part of a quasi-steady, supersonic weak detonation [29]. As was
also found in the finite activation energy numerical simulations of the piston-shock scenario
[5], this wave-like behaviour does not begin at the point where reactions first became rapid.
of the pV trajectories inside the reaction zone complex only become negative between the
second and third times (t= 1.715 and t= 1.737) shown in Fig. 7(c). The quasi-steady weak
detonation regime thus emerges in the regionx >0 in Fig. 7(b), at which time the contact is
atx=−0.08. This is in contrast to the large activation energy asymptotic solution in both
cases, where weak detonations effectively originate at the point of first thermal runaway
(e.g. at the piston face (x= 0) in the limitα0 → ∞).
As time progresses, the magnitude of the slope corresponding to the weak detonation
regime decreases in Fig. 7, showing that the weak detonation part of the reaction structure
is decelerating [29]. The weak detonation regime is in turn followed by highly curved, and
hence highly unsteady [29], reaction regime in the pV plane. The final part of the reaction
zone lies within a second region of negative slope through which the pressure decreases,
which thus constitutes a subsonic fast-flame regime[29]. An expansion wave in the fully
burnt material then connects the rear of the reaction zone to the contact surface (Fig.
7a). The reaction wave complex moves towards the shock. A backward (toward the contact
surface) propagating reaction complex does not form, in contrast to the asymptotic solutions
described in §III.
Thepλtrajectories in Fig. 7(d) show that at the beginning of the reaction wave complex
propagation stage, the pressure maximum occurs near the fully burnt state (λ≈0.95 there),
so that the bulk of the reaction wave comprises of the weak detonation regime. As the
pressure maximum begins to move forward through the reaction zone complex, both the
unsteady and fast-flame parts of the wave structure become more pronounced. The pressure
profile ahead of the maximum also begins to rapidly steepen. This steepening results in the
formation of a weak interior shock, which occurs att= 1.775 and can be observed at the last
time shown in Fig. 7(d). The secondary shock forms at x = 0.23, in poor agreement with
the asymptotic prediction of the point of slowing to the CJ detonation speed,x= 0.013, for
the forward moving weak detonation wave.
The above evolution for α0 = 0.5, E = 15, involving the emergence of a single, forward
moving, unsteady reaction wave complex, is qualitatively similar to the piston driven shock
initiation evolution with the same activation energy described in [5]. For a more direct
comparison, the loci of the shock pressure maximum from the piston driven case withE = 15
[5] are also shown in Fig. 7(b-d). Figure 7(b) shows that spatially the growth of the pressure
and pλ planes, however, the two cases are similar. The pressure maximum for α0 = 0.5 lies
only slightly behind that of the piston case, indicating that both cases have similar extents
of a quasi-steady weak detonation structure in the pλ plane [5]. The point of formation of
the secondary shock also occurs at almost the same degree of reaction within the wave, cf
[5]. The evolution forE= 15 subsequent to that shown in figure 7, including the mechanism
of strong detonation formation, is also similar to that for the piston case when E = 15 as
described in [5].
In order to examine how the solution depends on the activation energy, its value was
increased to E = 20, keeping α0 = 0.5. The evolution for this case is shown in Figs. 8 to
10. Figure 8 shows the induction stage evolution (up to the point where λ approaches 0.5
at the contact surface). The initial evolution is similar to that for E= 15 above (cf Fig. 6),
except now the region of initial rapid temperature rise occurs in a narrower layer close to
the contact surface.
The main difference with the E = 15 case considered above is that a definite interior
local maximum in temperature forms, at an earlier stage. This is revealed in Fig. 9, which
shows a zoomed-in view of the spatial profiles near the contact surface, between times 1.555
and 1.562. Figure 9(a) and (c) show that the temperature maximum begins to move ahead
of the contact surface when λ ≈ 0.4 there, as compared to λ = 0.85 for the E = 15 case.
The temperature maximum also remains close to the contact surface, and becomes more
pronounced, during the initial self-acceleration of the temperature rise. For example, at
t = 1.562 in Fig. 9, the temperature maximum occurs at x = −0.027 as compared to
the contact surface location of x=−0.036. The pressure maximum (located atx=−0.026
whent = 1.562) can also be seen to occur close to where the temperature takes its maximum.
The evolution forE = 20 is thus in better agreement with the prediction of the asymptotics
than that for E = 15. Note from Fig. 9 that, as the temperature begins to move ahead of
the contact surface, λ initially remains monotonic, but subsequently an interior maximum
in λ also forms, which lags very slightly behind that in the temperature.
Figure 10 shows the later time evolution. The interior maxima in p and λ result in a
“hook” in the pλ diagrams (Fig. 10d) at the first two times shown. Thus at these times
there exists a compressive (in the direction of increasing reaction progress) region between
the contact surface and the pressure maximum. This region hence has negative slope in
at the temperature maximum are not substantially different at these times, so that the
material in this entire region rapidly burns out subsequent to the time whereλ first reaches
unity. Consequently this compressive region quickly disappears from the pλ plane (e.g.
by the third time shown in Fig. 10d). In contrast, we recall that in the large activation
energy asymptotic scenario, the material remains virtually frozen at the contact surface
while runaway to complete reaction occurs at the temperature maximum. Thus, despite the
appearance of the internal maximum, the reactive evolution of the region between the contact
surface and the temperature maximum forE = 20 is again different to that predicted by the
large activation energy scenario. ThepV diagrams in Fig. 10(c) show that a forward moving
weak detonation only begins to form (when the slope of thepV trajectories corresponding to
the region ahead of the pressure maximum becoming negative) subsequent to the complete
burnout of the fuel between the contact surface and the temperature maximum. Again, a
backwards moving reaction wave does not emerge.
ThepV andpλdiagrams in Fig. 10(c,d) show that subsequently almost the entire reaction
zone complex consists of a weak detonation, with the pressure maximum occurring close to
λ = 1. Thus, as in the piston driven case [5], the quasi-steady weak detonation structure
is more readily apparent throughout the reaction zone when E = 20 than when E = 15.
This occurs due to the shortening of the main reaction zone length and time scales relative
to the induction zone scales. For comparison, the loci of the pressure maximum for the
corresponding piston case is also shown in Fig. 10. The pV and pλ evolutions are again in
quantitative agreement with the piston driven case, e.g. the locus of the pressure maximum
for α0 = 0.5 lies only slightly ahead of that for α0 → ∞ in the pλ plane. The secondary
shock forms at x = 0.056, corresponding to a distance of 0.102 from the contact surface
which is at x=−0.046 at the time of the interior shock formation. Compare this with the
shock formation distance from the piston face of 0.037 in the piston driven shock solution
forE = 20 [5]. Hence, when E = 20, as for theE = 15 case, the evolution to detonation for
the contact-shock problem is similar to that in the piston driven case.
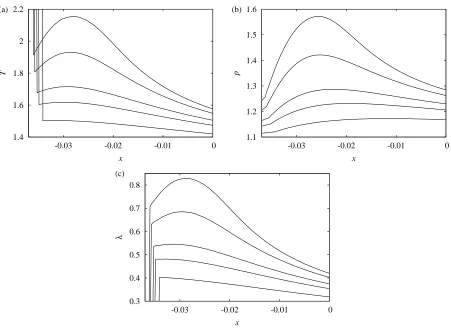
Figure 11 shows the formation of the internal temperature maximum for E = 22 and
E = 23, which further illustrates the trends as the activation energy is increased. The
temperature maximum moves off the contact surface earlier, at a smaller value of λ, as E
increases, while the position of the maximum during the initial self-accelerating temperature
more pronounced, in that differences between the temperatures at the contact surface and
at the maximum become more disparate as E increases. The distances from the contact
surface to the maximum at the last times shown in figure 11(a) and (b) are 0.006 and 0.005
for E = 22 and E = 23, respectively.
Figure 12 shows a subsequent stage of the evolution for E = 22. Initially, the
compres-sive reaction region between the contact surface and the pressure maximum is much more
pronounced in both the pV and pλ diagrams than for E = 20. It is seen that this whole
region still reacts rapidly, and hence the state at the contact surface again does not remain
frozen during the first interior ignition event, as occurs in the asymptotic solution. However,
the reaction rates at the temperature maximum and at the contact surface are now more
disparate (note the much larger change in the maximum values ofpand λover the first two
times shown in Fig. 12d as compared to the change in their values at the contact surface).
Hence a partially reacted region near the contact surface remains in evidence while the
ma-terial immediately around the temperature maximum burns out. Nevertheless, Fig. 12(c)
shows that the material at the contact surface burns out before the forward moving weak
detonation forms (at fourth time shown in Fig. 12).
Figures 13 and 14 shows the effect ofα0 for a fixed activation energy of E = 15. When
α0 = 1 (Fig. 13) the ignition time is less than that for the α0 = 0.5 case, in agreement with
the asymptotic prediction that the thermal runaway time is longer for lower α0. However,
the spatial evolution between the contact surface and the shock wave is still similar to that
shown in Fig. 7(a,b) for α0 = 0.5. The pressure peak grows slightly faster for the larger
value of α0, and the deceleration of the contact surface is less due to the larger acoustic
impedance of the material behind it. The solution shown in Fig. 14, which corresponds
to α0 = 2, reveals that these trends continue as α0 is increased further. For example, the
timing of events further approach those of the piston case. Figures 13 and 14 together with
the piston driven shock results in [5] show that, in contrast to the asymptotic solutions
examined in §III, there is only a weak dependence of the evolution sequence on α0 as it is
varies from low values to infinity when E = 15. The pV and pλ evolutions are not shown
for α0 = 1 and 2 as they are quantitatively similar to those for the α0 = 0.5 case shown in
Fig. 7(c,d).
For the final case, we briefly consider a finite activation energy solution for the simple
asymptotic solution revealed that a high polytropic index produces a qualitative change
in the evolution scenario compared to that for values of γ appropriate for the gas phase.
Figure 15 shows the evolution of the induction phase (defined here as up to the time when
λ first reaches 0.5) for the case E = 15, γ = 3, α0 = 0.5. Here, as predicted by the large E
asymptotic description, an internal temperature maximum develops at a distance of order
unity away from the contact surface as the temperature rise begins to self-accelerate. The
temperature maximum is located at x = 0.74 in Fig. 15(a), compared to x = 0.60 in the
asymptotic solution forα0 = 0.5 (Fig. 4). Furthermore, the degree of reaction at the contact
surface remains small while the first ignition event occurs around the region of the interior
temperature maximum, again in contrast to the finite activation energy solutions for values
ofγ appropriate to gases as described above. In this case, a backward moving reaction wave
complex now has time to develop in the region between the contact surface and temperature
maximum before the material near the contact surface burns to completion.
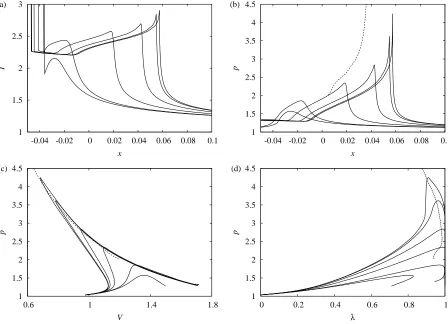
Figure 16 and 17 show the evolution subsequent to the first ignition event, which reveal
that both forward and backward moving reaction waves do indeed emerge. Figure 16 shows
spatial temperature and pressure profiles, from which it can be seen that the amplitude of
the backward reaction wave complex grows more rapidly than the amplitude of the forward
wave. Figure 17 shows pV and pλ trajectories at various times to clarify the evolutionary
mechanisms of these wave. At t = 2.252, the diagrams show that several regimes exist as
one moves back from the initiating shock to the contact surface. Between the shock and the
forward moving reaction wave is an unsteady induction region, through which the forward
wave is moving. This wave can be seen to consist almost entirely of a quasi-steady weak
detonation as predicted by the asymptotic theory, and is followed by an inert expansion
wave (λ = 1 in the expansion subsequent to the pressure maxima according to Fig. 17b).
This is in turn followed by a backward moving inert expansion wave, which in turn trails a
backward moving reaction wave. The backward reaction wave again consists of an almost
complete quasi-steady weak detonation. Finally, another unsteady induction region exists
between the contact surface and the backward moving reaction wave.
At the second time shown in Fig. 17, thepV diagrams reveal that the backward moving
reaction wave is decelerating more rapidly than the forward moving wave (its slope decreases
faster in the pV plane), again in agreement with the large activation energy asymptotic
of the backward wave. This secondary shock forms at x = 0.30, in quantitative agreement
with the value of x = 0.33 obtain in the limit E → ∞. By the third time shown in Fig.
17, this secondary shock and following fast-flame in the backward wave have become a fully
coupled quasi-steady strong detonation (they lie along a common straight line in the pV
plane [29]). Meanwhile, at this time, a secondary shock has now begun to form at the rear
of the forward moving wave. The secondary shock for this wave occurs at x = 1.41, again
in good agreement with the large activation energy asymptotic prediction of x= 1.04.
In conclusion, as found for the piston case [5], while the asymptotic and finite
activa-tion energy soluactiva-tions show qualitative differences when polytropic indices representative of
gaseous fuels are used, for large values of γ as employed in simple condensed phase models,
the finite activation energy solutions agree quantitatively well with the asymptotic
predic-tions even for only moderately large values ofE, due to the much slower deceleration of the
the weak detonations.
V. CONCLUSIONS
In this paper, the events which lead to ignition and detonation formation of reactive
materials in the region between a contact surface and a shock were examined using both high
activation energy asymptotics and finite activation energy direct numerical simulations. For
a polytropic index appropriate to gaseous explosives, the large activation energy asymptotic
solutions differ from those of the problem of ignition between a piston and a shock wave,
in that thermal runaway first occurs off (but still very close to) the contact surface, and
hence both forward and backward quasi-steady weak detonations subsequently emerge. Both
weak detonations may subsequently transition to strong detonation. In the finite activation
energy simulations, however, the solutions are qualitatively different from these asymptotic
predictions, in that while the temperature maximum may move off the contact surface
before burning is complete there, only a forward moving reaction wave emerges. For finite
activation energies, only a weak dependence on the acoustic impedance of the material
behind the contact surface is found, such that the sequence of events leading up to detonation
initiation between the contact surface and shock wave are actually described quite well by
the piston driven solution. The differences between the asymptotic theory and the numerical
detonation as compared to it evolution timescale (hence its quasi-steady structure) that
occur in the large activation energy limit. Such short reaction times are not reproduced for
finite activation energies considered.
For a polytropic index appropriate to a simple condensed phase model, the results are
qualitatively different to those described above. In the large activation energy asymptotic
limit, thermal runaway now occurs at a distance of order unity from the contact surface
due to the stronger coupling of the temperature evolution with localized rises in pressure.
Both the forward and backward moving weak detonations which emerge from this first point
of ignition decelerate more slowly than in the gas phase cases. Due to the slower rate of
deceleration, the large activation energy asymptotic description remains valid over longer
length and time scales, and consequently the finite activation energy solutions are found
to agree quantitatively with the asymptotic predictions, even for only moderately large
activation energies.
Previously, it has been shown that the ignition mechanisms may be qualitatively different
for reactive materials whose kinetics are not well described by the one-step chemistry model
[28, 30–33]. These include, for example, cases where the initial temperature is above a
branching cross-over temperature, whence branching is dominant over
recombination [28, 33]. Simple models appropriate to this regime, entailing a mainly
chain-branching explosion rather than a thermal explosion as examined here, show that a subsonic
reaction wave emerges in the piston driven shock initiation solutions [28, 30, 31, 33]. A
preliminary examination of the contact-shock initiation solutions for these simple
chain-branching models indicate that this remains the case for when the piston is replaced by a
contact surface. For models with thermally neutral induction stages, the main reaction stage
begin at the contact surface both in the large activation energy limit and for finite activation
energies [33]. Hence the results in [33] indicate that for these kinetic models, there is only a
weak dependence of the evolutionary events on the acoustic impedance behind the contact
surface in both cases. We intend to examine the solutions for different kinetic models more
Acknowledgments
GJS was funded via an EPSRC Advanced Fellowship. MS was funded through the ASC
Materials and Physics Modeling Program, LANL. The simulations in this paper were
per-formed on computing equipment purchased via a Joint Research Equipment Initiative grant.
The authors are grateful to James Quirk and Ralph Menikoff for technical support with the
AMRITA environment (www.amrita-cfd.org).
[1] A. K. Kapila and J. W. Dold, “A theoretical picture of shock-to-detonation transition in a homogeneous explosive,” Ninth Symposium (International) on Detonation, 219 (1989). [2] M. Short and J. W. Dold, “Weak detonations, their paths and transition to strong detonation,”
Combust. Theory Model. 6, 279 (2002).
[3] J.W. Dold, “Emergence of a detonation within a reacting medium”. InFluid dynamical aspects of combustion theory (Eds M. Onofri and A Tesei) London: Longman pp. 161–183.
[4] G. Singh and J. F. Clarke, “Transient phenomena in the initiation of a mechanically driven plane detonation,” Proc. Roy. Soc. Lond. A, 438, 23 (1992).
[5] G. J. Sharpe and M. Short, “Shock-induced ignition of thermally sensitive explosives,” IMA J. Appl. Math. 69, 493 (2004).
[6] M. Short and J. W. Dold, “Unsteady gasdynamical evolution of an induction domain between a contact surface and a shock wave: I: Thermal runaway” SIAM J. Appl. Math. 5, 1295 (1996).
[7] C. J. Parkins, “Shock-generated ignition. Newtonian asymptotics for the induction domain between a contact surface and shock,” SIAM J. Appl. Math. 61, 701 (2000).
[8] P. A. Urtiew and A. K. Oppenheim, “Detonative ignition induced by shock merging,” Proc. Combust. Inst. 11, 665 (1966).
[9] L. Bauwens, “Ignition between a shock and a contact surface: Influence of the downstream temperature,”, Proc. Combust. Inst. 28, 653 (2000).