This is a repository copy of Laser-wakefield accelerators for high-resolution X-ray imaging
of complex microstructures.
White Rose Research Online URL for this paper:
http://eprints.whiterose.ac.uk/143587/
Version: Accepted Version
Article:
Hussein, A. E., Senabulya, N., Ma, Y. et al. (31 more authors) (2019) Laser-wakefield
accelerators for high-resolution X-ray imaging of complex microstructures. Scientific
Reports. ISSN 2045-2322
https://doi.org/10.1038/s41598-019-39845-4
[email protected] https://eprints.whiterose.ac.uk/ Reuse
This article is distributed under the terms of the Creative Commons Attribution (CC BY) licence. This licence allows you to distribute, remix, tweak, and build upon the work, even commercially, as long as you credit the authors for the original work. More information and the full terms of the licence here:
https://creativecommons.org/licenses/
Takedown
If you consider content in White Rose Research Online to be in breach of UK law, please notify us by
Laser-wakefield accelerators for high-resolution
X-ray imaging of complex microstructures
A.E. Hussein
1,*, N. Senabulya
2, Y. Ma
1, 3, 4, M.J.V. Streeter
3, 4, 5, B. Kettle
5, S.J.D. Dann
3, 4,
F. Albert
6, N. Bourgeois
7, S. Cipiccia
8, J.M. Cole
5, O. Finlay
3, 4, E. Gerstmayr
5, I. Gallardo
Gonz ´alez
9, A. Higginbotham
10, D.A. Jaroszynski
4, 11, K. Falk
12, K. Krushelnick
1,
N. Lemos
6, N.C. Lopes
5,13, C. Lumsdon
10, O. Lundh
9, S.P.D. Mangles
5, Z. Najmudin
5,
P.P. Rajeev
7, C.M. Schlep ¨utz
14, M. Shahzad
4, 11, M. Smid
12, R. Spesyvtsev
4, 11,
D.R. Symes
7, G. Vieux
4, 11, L. Willingale
1, J. C. Wood
5, A.J. Shahani
2, and
A.G.R. Thomas
1, 3, 41Center for Ultrafast Optical Science, University of Michigan, Ann Arbor, MI 48109-2099, USA
2Department of Materials Science and Engineering, University of Michigan, Ann Arbor, MI 48109-2099, USA
3Physics Department, Lancaster University, Lancaster LA1 4YB, UK
4The Cockcroft Institute, Keckwick Lane, Daresbury, WA4 4AD, UK
5The John Adams Institute for Accelerator Science, Imperial College London, London, SW7 2AZ, UK
6Lawrence Livermore National Laboratory, NIF and Photon Sciences, Livermore, CA 94550, USA
7Central Laser Facility, STFC Rutherford Appleton Laboratory, Didcot OX11 0QX, UK
8Diamond Light Source, Harwell Science and Innovation Campus, Fermi Avenue, Didcot OX11 0DE, UK
9Department of Physics, Lund University, P.O. Box 118, S-22100, Lund, Sweden
10York Plasma Institute, Department of Physics, University of York, York YO10 5DD, UK
11SUPA, Department of Physics, University of Strathclyde, Glasgow G4 0NG, UK
12ELI Beamline, Institute of Physics of the ASCR, Na Slovance 2, Prague 182 21, Czech Republic
13GoLP/Instituto de Plasmas e Fus ˜ao Nuclear, Instituto Superior T ´ecnico, U.L., Lisboa 1049-001, Portugal
14Swiss Light Source, Paul Scherrer Institute, CH-5232 Villigen, Switzerland
ABSTRACT
Laser-wakefield accelerators (LWFAs) are high acceleration-gradient plasma-based particle accelerators capable of producing ultra-relativistic electron beams. Within the strong focusing fields of the wakefield, accelerated electrons undergo betatron oscillations, emitting a bright pulse of X-rays with a micrometer-scale source size that may be used for imaging applications. Non-destructive X-ray phase contrast imaging and tomography of heterogeneous materials can provide insight into their processing, structure, and performance. To demonstrate the imaging capability of X-rays from an LWFA, we have examined an irregular eutectic in the aluminum-silicon (Al-Si) system. The lamellar spacing of the Al-Si eutectic microstructure is on the order of a few micrometers, thus requiring high spatial resolution. We present comparisons between the sharpness and spatial resolution in phase contrast images of this eutectic alloy obtainedvia X-ray phase contrast imaging at the Swiss Light Source (SLS) synchrotron and X-ray projection microscopyvia an LWFA source. An upper bound on the resolving power of 2.7± 0.3µm of the LWFA source in this experiment was measured. These results indicate that betatron X-rays from LWFA can provide an alternative to conventional synchrotron sources for high resolution imaging of eutectics and, more broadly, complex microstructures.
Introduction
Laser-wakefield acceleration (LWFA) is a method for producing high-energy electron beams using the accelerating field structure produced in the wake of a high-power, ultrashort pulsed laser propagating through low density plasma. During wakefield acceleration, an electron bunch “surfs” on the electric wave generated by the light pressure of an intense laser pulse1.
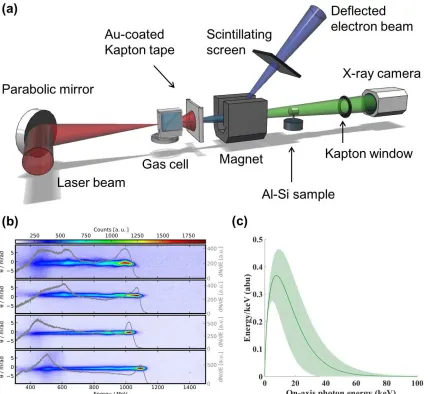
Figure 1.Experimental details for X-ray imaging using a laser wakefield accelerator. (a)Experimental layout. High energy electron and X-ray beams were produced by focusing the beam into a two-stage gas cell (seeMethods). Gold-coated Kapton tape was used to block the laser pulse following the interaction, and was replaced on each shot. A 1 T magnet was used to disperse the electron beam onto a scintillating LANEX screen, from which the electron beam was imaged using a CCD camera. Betatron X-rays passed through the Al-Si sample, which was mounted on a rotation and translation stage at a distance of 19.3 cm from the source. Measurements were made through a kapton vacuum window onto an Andor iKon 2048×2048 pixel CCD camera at a distance of 410 cm from the Al-Si sample.(b)Samples of typical electron beams with a
of X-rays with a source size as small as one micrometer.10–12. Betatron X-ray beams producedviaLWFA have been shown to
produce stable, bright X-ray beams capable of high resolution tomographic imaging11,13–17. The resultant beams have a low
divergence (on the order of a few milliradians18) and ultrashort duration (less than 100 fs19), making them useful for a large range of applications across engineering, medicine, homeland security and science11,12,14–17. Moreover, the demonstration of micrometer scale, keV betatron X-ray beams using a single laser shot demonstrate the potential of these sources for imaging of complex objects in real time using high repetition rate laser systems, enabling X-ray probing with femtosecond resolution13.
One exciting application for these novel X-ray sources is as a diagnostic tool for additive manufacturing processes. Laser-aided solidification is an avenue of interest in manufacturing science that requiresin situmeasurements with high spatial and temporal resolution20,21. Such is the case for the solidification of eutectics, in which two (or more) solid phases grow simultaneously from a parent liquid phase22–25. Once solidified, eutectics act asin situcomposite materials, providing outstanding mechanical and electrical properties that are not afforded by their constituent phases alone. It is for this reason that lightweight Al-Si alloys comprise over 90% of the total Al parts produced by the United States26.Irregulareutectics such as Al-Si are composed of one faceted phase (Si) and another non-faceted (Al) phase. Due to the stiffness of the faceted phase, irregular eutectics feature a non-periodic arrangement of lamellae (fine rods or sheets of adjacent material). The interfacial dynamics underlying irregular eutectic solidification (under relatively low cooling rates) has only recently been elucidated through synchrotron-based X-ray microtomography (denoted XRT), using conventional accelerators.27. In general, the lamellar spacing (between Al and Si phases) can be as fine as 1µm, thus requiring experimental probes that are capable of delivering high resolution information.
As noted above, synchrotron-based XRT in the micrometer range have been achieved using modern third generation light sources, such as the the beamline for TOmographic Microscopy and Coherent rAdiology experimenTs (TOMCAT) of the Swiss Light Source (SLS) at the Paul Scherrer Institut in Switzerland28. The TOMCAT beamline has been employed to produce high-resolution, multimodal X-ray tomographic images using monochromatic sources with energies between 8 and 45 keV, a source size of 127µm (V)×38µm (H) (Full-Width-Half-Maximum) and a flux of (0.5 - 2)×1012 photons/sec/mm229. However, while conventional synchrotron light sources yield high average brightness, they are prohibitively large and expensive, limiting access to these facilities. The 1000×stronger accelerating gradients in a LWFA enable miniaturization of the accelerator to a standard laboratory scale, potentially increasing the accessibility of advanced photon sources. And although compact synchotron sources have recently been developed30, laser-driven sources also have the unique capability to be co-timed
to other laser-initiated events. In this way, LWFA sources can be used for so calledpump-probeexperiments of laser-irradiated targets16,19. Additionally, while the source size of newest generation conventional beamlines has been reduced to the order of 10 - 20µm, the resolution limit for X-ray imaging in a parallel beam geometry on these systems is dependent on the pixel size of the detector and the brightness of the source. Conversely, for a LWFA X-ray source, where the source size has been measured to be on the order of a few micrometers11,13,15,17, high resolution measurements are obtained using a high geometric magnification, and the resolution requirements of the detector are relaxed (seeMethods).
In this report, we investigated the potential of laser-based X-ray sources for the imaging of solid density targets. We present a comparison between the image sharpness and resolution of raw projection images of Al-Si alloys obtainedviaconventional synchrotron X-ray phase contrast imaging at the Swiss Light Source (SLS) and X-ray projection microscopyviaa LWFA. The former experiment was conductedex situat the TOMCAT beamline of SLS (Paul Scherrer Institut, Switzerland)28,29in 2012. In these measurements, the sample was located 20 m from the source and the sample-to-detector distance was set to 11 cm for a monochromatic X-ray energy of 28 keV produced by a broad-band (∆E/E≈2%) W/Si multilayer monochromator, resulting in virtually no geometric magnification in the X-ray regime, i.e. a value of approximately 1. The X-ray radiographic image, which is produced by the absorption and refraction of the X-ray beam within the sample, was converted to visible light using a 100µm thick LuAG:Ce scintillator. The corresponding visible light image was then optically magnified by a 10x microscope objective onto the imaging chip of a pco.2000 CCD camera with 7.5µm pixel size, yielding an effective pixel size of 0.75µm. Individual images were acquired with a 500 ms exposure time.
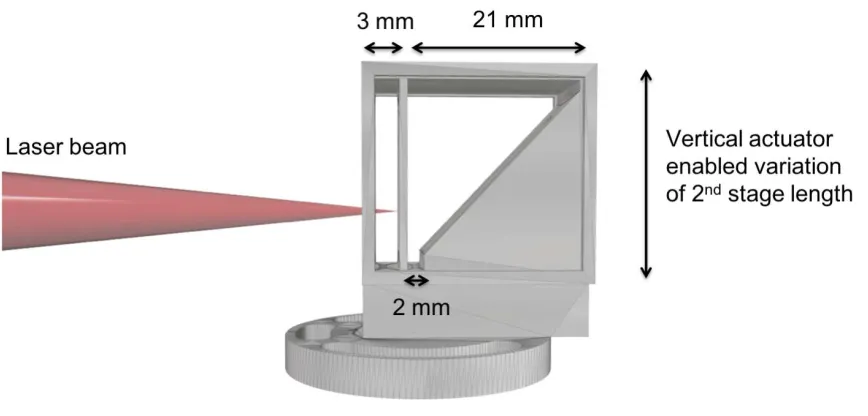
LWFA experiments were conducted using the Gemini laser at the Science and Technology Facilities Council (STFC), Rutherford Appleton Laboratory (RAL). The 40 fs FWHM laser pulse was focused using an f/40 parabolic mirror into a gas cell producing an electron beam. A schematic of the experimental setup at the Gemini laser system is given in Figure1(a). 3D printed two-stage gas cells have been shown to improve the stability, divergence and energy spread of LWFA accelerated electron beams31, therefore a two-stage gas cell with a 3 mm first stage for injection and a 2 - 21 mm variable length second
stage was employed in this experiment (seeMethods). Plasma density was controlled by altering the pressure of the gas supply of each individual stage, and density measurements were made using Stimulated Raman Side Scattering measurements (see
Methods). The plasma density corresponding to the optimum betatron spectrum wasnp= (4.1±0.45)×1018cm−3in both
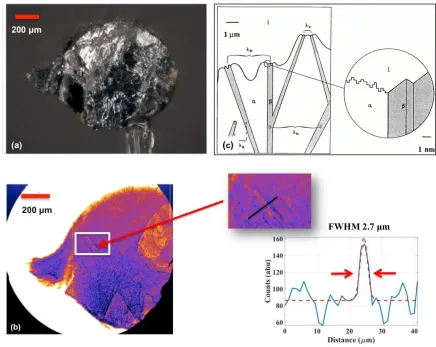
Figure 2.Al-Si sample investigated using a LWFA X-ray source. (a)Optical microscope image of the Al-Si cylindrical sample imaged in LWFA experiments.(b)X-ray phase contrast image obtained with a LWFA, revealing a lamellar
microstructure with an interphase spacing on the order of 1 - 3µm. A line-out from a region of interest in the phase contrast image is shown, indicating 2.7±0.3µm as an upper bound on the resolving power of this method.(c)A schematic showing growth of irregular eutectics whereβ represents the faceted phase (e.g., Si),αis the non-faceted, higher volume fraction phase (e.g., Al), andlis the melt ahead of the interface. The microstructure is deemed irregular due to the difficulty or “stiffness” in changing the growth direction of the faceted phase. The inset shows the atomically diffuseαphase and the defect growth mechanism for the facetedβ phase. Retrieved with permission from Ref.32
inMethods. The X-ray beam, which was assumed to be synchrotron-like as shown in Figure1(c), contained 1.94±1.24
×108photons above 5 keV, and is estimated to have a source size smaller than 3µm, as discussed inResults. The LWFA
X-ray beam has been found in similar experiments to have divergence on the order of a few millirads15,17,18and femtosecond
duration16,19. The electron and X-ray measurements shown in Figure1(b) and (c) were not obtained simultaneously, but were taken at identical experimental conditions. In these experiments, the Al-Si sample was 19.3 cm away from the betatron source and an X-ray CCD camera with pixel size of 13.5µm and a 100 ms exposure time was located 410 cm behind the sample (see
Methods). A total of 136 single-shot images were acquired and no reconstructions were applied.
Results
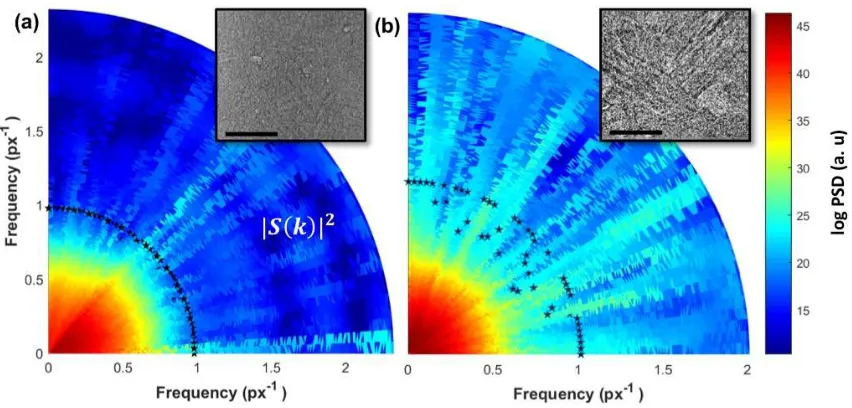
Figure 3.Measurement of the spatial resolution criterion for line profiles oriented from 0◦to 90◦.The spatial
resolution criterion is projected onto polar plots in(a)SLS and(b)LWFA projection images. Projection images are shown as insets.|S(k)|2is the spectral power of the detected signal. Raw images were resized to match the dissimilar pixel resolutions
for SLS and LWFA images, and PSD analysis was performed on projection images with equalized intensity histograms. For both cases, spatial frequencies are given in units of inverse pixels. The LWFA projection image has a spatial resolution that is comparable to the spatial resolution in the SLS projection image, as evidenced by the close to equal kresvalues of 1.017±0.01
px−1and 0.98±0.01 px−1in the LWFA and SLS images, respectively. Stars represent thek
resspatial frequency value
obtained along an arbitrary line in the projection image. Scale bar measures 70µm.
smaller region of the sample. However, this has little to no bearing on the development of the eutectic microstructure. Both alloys were cast in the exact same manner, and thus have comparable lamellar spacings (seeMethods). For both experiments, the samples were machined into cylindrical samples of 1 mm thickness.
A microscope image of the 1 mm diameter machined sample is shown in Figure2(a) alongside an example image of the Al-Si microstructure obtained using X-rays from a LWFA in Figure2(b). The LWFA projection image was obtained using a nearly 22×magnification, and the banded or lamellar structure can be observed in the zoomed-in image, from which a line-out indicates that the LWFA source is successfully resolving features smaller than 3µm. The resolution of these images is determined by the geometry of the imaging system, as discussed inMethods. The observed microstructure is consistent with that predicted for irregular eutectics, in which the lamellar spacing can be as fine as 1µm (Figure2(c)). In this idealized schematic, the faceted phaseβ (e.g., Si) and the non-faceted phaseα (e.g., Al) are shown, growing in a non-periodic manner into the liquid.
The quality of the SLS and LWFA projection images were compared according to two metrics: image sharpness and resolution. Image sharpness is closely related to the fineness of the resolvable details in an image (X-ray projection microscopic images in this case). An algorithm developed by Shaked and Tastl33was used to determine the overall sharpness of an image
(seeMethods). Spatial resolution was compared using a Fourier-based criterion34on raw projection images obtainedviaa
LWFA source and the TOMCAT beamline at the SLS. In this analysis, image quality was computed for the interior regions of phase contrast images to compare areas of highest resolution.
Normalized sharpness estimates given in arbitrary units (1±0.05 a.u. and 0.62±0.05 a.u. for LWFA and SLS projection images, respectively) show that the LWFA projection images are comparable to the sharpness of projection images obtained at SLS (seeMethods). In addition, Figure3shows the calculation of the spatial resolution, where|S(k)|2is the spectral power of
the detected signal andkresis the maximum spatial frequency when the spectral power is twice the noise level (seeMethods).
Figure 4.Blurring of LWFA X-ray images due to finite betatron emission length.Three LWFA phase contrast images of the Al-Si sample are shown. In(a)and(b)the sample is at the same orientation perpendicular to the laser axis. In image(b)the sample has been translated horizontally by approximately 30µm. In(c)the sample has been rotated by 90 degrees about the vertical axis. Regions of sharpest resolution are circled with a dotted line, with a radius of approximately 600µm at highest focus. In all images, blurring can be observed on the order of a millimeter away from the central point due to the emission length of the betatron source. Highest resolution imaging is obtained along the axis of the electron beam; only this section of the image is used for resolution analysis. Blurring due to the emission length of the X-ray source is not unique to betatron sources, also occurring with conventional synchrotron beams, but is exacerbated by high magnification in cases where the full beam is used for imaging.
The PSD shown in Figure3(a) and Figure3(b) have been calculated for line profiles in the images taken using the TOMCAT beamline andviaLWFA, respectively. The PSD profiles, projected onto polar plots, were computed for lines arbitrarily drawn within the projection image at angles ranging from 0◦to 90◦with the horizon to ensure that the PSD over all pixel directions in the projection images were statistically represented. It can be observed that the LWFA image has a spatial resolutionxreswhich
is comparable to the spatial resolution in the SLS image. According to the Wiener-Khintchine theorem35, the autocorrelation
function is the Fourier transform of the power spectral density. Accordingly, Figure3(b) shows a slightly higher autocorrelation at long wavelengths as evidenced by a higherkres(1.017±0.01) px−1value compared to 0.98±0.01 px−1for the SLS image,
where LWFA images have been rescaled to the effective pixel value for proper comparison. Errors in the measurement of image resolution arise from the absence of normalization by white- and dark-field images for the LWFA projections (Figure3(b)), which ultimately lead to intensity inhomogeneities on the detector plane.
Beyond sharpness and resolution, another consideration in the practical application of LWFA for X-ray imaging is blurring due to the non-zero emission length of the betatron source36. Betatron emission is highest at the location of high energy electrons, yielding a very small source size on the order of a fewµm11. However, the emission length of a betatron source has been found to extend a few millimeters along the axis of laser propagation, resulting in blurring in X-ray images and decreased resolution36,37. This blurring can be observed in Figure4, where the image resolution is highest near the central axis of the X-ray beam (circled) and begins to blur towards the edges of the sample. It has also been found that the betatron emission length tends to increase with increasing plasma length37, therefore longer plasma lengths are associated with lower resolution
away from the central axis of the laser beam. Additionally, instability in beam pointing can result in variation of the location of highest resolution. For a plasma cell of length 15.5 mm, as employed in these experiments, the emission length of the betatron source was found to be on the order of 5 mm. Image blurring is also a challenge with conventional synchrotron sources, where the emission length can be much longer (∼m), versus∼mm for a LWFA source. However, the large divergence of the LWFA source makes this a concern when the full beam size is used for imaging. It is also important to note that blurring due to the emission length is exacerbated by high magnification. Therefore, the relationship between plasma length and emission can inform optimization of the LWFA X-ray source for high resolution imaging.
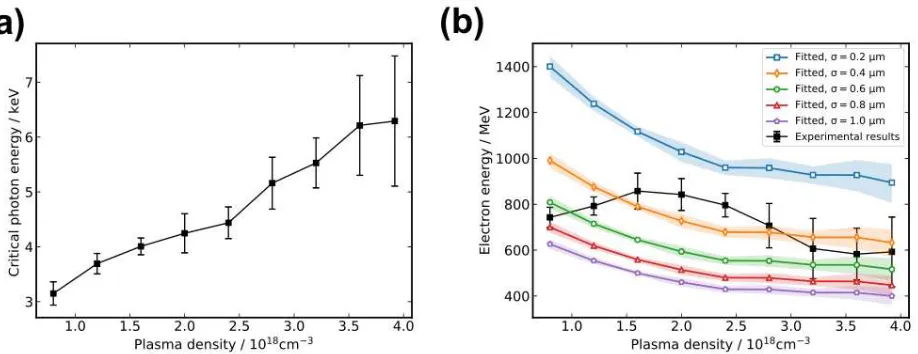
For high contrast imaging of features in dense materials the critical energy of the X-ray beam must be on the order of several keV. In this experiment, the critical energy of the resultant X-ray beam is determined by comparing the transmission through an array of different elemental filters (seeMethods). The critical energy as a function of plasma density was found to increase with increasing plasma density, as shown in Figure5(a), reaching a maximum critical energy of nearly 10 keV. These results indicate that LWFA X-ray sources can provide a tunable X-ray source for phase contrast imaging.
Figure 5.Critical energy of the LWFA betatron source.a)Experimentally measured critical energy of the LWFA X-ray beam as a function of plasma density.(b)Theoretical predictions of the maximum electron energy corresponding to
experimentally measured critical energy, shown for betatron source sizes of (0.2 - 1.0)µm along with experimentally measured maximum electron energies in the resultant LWFA beam (black).
density,np, by38–40:
Ec=
3 2h¯ωβKγ
2=3
4h¯
e2
ε0mec
σ
2npγ
2
(1) whereσ=2rβ is the approximate betatron source size andrβ is the amplitude of betatron oscillations. From equation (1), one can see that the electron energy can be retrieved from the measured critical photon energy, the plasma densitynpand
an assumed source sizeσ usingγ∝p
2Ec/npσ. Figure5(b) shows the retrieved electron energies with measured plasma
densities and fitted source sizeσ of (0.2 - 1µm). A plot of the experimentally measured peak electron energy is superimposed on retrieved electron energies, showing best agreement between theory and experimental data for betatron source size on the order of (0.4 - 1.0)µm.
For comparison with experimental results it is important to note that the critical photon energy in equation (1) is mainly determined by the maximum electron energy achieved during acceleration because of theγ2scaling. Therefore, the retrieved
electron energies represent the maximum electron energies during the acceleration, which are not necessarily the same as those measured from the experiment. This is because for high plasma density (here,np>1.2×1018cm−3) the dephasing length is
shorter than the gas cell length and electron beams will experience dephasing. Currently, information about electron dephasing cannot be captured experimentally in a single shot, however novel techniques employing a transverse density gradient may provide single-shot diagnostic information of the temporal evolution of the betatron X-ray spectrum and electron acceleration41.
Discussion
Thus far, Al-Si eutectics have only been investigatedviaconventional synchrotron-based phase contrast tomography (PCT)42–44. PCT enables the study of weakly absorbing samples, as well as materials systems consisting of elements with similar atomic numbers. This is because variations in the real valued refractive index are several orders of magnitude larger than the imaginary component45,46. In order to recover the microstructure from projection images obtainedviaPCT, phase-retrieval algorithms are first applied to the projection images47,48. Subsequently, a projection algorithm (e.g., filtered back projection49)is used to reconstruct a three-dimensional (3D) map of the refractive index decrement (i.e., the difference between the sample’s index of refraction and that of air). Image segmentation of the PCT reconstructions is crucial for quantitative analysis of interfacial properties,e.g., orientations, velocities, curvatures, andn-point statistics50,51. However, sharp images taken at high resolution
with sufficient contrast, such as those obtained with a LWFA source, can mitigate the challenges associated with low pass characteristics in projection images and in turn ease the data analysis process down-stream42,52,53,
between neighboring Si lamellae was measured to be between 10 and 90µm. Using the Jackson-Hunt relationships modified for irregular eutectics22,24,54,55, the average lamellar spacing was correlated with an average growth rate and undercooling,
estimated to be 0.35±0.3µm/s and 0.13±0.03 K, respectively (seeMethods). The combination of the two solidification parameters gave rise to the eutectic microstructure observed in the LWFA projection images. Additionally, the lamellar morphology as shown in Figure3(b), inset, exhibits a flake-like Si phase that is commonly found in irregular eutectics of undoped or unmodified alloys. This morphology is to be fully expected given the high purity of the constituent Al and Si powders, as discussed inMethods. The eutectic Si flakes extend laterally by a process known as twin plane re-entrant edge mechanism (TPRE), which was first introduced by Wagner56and Hamilton and Seindensticker57. Branching events between the Si flakes that are likewise facilitated by twins were also observed58. Altogether, these preliminary observations suggest the importance of growth twinning for the continued propagation of the faceted Si phase during solidification. A more conclusive argument for the growth mechanism of undoped and doped alloy samples cannot be made until a 4D (i.e., space-and time-resolved) assessment of the microstructure is performed, which is the focus of future research.
The resolution limits of phase-contrast X-ray imaging experiments are set by the source size and the imaging geometry, which determines the magnification of the system, and the detector pixel size. For synchrotron beamlines, such as TOMCAT, the source size is much bigger than the desired resolution, but the distance from the source to the sample is typically much larger than the distance from the sample to the detector, effectively resulting in a large demagnification factor of the source size. Therefore, the effective pixel size of the detector (which includes the optical magnification provided by the visible light microscope coupling the scintillator to the detector’s imaging chip) is the limiting factor for high-resolution imaging, and needs to be minimized for the highest possible resolution. Conversely, for LWFA sources, where the source size is much smaller than the pixel size of the detector, the high magnification in the X-ray imaging geometry reduces the resolution requirements of the detector. For high resolution phase contrast imaging, the conditions for detection of bright and dark phase contrast fringes are set by the detector resolution, and the bandwidth and size of the source46.
A comparison of experimental parameters used in the SLS and LWFA experiments presented here indicates that these sources have comparable geometric resolution limits and both satisfy the criteria for fringe detection (seeMethods). However, our analysis of the projection images shown in Figure3indicates that the LWFA source has slightly greater sharpness and spatial resolution for these conditions and is able to resolve micrometer-scale lamellar features. The reason for resolution loss in the SLS projection image is likely due to vibrations in the experimental setup. At the time of the experiments, the relative sample to detector position could vibrate at an amplitude of up to 0.5 - 1µm consequently resulting in a blurring of the projection images over the 500 milliseconds exposure time. Conversely, although LWFA experiments are prone to similar instabilities, the femtosecond timescale of the betatron source enables ultrafast imaging. Therefore, single-shot LWFA images are not subject to motion blur. In this way, the visibility of small-scale features such as lamellae is enhanced. It is also worth noting that the conditions for detecting phase contrast fringes for the LWFA experiments set an upper bound of 1µm on the source size, indicating that betatron sources may be much smaller than previously noted.
Our results indicate that betatron X-rays from LWFA can be competitive with conventional synchrotron sources for the characterization of eutectic alloys and solid density materials. This opens the door to high-resolution materials diagnostics using laser-based sources, without needing to visit a synchrotron facility. Indeed, projection images of the Al-Si sample obtained using LWFA betatron X-rays were of comparable sharpness and spatial resolution to projection images obtained at SLS. Fine details of the lamellar microstructure were clearly resolved in LWFA projection images (Figure 3(b) inset), indicating an upper bound of 2.7µm on the resolving power of this method. Furthermore, the phase contrast spatial resolution criteria indicate that the LWFA source size may be much smaller than a micrometer, which is corroborated by the theoretical scaling of the betatron energy with plasma density in Figure5(b) in which the retrieved electron energy was most closely fit assuming betatron source sizes on the order of (0.4 - 1)µm. However, it is important to note that the enhanced spatial resolution reported in this paper is specific to the experimental conditions of these experiments, and that neither of the two experiments was optimized to obtain the ultimate spatial resolution. The ultrashort exposure time of betatron sources may also provide improved spatial resolution by enabling imaging on a timescale shorter than the frequency of vibrations in experimental setups.
As mentioned in theIntroduction, one area in which we can demonstrate significant near-term impact of these LWFA sources is through the use of betatron X-rays as a diagnostic tool for real-time monitoring of additive manufacturing. In recent years, additive manufacturing has seen tremendous growth due to developments in processes and materials, as well as a greater understanding of the underlying design principles. It already has huge societal impacts through the ability to produce cheaper and customizable products, such as artificial hips and lightweight aircraft components59–61. As-solidified parts
have been traditionally characterized by examining their microstructures following manufacturing, however suchpost mortem
Figure 6.CAD model of the variable length two-stage gas cell used in LWFA experiments.A two-stage gas cell with a 3 mm first stage for ionization injection and a variable length second stage was used in LWFA experiments. A 45◦wall in the second stage enabled variation of the length of the second stage (between 2 to 21 mm) using linear motor controls to vary the vertical position of the cell.
monitoring and metrologyas a key barrier to additive manufacturing implementation62. To address this confounding issue, a
few investigators have recently employed synchrotron-based X-ray microtomography (denoted XRT) to track the microstructural evolution as a function of time27,63. High-speed synchrotron hard X-ray imaging on the nanosecond timescale has recently been demonstrated20, however LWFA sources offer temporal resolution on the order of femtoseconds16,64,65. The realization of high-repetition rate laser drivers for LWFA66–68could enable dynamic measurements on an ultra-short timescale. Therefore, the micrometer-scale spatial resolution demonstrated in this paper, combined with femtosecond temporal resolution and high repetition capabilities, indicate that LWFA sources could be used for high-resolution dynamics measurements on an ultra-short timescale.
Methods
Laser
The LWFA experiments were carried out on the Gemini laser facility at the Science and Technology Facilities Council (STFC), Rutherford Appleton Lab (RAL), UK. The pulse for laser wakefield acceleration had a FWHM pulse duration of 40±3 fs, a central wavelength of 800 nm, and was linearly polarized. The laser pulse with energy of 16.4±0.6 J before the compressor, yielding approximately 8.4±0.6 J on target. The pulse was focused by anf/40 off-axis parabolic mirror with a focal length of 6 m to a 1/e2focal spot of 36.3±0.8µm, yielding a peak intensity of 1.0×10¹⁹W/cm2(a0=2.0) within the FWHM of the
focal spot.
Gas target
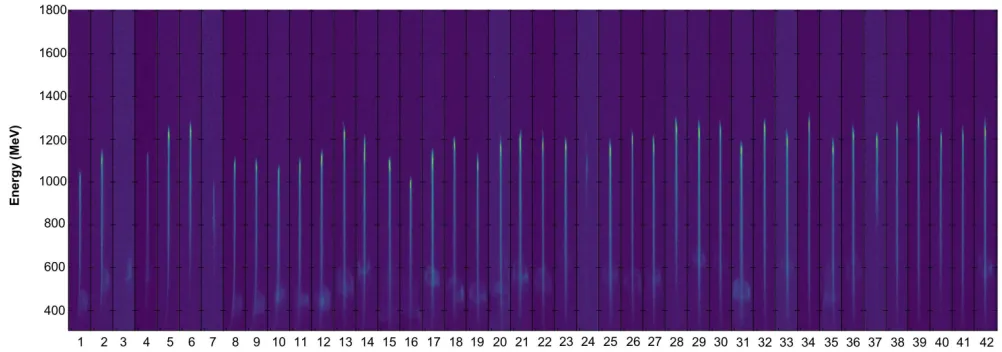
The laser was focused into a 3D printed two-stage length gas cell, with mixed gas (2% nitrogen and 98% helium) in the first stage and helium gas in the second stage. The length of the first stage in the gas cell, used for ionization injection, was 3 mm, and the length of the second stage was varied between 2 and 21 mm using linear actuators to change the position of the laser relative to a 45◦exit wall, as shown in Figure6. The thickness of the entrance and stage divider walls were 1 mm, and the exit wall was 2 mm thick. The plasma density was controlled by altering the backing pressure of the gas supply. Plasma density measurements were made using calibrated Raman Side Scattering measurements69and yieldednp= (4.1±0.45)×1018cm−3
Figure 7.Electron beam profiles.Electron spectra obtained for 42 consecutive laser shots at identical experimental conditions.
Electron and X-ray beam characterization
A 1 T magnet was used to disperse the electron beam onto a scintillating LANEX screen, from which the electron beam was imaged using a CCD camera. Particle tracing was performed with the measured magnet field map to calculate the electron energy as a function of the position on the lanex screen. A series of electron spectra from consecutive shots at identical experimental conditions is presented in Figure7, indicating good shot-to-shot reproducibility of accelerated beams at a plasma density ofnp= (4.1±0.45)×1018cm−3. The average peak energy of the beams shown in Figure7was (1200±50) MeV, but
for all spectra at these conditions the average peak energy was (1000±150) MeV. Low energy features on the beams are likely untrapped energetic electrons, which have been found to form ring structures70,71.
The X-ray beam was collected by an on-axis X-ray camera (model: Andor iKon-L SY DW936 BR-DD) with a a 250µm beryllium filter, placed 429.3 cm away from the source. In front of the X-ray camera a 9-element filter array composed of various materials with different K-edges was placed to characterize the X-ray spectral distribution11,15. The thickness of each filter element can be found in Table 1. The signal counts on camera can be estimated as72:
Ni=η
Z Emax
Emin
S(E,Ecrit)Q(E)Ti(E)dE (2)
whereηis a constant coefficient,S(E,Ecrit)∼(E/2Ecrit)2K22/3(E/2Ecrit)is the on-axis synchrotron spectrum with a critical
energy ofEcrit,Q(E)is the quantum efficiency of the camera,Tiis the overall transmission of the filteriwith the consideration
of attenuation of other materials in the beam path. Fitting equation (2) with the measured signal counts on the camera for all the filters gives a best fittedEcrit.
Material: Nb Mo Cu Zn Fe Co Sc Ti Pb Thickness (µm): 24.5 20.0 9.2 10.0 5.6 5.4 26.7 17.3 503.8
Table 1. Thickness of filter array elements.
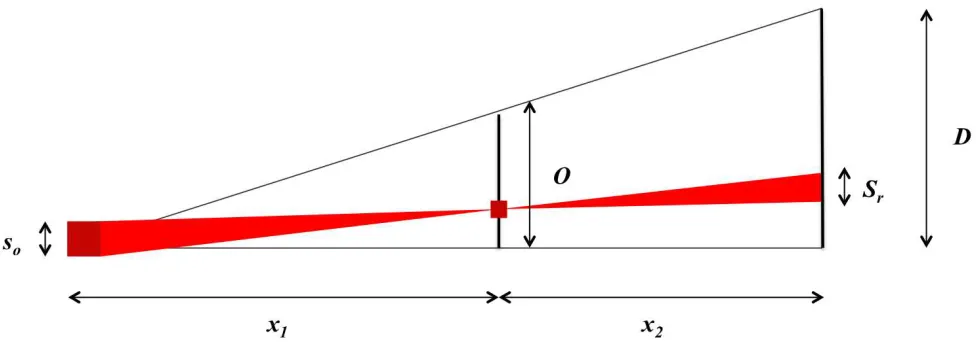
Figure 8.Geometric layout of a X-ray illumination setup without optics.The distance from the source,soto the object,
O, isx1, and the distance from the object to the detector,D, isx2.
Image sharpness and resolution
The SLS projection image was normalized according to the standard procedure for synchotron experiments using dark images and flat-field corrections as follows:
Normalized SLS image=((Raw SLS projection image)−(average of 21 dark shots))
((average of 51 flat shots)−(average of 21 dark shots)) (3)
No such normalizations were applied to LWFA images.
An algorithm developed by Shaked and Tastl33was used to determine the overall sharpness of an image. Here, their global
single parameter sharpness model is used, implemented as the ratio between the output energy of an ideal high pass filter and an ideal band pass filter,33and described by
Sharpness=
R ¯
ξ εH|M(ξ¯)|
2dξ¯ R
¯
ξ εB|M(ξ¯)|2dξ¯
(4)
where the image is indicated bym(x,y)and the Fourier transform of the image byF(m) =M(ξx,ξy), the Cartesian frequency
coordinates are defined as ¯ξ = (ξx,ξy), andH andBare the high and low-band pass frequency ranges, respectively. The
images were initially resized to match the dissimilar pixel resolutions (0.74µm and 0.61µm for SLS and LWFA experiments, respectively), and the intensity histogram in each image was scaled to lie within the same intensity range. Subsequently, a 2D high pass filter and 2D band pass filter were applied to the 2D Fourier transform of each image matrix and the image sharpness was calculated according to equation (4).
A Fourier-based spatial resolution criterion34was used on projection images obtainedviaa laser-wakefield accelerator system and the TOMCAT beamline at the Swiss Light Source. The power spectral density (PSD) profiles of lines arbitrarily drawn within the projection image at angles ranging from 0◦to 90◦with the horizon are computed. This was done to ensure that the power spectral density over all pixel directions in the projection images were statistically represented. The PSD values can then be projected onto polar plots to reveal the power spectral distribution at varying angular positions within the image. The PSD converges to a value defined as the “noise baseline” obtained in our calculations by taking the mean of the last fifty (50) power spectral density elements in the array of PSDs. According to the criterion put forward by Ref34, spatial resolution is computed by taking twice the value of the PSD at the noise baseline, and matching this value to the corresponding maximum spatial frequency,kres34. The spatial resolutionxresis related to the wavenumberkresby:
xres=
2π
kres
(5)
Resolution limits
to the detector isx2. In this configuration there are two limitations on the resolution dictated by source size and the detector
resolution, both of which depend on the magnification of the system.
The geometric magnification of the system is related to the distances between the source and the object and the object and the detector using similar right angle triangles:M=D/O= (x1+x2)/x1. The transverse projection of a point in the object onto
the detector determines the source-size limited resolution,Sr=sox2/x1. At the object plane, the resolution limit of the source
is given bySr/M=sox2/(x1+x2). The resolution limit of the detector is set by the pixel size,p, and therefore the lower bound
on detector resolution isDr=p/M=px1/(x1+x2). The total resolution,r, can be considered as the 2-norm of these limits73:
r=
sox2
x1+x2 2
+
px1
x1+x2 2!1/2
(6)
The conditions for detecting fringes due to phase contrast imaging are set by the detector resolution, the wavelength bandwidth and the source size46. The X-ray detector must have sufficient resolution to resolve separate fringes, where the fringe spacing is given byz≃√x2λ whereλ is taken to be the wavelength of the critical energy of the source, given in Table2. Using the values in Table2, it is clear that this condition is satisfied in both the SLS and LWFA experiments. The condition on the longitudinal coherence of the source is given by∆λ/λ ≪2. This conditions is rather weak and therefore can be assumed to be automatically satisfied for both sources46.
The final condition on the resolution of phase-contrast imaging is set by the lateral coherence of the source, or the source size. A finite source size can be considered as a pair of point sources, separated by a finite distance,y. These two sources will each produce fringes at the detector. The shift between these fringes can result in blurring and decreased resolution. The limit on the source size for resolving individual fringes is given byy≪x1
p
λ/x2. The parameters above are tabulated for the SLS
and the LWFA generated X-ray source in Table2.
SLS LWFA
Source size, FWHM (s0): 127µm (H)×38µm (V) <2.7µm (1µm assumed)
Detector pixel size (p): 0.75µm 13.5µm Source to sample(x1): 2000 cm 19.3 cm
Sample to detector(x2): 11 cm 410 cm
Magnification (M): ≃1.01 22.2 Source size limited resolution at the object plane (Sr/M): 0.69µm×0.21µm 0.96µm
Detector resolution limit (p/M): 0.74µm 0.61µm Total geometric resolution (r): 1.0µm×0.76µm 1.1µm Phase contrast detector limit (z): 2.2µm 21µm Critical energy (Ec): 28 keV 11.2 keV
[image:13.612.69.551.339.504.2]Wavelength (λ): 4.4×10⁻¹¹m 1.1×10⁻¹⁰m Phase contrast source size limit (y): ≪400µm ≪1µm
Table 2.Comparison of resolution limits in X-ray imaging between the Swiss Light Source (SLS) and LWFA X-ray sources generated using the Gemini Laser at the Rutherford Appleton Lab (RAL). Errors on all measurements are approximately 10%.
Materials
The Al-Si targets for phase contrast imaging were prepared by the Materials Preparation Center at Ames Laboratory (Ames, IA, USA). High-purity powders (99.99% Al and 99.9999% Si) were prepared by melting three times in a low-pressure argon (Ar) atmosphere to mix and degas the melt. In this way, castings in the shape of buttons were produced with a composition of 50 wt% Si for the Rutherford Appleton Laboratory (RAL) experiment and 30 wt% for the Swiss Light Source (SLS) experiment. The as-cast buttons were machined into cylindrical samples of 1 mm diameter using Electrical Discharge Machining (EDM).
Lamellar spacing, growth rate, and undercooling
In measuring the growth rate and undercooling based on the interflake lamellar spacing, the following relationships based on the modified Jackson – Hunt eutectic theory24,54,55were employed:
λ2V=K
1and∆T =K2V0.53 (7)
whereK1= 780.04 andK2=0.24. To solve for the growth rate,V, and undercooling,∆T, the lamellar spacings λ were
Errors in the measurement of the lamellar spacings arise due to the fact that onlyprojectedspacings can be measured in the projection images and may not represent thetruespacing between lamellae, depending on whether the lamellar are tilted with respect to the plane perpendicular to the X-ray beam. Consequently, the growth rate was found to vary between 0.1µm/s±0.3 to 1.2µm/s±0.3 while the undercooling was found to vary between 0.065±0.03 K to 0.25±0.03 K. It is anticipated that a 3D microstructural analysisviaphase contrast X-ray tomography in the laser wakefield accelerator setup could aid in the refinement of calculations of the lamellae spacing, growth rate, and undercooling and further enhance our understanding of the detailed morphology and topology of the Al-Si eutectic microstructure and other related alloys.
References
1. Tajima, T. & Dawson, J. M. Laser electron accelerator.Phys. Rev. Lett.43, 215004 (1979).
2. Esarey, E., Schroeder, C. B. & Leemans, W. P. Physics of laser-driven plasma-based electron accelerators. Rev. Mod. Phys. 81, 1229–1285 (2009).
3. Modena, A.et al.Electron acceleration from the breaking of relativistic plasma waves. Nat.377, 606 (1995).
4. Malka, V.et al. Electron acceleration by a wake field forced by an intense ultrashort laser pulse. Sci.298, 1596–1600 (2002).
5. Mangles, S. P. D.et al. Monoenergetic beams of relativistic electrons from intense laser-plasma interactions. Nat.431, 535–538 (2004).
6. Faure, J.et al.A laser-plasma accelerator producing monoenergic electron beams. Nat.431, 541–544 (2004).
7. Geddes, C. G. R.et al. High-quality electron beams from a laser wakefield accelerator using plasma-channel guiding. Nat. 431, 538–541 (2004).
8. Leemans, W.et al.Gev electron beams froma centimetre-scale accelerator.Nat. Phys.2, 696–699 (2006).
9. Wang, X.et al. Quasi-monoenergetic laser-plasma acceleration of electrons to 2 gev.Nat. Commun.4(2013).
10. Rousse, A.et al.Production of a keV X-Ray beam from synchrotron radiation in relativistic laser-plasma interaction.Phys. Rev. Lett.93, 135005 (2004).
11. Kneip, S.et al.Bright spatially coherent synchrotron X-rays from a table-top source.Nat. Phys.6, 980–983 (2010).
12. Albert, F. & Thomas, A. G. R. Applications of laser wakefield accelerator-based light sources. Plasma Phys. Control. Fusion58(2016).
13. Fourmaux, S.et al.Single shot phase contrast imaging using laser-produced betatron x-ray beams.Opt. Lett.36, 2426–2428 (2011).
14. Wenz, J.et al. Quantitative x-ray phase-contrast microtomography from a compact laser-driven betatron source. Nat. Commun.6, 7568 (2015).
15. Cole, J.et al. Laser-wakefield accelerators as hard x-ray sources for 3D medical imaging of human bone.Sci. Reports5
(2015).
16. Wood, J.et al.Ultrafast imaging of laser driven shock waves using betatron x-rays from a laser wakefield accelerator.Sci. Reports8, 11010 (2018).
17. Cole, J. M.et al. High-resolutionµCT of a mouse embryo using a compact laser-driven X-ray betatron source.Proc. Natl. Acad. Sci.201802314 (2018).
18. Albert, F.et al. Angular dependence of betatron x-ray spectra from a laser-wakefield accelerator.Phys. Rev. Lett.111, 235004 (2013).
19. Mahieu, B.et al. Probing warm dense matter using femtosecond x-ray absorption spectroscopy with a laser-produced betatron source. Nat. Commun.9, 3276 (2018).
20. Zhao, C.et al.Real-time monitoring of laser powder bed fusion process using high-speed X-ray imaging and diffraction.
Sci. Reports7, 3602 (2017).
21. Leung, C. L. A.et al. In situ X-ray imaging of defect and molten pool dynamics in laser additive manufacturing. Nat. Commun.9, 1–9 (2018).
22. Jackson, K. & Hunt, J. D. Lamellae and rod eutectic growth. Trans. Met. Soc. AIME236, 1129–1142 (1966).
24. Magnin, P. & Trivedi, R. Eutectic growth: a modification of the Jackson-Hunt theory. Acta Metall.39, 453 (1991).
25. Kang, J. L., Xu, W., Wei, X. X., Ferry, M. & Li, J. F. Solidification behavior of Co-Sn eutectic alloy with Nb addition.J. Alloy. Compd.695, 1498–1504 (2017).
26. Davis, J. R. Aluminum and aluminum alloys(ASM international, 1993).
27. Shahani, A. J., Xiao, X. & Voorhees, P. W. The mechanism of eutectic growth in highly anisotropic materials. Nat. Commun.7, 1–7 (2016).
28. Stampanoni, M.et al.Trends in synchrotron-based tomographic imaging: the sls experience.Proc. SPIE6318(2006).
29. Stampanoni, M.et al.Hierarchical, multimodal tomographic X-ray imaging at a superbend.Dev. X-Ray Tomogr. Vi7078, 1–11 (2008).
30. Eggl, E.et al.The munich compact light source: initial performance measures. J. Synchrotron Radiat.23, 1137–1142 (2016).
31. Vargas, M.et al. Improvements to laser wakefield accelerated electron beam stability, divergence, and energy spread using three-dimensional printed two-stage gas cell targets.Appl. Phys. Lett.104(2014).
32. Fisher, D. J. & Kurz, W. A theory of branching limited growth of irregular eutectics. Acta Metall.28, 777–794 (1980).
33. Shaked, D. & Tastl, I. Sharpness measure: Towards automatic image enhancement. Proc. - Int. Conf. on Image Process. ICIP1, 937–940 (2005).
34. Modregger, P., L¨ubbert, D., Sch¨afer, P. & K¨ohler, R. Spatial resolution in Bragg-magnified X-ray images as determined by Fourier analysis. Phys. Status Solidi (A) Appl. Mater. Sci.204, 2746–2752 (2007).
35. Nobert, W. Extrapolation, Interpolation, and Smoothing of Stationary Time Series(Technology Press of Massachusetts Institute of Technology, 1964).
36. Corde, S.et al.Mapping the x-ray emission region in a laser-plasma accelerator.Phys. Rev. Lett.107, 215004 (2011).
37. Lopes, N. C.et al.Measurement of the lwfa betatron source length by cross-correlations over images of granular random targets. Sci. Technol. Facil. Counc. - Cent. Laser Facil. Annu. Rep.(2015-2016).
38. Corde, S.et al.Femtosecond x rays from laser-plasma accelerators. Rev. Mod. Phys.85, 1 (2013).
39. Thomas, A. G. R. Scalings for radiation from plasma bubbles. Phys. Plasmas17, 056708 (2010).
40. Esarey, E., Shadwick, B., Catravas, P. & Leemans, W. Synchrotron radiation from electron beams in plasma-focusing channels. Phys. Rev. E65, 056505 (2002).
41. Ma, Y.et al. Angular streaking of betatron x-rays in a transverse density gradient laser-wakefield accelerator. Phys. Plasmas25, 113105 (2018).
42. Shahani, A. J., Begum Gulsoy, E., Gibbs, J. W., Fife, J. L. & Voorhees, P. W. Integrated approach to the data processing of four-dimensional datasets from phase-contrast x-ray tomography. Opt. Express22, 24606 (2014).
43. Shahani, A. J.et al.The dynamics of coarsening in highly anisotropic systems: Si particles in Al-Si liquids.Acta Materialia 97, 325–337 (2015).
44. Shahani, A. J., Gulsoy, E. B., Poulsen, S. O., Xiao, X. & Voorhees, P. W. Twin-mediated crystal growth: an enigma resolved. Sci. Reports6, 28651 (2016).
45. Cloetens, P., Barrett, R., Baruchel, J., Guigay, J. P. & Schlenker, M. Phase objects in synchrotron radiation hard x-ray imaging.J. Phys. D Appl. Phys.29, 133–146 (1996).
46. Margoritondo, G. Elements of Synchrotron Light: for Biology, Chemistry, and Medical Research(Oxford University Press, 2002).
47. Paganin, D., Mayo, S. C., Gureyev, T. E., Miller, P. R. & Wilkins, S. W. Simultaneous phase and amplitude extraction from a single defocused image of a homogeneous object. J. Microsc.206, 33–40 (2002).
48. Wu, X., Lu, H. & Yan, A. Phase-contrast x-ray tomography: Contrast mechanism and roles of phase retrieval. Eur. J. Radiol.68S, S8–S12 (2008).
49. Kak, A. C. & Slaney, M. Principles of Computerized Tomographic Imaging(IEEE, 1988).
51. Sun, Y., Cecen, A., Gibbs, J. W., Kalidindi, S. R. & Voorhees, P. W. Analytics on large microstructure datasets using two-point spatial correlations: Coarsening of dendritic structures. Acta Materialia132, 374–388 (2017).
52. Irvine, S. C., M.Paganin, D., Dubsky, S., Lewis, R. A. & Fouras, A. Phase retrieval for improved three-dimensional velocimetry of dynamic x-ray blood speckle.Appl. Phys. Lett.93, 91–94 (2008).
53. Paganin, D., Gureyev, T. E., Pavlov, K. M., Lewis, R. A. & Kitchen, M. Phase retrieval using coherent imaging systems with linear transfer functions.Opt. Commun.234, 87–105 (2004).
54. Trivedi, R. & Kurz, W. Microstructure selection in eutectic alloy systems.Solidif. Process. Eutectic Alloy.3–34 (1988).
55. Jones, H. & Kurz, W. Relation of interphase spacing and growth temperature to growth velocity in fe-c and fe-fe3c eutectic alloys. Zeitschrift fur Met.72, 792–797 (1981).
56. Wagner, R. S. On growth of germanium dendrites. Acta Metall.8(1960).
57. Hamilton, D. R. & Seidensticker, R. G. Growth Mechanisms of Germanium Dendrites: Kinetics and the Nonisothermal Interface.J. Appl. Phys.34, 1450–1460 (1963).
58. Hogan, L. & Shamsuzzoha, M. Crystallography of the flake-fibre transition in the al-si eutectic.Mater. Forum10, 270–277 (1987).
59. Frazier, W. E. Metal additive manufacturing: A review.J. Mater. Eng. Perform.23, 1917–1928 (2014).
60. Polozov, I., Sufiiarov, V., Borisov, E., Popovich, A. & Masaylo, D. Producing hip implants of titanium alloys by additive manufacturing.Int. J. Bioprinting2, 78–84 (2016).
61. Tofail, S. A.et al.Additive manufacturing: scientific and technological challenges, market uptake and opportunities.Mater. Today21, 22 – 37 (2018).
62. US National Institute of Science and Technology Measurement Science Roadmap for Metal-Based Additive Manufacturing
(Energetics Incorporated, Columbia, Maryland, 2013).
63. Moniri, S. & Shahani, A. J. Chemical modification of degenerate eutectics: A review of recent advances and current issues.
J. Mater. Res.1–15 (2018).
64. Kieffer, J.-C., Fourmaux, S. & Krol, A. The ultrafast high-peak power lasers in future biomedical and medical x-ray imaging. In19th International Conference and School on Quantum Electronics: Laser Physics and Applications, vol. 10226, 1022612 (International Society for Optics and Photonics, 2017).
65. McGuffey, C.et al.On the properties of synchrotron-like X-ray emission from laser wakefield accelerated electron beams.
Phys. Plasmas25(2018).
66. Hooker, S.et al.Multi-pulse laser wakefield acceleration: a new route to efficient, high-repetition-rate plasma accelerators and high flux radiation sources. J. Phys. B: At. Mol. Opt. Phys.47, 234003 (2014).
67. Cowley, J.et al.Excitation and control of plasma wakefields by multiple laser pulses. Phys. Rev. Lett.119, 044802 (2017).
68. Gustas, D.et al.High-charge relativistic electron bunches from a khz laser-plasma accelerator. Phys. Rev. Accel. Beams 21, 013401 (2018).
69. Matsuoka, T.et al.Stimulated raman side scattering in laser wakefield acceleration. Phys. Rev. Lett.105, 034801 (2010).
70. Zhao, T.et al. High-flux femtosecond x-ray emission from controlled generation of annular electron beams in a laser wakefield accelerator.Phys. Rev. Lett.117, 094801 (2016).
71. Pollock, B.et al. Formation of ultrarelativistic electron rings from a laser-wakefield accelerator. Phys. Rev. Lett.115, 055004 (2015).
72. Wood, J. Betatron Radiation from Laser Wakefield Accelerators and its Applications. Ph.D. thesis, Imperial College London (2016).
73. Cole, J. Diagnosis and Application of Laser Wakefield Accelerators. Ph.D. thesis, Imperial College London (2016).
Acknowledgements
Minist´erio da Ciˆencia e Ensino Superior, Portugal under the contract POCI/FIS/59574/2004 and by the auspices of the US Department of Energy by Lawrence Livermore National Laboratory under the contract DE-AC52- 07NA27344, as well as Lawrence Livermore National Security, LLC, and DOE Early Career Research Prog. SCW1575/1. LLNL- JRNL-742178. We acknowledge the Paul Scherrer Institut, Villigen, Switzerland for provision of synchrotron radiation beamtime at the TOMCAT beamline X02DA of the SLS and would like to thank Julie Fife for assistance. The authors also thank the staff at the Central Laser Facility, Rutherford Appleton Laboratory for their assistance.
Author contributions statement
The experiment was conceived by A.E.H., A.G.R.T., A.J.S., F.A., S.P.D.M. and C.M.S. and was conducted by A.E.H., M.J.V.S., B.K. and Y.M., with assistance from S.J.D.D., N.B., S.C., J.M.C., E.G., I.G.G., N.L., N.C.L., C.L., M.S., M.S., R.S., D.R.S. and G.V. The data were analyzed by A.E.H, N.S., Y.M. and M.J.V.S, with assistance from J.C.W. and O.F. A.H., K.F., D.A.J., K.K., .O.L., Z.N., P.P.R. and L.W., contributed to planning and interpretation. The manuscript was written by A.E.H., N.S., Y.M., A.J.S., C.M.S. and A.G.R.T. All authors reviewed the manuscript.
Additional information
Competing financial interests:The authors declare no competing interests.
Data availability:The authors confirm that all of the data used in this study are available without restriction. Data can be obtained by contacting [email protected].
Figure Legend:
Figure 1:
Experimental details for X-ray imaging using a laser wakefield accelerator.
(a)Experimental layout. High energy electron and X-ray beams were produced by focusing the beam into a two-stage gas cell (seeMethods). Gold-coated Kapton tape was used to block the laser pulse following the interaction, and was replaced on each shot. A 1 T magnet was used to disperse the electron beam onto a scintillating LANEX screen, from which the electron beam was imaged using a CCD camera. Betatron X-rays passed through the Al-Si sample, which was mounted on a rotation and translation stage at a distance of 19.3 cm from the source. Measurements were made through a kapton vacuum window onto an Andor iKon 2048×2048 pixel CCD camera at a distance of 410 cm from the Al-Si sample.(b)Samples of typical electron beams with a quasi-monoenergetic peak energy and broad low-energy tails. These measurements were obtained at the same experimental conditions as the phase contrast images and betatron spectrum. Electron beam divergence is plotted on the left axis and a line-out of the electron number density (right axis) is overlaid.(c)A best-fit to the betatron X-ray spectrum from an Andor iKon X-ray camera was obtained using a 9-element filter array (seeMethods). Shaded error bars reflect the uncertainty in the critical energy over many shots due to shot-to-shot fluctuations in electron energy.
File:Hussein-1.jpg
Figure 2:
Al-Si sample investigated using a LWFA X-ray source.
(a)Optical microscope image of the Al-Si cylindrical sample imaged in LWFA experiments.(b)X-ray phase contrast image obtained with a LWFA, revealing a lamellar microstructure with an interphase spacing on the order of 1 - 3µm. A line-out from a region of interest in the phase contrast image is shown, indicating 2.7±0.3µm as an upper bound on the resolving power of this method.(c)A schematic showing growth of irregular eutectics whereβ represents the faceted phase (e.g., Si),
α is the non-faceted, higher volume fraction phase (e.g., Al), andlis the melt ahead of the interface. The microstructure is deemed irregular due to the difficulty or “stiffness” in changing the growth direction of the faceted phase. The inset shows the atomically diffuseαphase and the defect growth mechanism for the facetedβ phase. Retrieved with permission from Ref.32.
File:Hussein-2.jpg
Figure 3:
Measurement of the spatial resolution criterion for line profiles oriented from 0◦to 90◦.
The spatial resolution criterion is projected onto polar plots in (a) SLS and (b) LWFA projection images. Projection images are shown as insets. |S(k)|2is the spectral power of the detected signal. Raw images were resized to match the dissimilar
values of 1.017±0.01 px−1and 0.98±0.01 px−1in the LWFA and SLS images, respectively. Stars represent thek
resspatial
frequency value obtained along an arbitrary line in the projection image. Scale bar measures 70µm.
File:Hussein-3.jpg
Figure 4:
Blurring of LWFA X-ray images due to finite betatron emission length.
Three LWFA phase contrast images of the Al-Si sample are shown. In(a)and(b)the sample is at the same orientation perpendicular to the laser axis. In image(b)the sample has been translated horizontally by approximately 30µm. In(c)the sample has been rotated by 90 degrees about the vertical axis. Regions of sharpest resolution are circled with a dotted line, with a radius of approximately 600µm at highest focus. In all images, blurring can be observed on the order of a millimeter away from the central point due to the emission length of the betatron source. Highest resolution imaging is obtained along the axis of the electron beam; only this section of the image is used for resolution analysis. Blurring due to the emission length of the X-ray source is not unique to betatron sources, also occurring with conventional synchrotron beams, but is exacerbated by high magnification in cases where the full beam is used for imaging.
File:Hussein-4.jpg
Figure 5:
Critical energy of the LWFA betatron source.
a)Experimentally measured critical energy of the LWFA X-ray beam as a function of plasma density.(b)Theoretical predictions of the maximum electron energy corresponding to experimentally measured critical energy, shown for betatron source sizes of (0.2 - 1.0)µm along with experimentally measured maximum electron energies in the resultant LWFA beam (black).
File:Hussein-5.jpg
Figure 6:
CAD model of the variable length two-stage gas cell used in LWFA experiments.
A two-stage gas cell with a 3 mm first stage for ionization injection and a variable length second stage was used in LWFA experiments. A 45◦wall in the second stage enabled variation of the length of the second stage (between 2 to 21 mm) using linear motor controls to vary the vertical position of the cell.
File:Hussein-6.jpg
Figure 7:
Electron beam profiles.
Electron spectra obtained for 42 consecutive laser shots at identical experimental conditions.
File:Hussein-7.jpg
Figure 8:
Geometric layout of a X-ray illumination setup without optics.
The distance from the source,soto the object,O, isx1, and the distance from the object to the detector,D, isx2.