RESEARCH
Decrease of the DNA methylation levels
of the
ADRB3
gene in leukocytes is related
with serum folate in eutrophic adults
Yohanna de Oliveira
1*, Raquel Patrícia Ataíde Lima
1, Rafaella Cristhine Pordeus Luna
1,
Mussara Gomes Cavalcanti Alves Monteiro
1, Cássia Surama Oliveira da Silva
1,
Rayner Anderson Ferreira do Nascimento
2, Keylha Querino de Farias Lima
1, Ana Hermínia Andrade e Silva
3,
Flávia Emília Leite de Lima Ferreira
1, Rodrigo Pinheiro de Toledo Vianna
1, Ronei Marcos de Moraes
3,
Naila Francis Paulo de Oliveira
4, Aléssio Tony Cavalcanti de Almeida
5, Alexandre Sérgio Silva
1,
Alcides da Silva Diniz
6, Maria José de Carvalho Costa
1and Maria da Conceição Rodrigues Gonçalves
1Abstract
Background: DNA methylation has been evidenced as a potential epigenetic mechanism related to various candi-date genes to development of obesity. Therefore, the objective of this study was to evaluate the DNA methylation levels of the ADRB3 gene by body mass index (BMI) in a representative adult population, besides characterizing this population as to the lipid profile, oxidative stress and food intake.
Methods: This was a cross-sectional population-based study, involving 262 adults aged 20–59 years, of both genders, representative of the East and West regions of the municipality of João Pessoa, Paraíba state, Brazil, in that were evalu-ated lifestyle variables and performed nutritional, biochemical evaluation and DNA methylation levels of the ADRB3 gene using high resolution melting method. The relationship between the study variables was performed using analyses of variance and multiple regression models. All results were obtained using the software R, 3.3.2.
Results: From the stratification of categories BMI, was observed a difference in the average variables values of age, waist-to-height ratio, waist-to-hip ratio, waist circumference, triglycerides and intake of trans fat, which occurred more frequently between the categories “eutrophic” and “obesity”. From the multiple regression analysis in the group of eutrophic adults, it was observed a negative relationship between methylation levels of the ADRB3 gene with serum levels of folic acid. However, no significant relation was observed among lipid profile, oxidative stress and food intake in individuals distributed in the three categories of BMI.
Conclusions: A negative relationship was demonstrated between methylation levels of the ADRB3 gene in eutrophic adults individuals with serum levels of folic acid, as well as with the independent gender of BMI, however, was not observed relation with lipid profile, oxidative stress and variables of food intake. Regarding the absence of relationship with methylation levels of the ADRB3 gene in the categories of overweight, mild and moderate obesity, the answer probably lies in the insufficient amount of body fat to initiate inflammatory processes and oxidative stress with a direct impact on methylation levels, what is differently is found most of the times in exacerbated levels in severe obesity.
Keywords: ADRB3, DNA methylation, Body mass index, Folic acid
© The Author(s) 2018. This article is distributed under the terms of the Creative Commons Attribution 4.0 International License (http://creat iveco mmons .org/licen ses/by/4.0/), which permits unrestricted use, distribution, and reproduction in any medium, provided you give appropriate credit to the original author(s) and the source, provide a link to the Creative Commons license, and indicate if changes were made. The Creative Commons Public Domain Dedication waiver (http://creat iveco mmons .org/ publi cdoma in/zero/1.0/) applies to the data made available in this article, unless otherwise stated.
Open Access
*Correspondence: [email protected]
1 Health Sciences Center (Centro de Ciências da Saúde), Departament
of Nutrition, Federal University of Paraíba (Universidade Federal da Paraíba), João Pessoa, Brazil
Background
Obesity is considered a serious public health problem, affecting 39% of the world population [1]. The epidemic projection is that by 2025, more than 2 billion adults are overweight or obese [2].
Multiple biological, behavioural, genetic and epigenetic determinants are contributing to the multifactorial aetiol-ogy of obesity, for example, sleep disturbances, potential traits of obesogenic behavior, characterized by excess cal-orie intake and sedentary lifestyle, peripheral and central regulation of energy balance, adipose tissue and skeletal muscle biology, in addition to changes from the gut micro-biota, hormone signalling, reproductive factors, drugs, and intrauterine and epigenetic intergenerational effects [3].
Increasing evidence indicates that epigenetic modifica-tions in adipose tissue may be involved in pathogenesis of metabolic disorders, fat storage, cell remodeling and adi-pogenesis, emphasizing the involvement of DNA meth-ylation in differentiation of adipocytes and its effect on expression of genes related to obesity [4].
DNA methylation is the most frequent and well-characterized epigenetic mark, for playing a key role on regulating gene expression and at molecular phenotype, without any change in the sequence of DNA, it can be altered by environmental expositions and genetic influ-ences [5]. In addition, folate is a water-soluble B vitamin which plays an important role as donor of methyl groups required for proper epigenetic regulation [6].
Another complexity encountered in studying obesity is the marked heterogeneity of obese individuals, through the notable differences in body configuration and in the regional accumulation of body fat in adiposity levels, such as subcutaneous obesity, in which excess subcuta-neous fat is found around the hip and thigh areas, and visceral obesity, in which fat is mainly concentrated in the abdominal region, mainly mesenteric adipose tissue. Visceral obesity, also known as the excess of visceral adi-pose tissue (VAT), tends to be more pernicious in health terms, being a potential factor for cardiovascular risk [7].
Recently, it was demonstrated the modification in methylation levels of candidate genes to development of obesity exhibited a relation excellent in the discrimi-nation of obesity from non-obesity status, thus suggest-ing that DNA methylation levels in blood leukocytes has great potential for to characterize the obesity phenotype by to identify robust and biologically relevant epigenetic variation related to body mass index (BMI), using an eas-ily accessible and minimally invasive biological material instead of adipose tissue [8].
Interestingly, the beta-3 adrenergic receptor (ADRB3) is located on chromosome 8, which contains two exons and 2.252 base pairs, and is known to play a key role in the regulation of lipolysis in white and brown adipose tissues,
which provides free fatty acids for thermogenesis, indi-cating the participation of the ADRB3 gene in the regula-tion of body weight in humans [9]. However, the role of the DNA methylation of the ADRB3 gene related to the increase of susceptibility to visceral obesity and alter the body fat distribution have not been fully elucidated yet.
In this context, the present study aims to evaluate the methylation levels of the ADRB3 gene by BMI in a repre-sentative adult population, in addition to characterizing this population as to the lipid profile, oxidative stress and food intake.
Methods
Study design
This is a cross-sectional epidemiological study linked to the project titled: “II Cycle of Diagnosis and Intervention of Food and Nutritional Status and the Most Prevalent Non-Communicable Diseases in the Population of the Municipality of João Pessoa/PB” (II Ciclo de Diagnóstico e Intervenção da Situação Alimentar, Nutricional e das Doenças não Transmissíveis mais Prevalentes da Popu-lação do Município de João Pessoa/PB, II DISANDNT/PB), which was conducted between May 2015 and May 2016.
Ethical issues
The research protocol of the project mentioned above, to which the present study is linked, was submitted and approved by the Research Ethics Committee of the Health Sciences Center (Centro de Ciências da Saúde, CCS) of the Federal University of Paraíba (Universidade Federal da Paraíba, UFPB), under the Protocol Number 0559/2013, in accordance with the ethical standards for research involving human beings included in Resolution 466 of the December 12, 2012, meeting of the National Health Council/National Research Ethics Committee.
After identifying the residences in randomly selected city blocks located in the East and West areas of the city of João Pessoa, the researchers introduced themselves to the residents, explaining the purpose of the study and requesting their participation. To respect ethical guide-lines for research involving humans, the participants residing in the selected households were included in the study only when they had consented to participation by signing the Informed Consent form.
Sampling
IBGE) [10]. In the present study, two regions (East and West) with similar socioeconomic, epidemiological and lifestyle characteristics in relation to the other regions were selected in order to represent the four regions of the municipality.
For the sample calculation, a single multi-level sampling procedure was used. Due to the presence of heterogeneity in income and the relationship between income, disease prevalence and nutrition [11], stratified sampling was used [12] with the city blocks at the first level. In this level, the neighborhoods/city blocks of the East and West zones of the municipality were ranked by income class into four strata according to information obtained from the IBGE [10].
After stratification, the sample size, or number of rep-resentative city blocks per zone, was calculated. Next, the weight of each stratum was calculated as the number of city blocks per zone according by strata, according to the formula defined by Silva, Moraes and Costa [13].
Considering that the average income of adults in the East and West areas was R$2213.26 [data obtained from “The first cycle of diagnoses and intervention of the food and nutritional situation, and of the most prevalent com-municable diseases of the municipal population of João Pessoa/PB” (07/2008-01/2010)], with a standard devia-tion of R$2601.93 and a margin of error of R$3320.00 in income, the minimum sample of adults in João Pessoa necessary to be statistically representative of the east-ern and westeast-ern areas (with a confidence level of 95%) was 236 adults. Thus, a sample of 262 adults distributed across the study area was selected.
This study had the following inclusion criteria: individu-als aged 20–59 years; different socioeconomic conditions, and medication users and non-users, with the exception of the drugs described below. Exclusion criteria included the following: individuals with neuropsychiatric disorders; multivitamin, mineral, anorexigen, and anabolic supple-ment users; and pregnant and lactating women.
Data collection
The household visits and application of the questionnaires were conducted by graduate students of the Nutrition Programs. These are Master’s and doctoral students in the Post Graduate Program in Nutrition Sciences (Programa de Pós Graduação em Ciências da Nutrição, PPGCN) at UFPB who were trained before initiating data collection after the pilot study was conducted. Questionnaires were applied for demographic, socioeconomic, and epidemio-logical characterization, lifestyle, nutritional and food intake assessment, and also biochemical evaluation.
Nutritional assessment
Weight and height measurements were taken in tripli-cate, and the average of the three values was used. The
BMI was then calculated using the body weight (kg) divided by the squared body height (meters), and the cut-off points recommended in adults aged 20–59 years old by the World Health Organization (WHO) were used [14].
Waist circumference (WC) was used to determine abdominal obesity, proceeding the American Heart Association (AHA) cut-off points of ≥ 88 cm in women and ≥ 102 cm in men [15]. The waist-hip ratio (WHR) was used to define the abdominal obesity status, defined as a WHR > 0.90 in men and > 0.85 in women [16].
The waist-to-height ratio (WHtR) was based on the quotient of the waist and height measurements in cen-timeters. The cut-off point used was 0.5, as supported by studies conducted around the world in diverse popu-lation as an evaluation tool to identify health risks and related morbidities [17].
Dietary assessment
To evaluate the regular food intake of the individuals, three 24-h dietary recalls (24HR) were performed, con-templating one at the weekend, with a 15-day interval from the beginning of the data collection, according to a study previously published [18].
Biochemical analysis
The blood samples were collected from the individu-als after a 12-h fasting at home by an experienced nurse, and the analysis of biochemical variables were performed according to a study previously published [18]. The analysis of alpha-1 acid glycoprotein (AGP) was meas-ured using the immunoturbidimetry technique and tests were performed in an automated analyzer (LabMax 240, Labtest, Lagoa Santa, MG, Brazil) using standardized kit following the instructions provided by the manufacturer (Labtest, Lagoa Santa, MG, Brazil).
Analysis of DNA methylation levels
The leukocyte DNA was isolated, quantified and trans-formed with sodium bisulfite according to the condi-tions described in a previously published study [18].
To identify the existence of statistically significant rela-tionships between DNA methylation levels of the ADRB3 gene and variables of this study, the following multiple linear regression models were used:
Model 1:
Model 2:
Considering 5% as significance.
Results
The sample comprised 262 adults individuals, being 175 female (66.79%) and 87 males (33.21%).
In Table 1, it was performed the multiple comparison testing of means for each variable, through the ANOVA test, it was observed a difference in mean variables values described below, in relation to nutritional status: aver-age aver-age, waist-to-height ratio (WHtR), waist-to-hip ratio (WHR), waist circumference (WC), triglycerides and intake of trans fat. It is relevant to mention that methyla-tion levels did not differ significantly by nutrimethyla-tional status.
To know which of BMI categories there was a significant difference, Tukey’s test was performed, which occurred more frequently between the categories “eutrophic” and “obesity”.
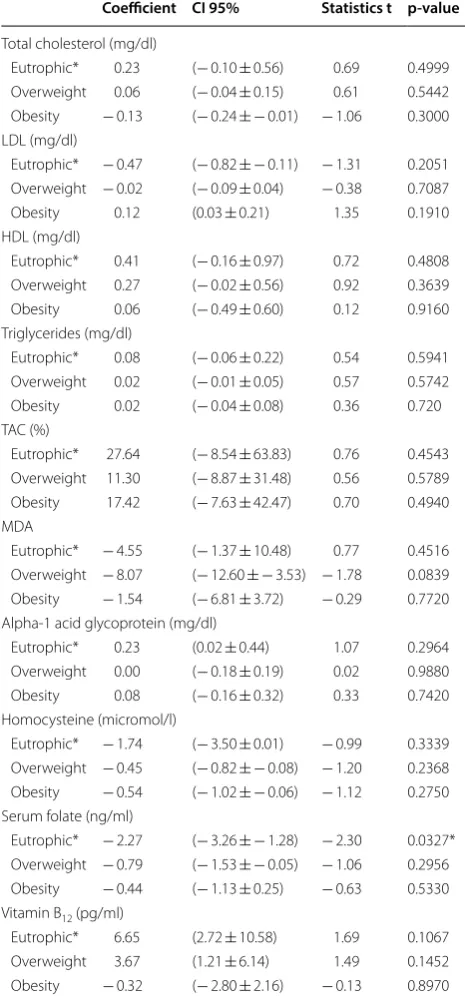
No significant association was observed among the vari-ables methylation levels of ADRB3 gene with lipid profile and oxidative stress in nutritional status of eutrophic, over-weight or obesity. However, it was observed that methyla-tion levels of ADRB3 gene were negatively associated with serum levels of folic acid in the eutrophic adults group; when folic acid values increased by 1 ng/ml, methylation levels decreased in mean, 2.27% (p-value = 0.0327 < 0.05), according showed in Table 2. When applied multiple regression based on model 1 including age and gender fac-tors in the three categories of BMI observed that there was only relationship for methylation levels and male gender in eutrophics (Additional file 1). This result means that, on average, eutrophics males have 0.1527 more methylation levels than females (p-value = 0.0070 < 0.05).
Regarding the results of multiple regression based on model 2 described previously ont food intake, was not Methylation levels =β0 + β1 ∗Total cholesterol + β2 ∗ LDL + β3 ∗ HDL
+ β4 ∗ Triglycerides + β5 ∗ Homocysteine+ β6 ∗TAC + β7 ∗MDA
+ β8 ∗Alpha-1 acid glycoprotein + β9 ∗Folic acid+ β10∗ Vitamin B12.
Methylation levels =β0 + β1 ∗Calories + β2 ∗Total fat + β3 ∗Folate
+ β4 ∗ Vitamin B12 + β5 ∗ Monounsaturated fat+ β6 ∗Oleic acid
+ β7 ∗Omega 3 + β8 ∗Omega 6 + β9 ∗Saturated fat + β10∗ Cholesterol
+ β11∗ Polyunsaturated fat + β12 ∗Trans fat.
The analysis of methylation levels in genomic DNA from blood was performed by High Resolution Melting (HRM) Real Time PCR method in a applied biosystems 7500 fast system. PCR was performed in a total volume of 20 μl containing: 1× buffer, 4 mM Mg2+, 200 μM of each dNTPs (Qiagen), 250 nM of each primer, 5 μM SYTO® (Invitrogen), 1 U HotstarTaq DNA Polymerase (Qiagen) and 1 μl of bisulfite-modified DNA. Primers were designed from the genome sequence deposited in the UCSC genome browser http://genom e-euro.ucsc. edu/(chr8:37,962,991-37,966,965), F:5′-TAG GTG ATT TGG GAG ATT TTT TTT -3′ and R:5′-CCC CTA ACA ACC CAC TAA TAT TAA C-3′. The PCR program con-sisted of an initial enzymatic activation at 95 °C for 10 min, followed by 50 cycles of 45 s at 95 °C, 45 s at 60 °C and 45 s at 72 °C and the final extension at 72 °C for 10 min. The melting curves were normalized by cal-culation of the ‘line of best fit’ in between two normali-zation regions before and after the major fluorescence decrease representing the melting of the PCR product using the software provided with the HRM Software v2.0, provided by 7500 fast system.
Statistical analysis
Table 1 Characteristics of adults population by nutritional status of the municipality of João Pessoa/PB/Brazil
a Significant difference in mean values of the variable between obese and eutrophic individuals (p-value Tukey’s test < 0.05) b Significant difference in mean values of the variable between overweight and eutrophic individuals (p-value Tukey’s test < 0.05) c Significant difference in mean values of the variable between obese and overweight individuals (p-value Tukey’s test < 0.05)
Parameter Eutrophic (43.51%) Overweight (36.26%) Obesity (20.23%) p-value
Methylation levels (%)
Mean ± SD 43.29 ± 19.14 39.32 ± 17.57 42.74 ± 17.29 0.6020
Average age
Mean ± SD 35.07 ± 11.83
ab 41.78 ± 12.52b 42.23 ± 11.58a 0.0002*
WHtR (cm/cm)
Mean ± SD 0.40 ± 0.16
ab 0.55 ± 0.06bc 0.61 ± 0.15ac > 0.0000*
WHR (cm/cm)
Mean ± SD 0.79 ± 0.08
ab 0.87 ± 0.09b 0.92 ± 0.09a > 0.0000*
WC (cm)
Mean ± SD 74.45 ± 9.45
ab 89.48 ± 8.67bc 101.52 ± 13.90ac > 0.0000*
Total cholesterol (mg/dl)
Mean ± SD 175.15 ± 35.63 195.73 ± 45.19 199.40 ± 43.48 0.9460
LDL (mg/dl)
Mean ± SD 97.74 ± 47.71 112.03 ± 56.16 112.54 ± 62.30 0.1050
HDL (mg/dl)
Mean ± SD 45.84 ± 11.70 41.45 ± 10.46 42.87 ± 10.31 0.2740
Triglycerides (mg/dl)
Mean ± SD 120.39 ± 63.78
a 158.10 ± 93.39 158.33 ± 73.90a 0.0241*
TAC (%)
Mean ± SD 41 ± 15 41 ± 14 42 ± 15 0.6880
MDA
Mean ± SD 2.75 ± 0.99 2.98 ± 0.89 2.93 ± 0.75 0.6330
Alpha-1 acid glycoprotein (mg/dl)
Mean ± SD 63.96 ± 20.86 64.66 ± 17.67 68.02 ± 16.45 0.2020
Homocysteine (micromol/l)
Mean ± SD 11.42 ± 12.40 10.31 ± 6.43 10.69 ± 6.25 0.3540
Serum folate (ng/ml)
Mean ± SD 14.23 ± 5.47 13.67 ± 4.87 14.70 ± 5.74 0.5660
Vitamin B12 (pg/ml)
Mean ± SD 277.67 ± 136.74 261.83 ± 113.45 289.23 ± 126.91 0.0936
Total fat (g)
Mean ± SD 55.12 ± 29.94 58.85 ± 52.14 58.47 ± 46.68 0.8810
Calories (Kcal)
Mean ± SD 1805.16 ± 695.07 1829.67 ± 1012.35 1954.71 ± 1815.64 0.7160
Dietary folate (mcg)
Mean ± SD 170.58 ± 174.83 139.58 ± 111.68 126.53 ± 89.34 0.5640
Vitamin B12 (mcg)
Mean ± SD 2.10 ± 1.53 1.86 ± 1.59 2.01 ± 1.64 0.1370
Monounsaturated fat (g)
Mean ± SD 14.50 ± 8.46 16.43 ± 13.80 15.07 ± 11.68 0.9240
Oleic acid (g)
Mean ± SD 9.59 ± 7.33 12.03 ± 12.19 11.09 ± 10.75 0.7780
Omega 3 (g)
Mean ± SD 0.64 ± 0.95 0.61 ± 0.63 0.68 ± 0.89 0.4100
Omega 6 (g)
Mean ± SD 5.81 ± 4.96 6.81 ± 5.64 8.44 ± 14.17 0.2660
Saturated fat (g)
Mean ± SD 17.33 ± 10.69 18.42 ± 17.72 16.85 ± 13.36 0.6750
Cholesterol (mg)
Mean ± SD 264.93 ± 264.93 258.18 ± 224.64 226.09 ± 171.47 0.9460
Trans fat (g)
Mean ± SD 0.75 ± 1.60
[image:5.595.65.539.102.672.2]observed significative relationship between methylation levels of ADRB3 gene and food intake in the three catego-ries of BMI (Additional file 1).
Discussion
In the present study, it was observed that methylation levels of ADRB3 gene were negatively associated with serum levels of folic acid in adult eutrophic individuals. Noting that as serum levels of folic acid in eutrophic indi-viduals increases, methylation levels decreases. However, no significant relationship was observed among lipid pro-file, oxidative stress and food intake in individuals dis-tributed in the three categories of BMI.
Although the mechanism responsible have not been elucidated yet, higher serum folic acid concentrations were associated with lower DNA methylation levels of ADRB3 gene in eutrophic individuals, which may repre-sent a protective effect for obesity. This finding in accord-ance with the results of a study that demonstrated that higher serum folic acid concentrations is associated with lower levels of DNA methylation in leukocytes in women with normal weight, and with a distinctive epi-genetic response in women with obesity, providing novel evidences that the adequate folate metabolism may be affected by obesity, due probably to the volumetric dilu-tion, resulting in a redistribution of the vitamin from cir-culation into tissue [6].
Considering the difference between the forms and bio-availability of folates, the folate family of compounds include folic acid and its derivatives which include 5- methyltetrahydrofolate (5-MTHF), 5-formyltetrahy-drofolate (5-FTHF or folinic acid), 10-formyl-THF, 5,10-methylene-THF and unsubstituted THF. Folic acid, a synthetic oxidized form of folate, is used in supplements and added to food because of its high stability and bio-availability. Folinic acid is a 5-formyl derivative of THF. Unlike the synthetic folate, folinic acid is naturally found in food. It is readily converted to THF without requir-ing the action of the enzyme dihydrofolate reductase (DHFR). Therefore its function as a vitamin is unaffected by drugs inhibiting this enzyme, such as methotrexate. 5-MTHF is a biologically active form of folate and is the most abundant form found in plasma, representing > 90% of folate and is the predominant active metabolite of ingested folic acid [20].
Given the paucity of research on the different BMI cat-egories relating methylation levels in leukocytes in adults of the same population, this study represents the first effort on searching for differences in methylation levels of the ADRB3 gene in varying degrees of obesity, which may help to understand of relations with different categories of the BMI variable.
While it is well-known that central to the pathophysiol-ogy of obesity is an excess amount of adiposity, on BMI (which does not directly estimate body fat) still prevails as the most used indicator of adiposity worldwide, for practical reasons, comparability and ease to measure Table 2 Multiple regression analysis of methylation levels
of the ADRB3 gene with lipid profile and oxidative stress of adult individuals by nutritional status
* Eutrophic: after adjustment for sex and age significant relationships remained for methylation levels and male gender
Coefficient CI 95% Statistics t p-value
Total cholesterol (mg/dl)
Eutrophic* 0.23 (− 0.10 ± 0.56) 0.69 0.4999
Overweight 0.06 (− 0.04 ± 0.15) 0.61 0.5442
Obesity − 0.13 (− 0.24 ±− 0.01) − 1.06 0.3000
LDL (mg/dl)
Eutrophic* − 0.47 (− 0.82 ±− 0.11) − 1.31 0.2051 Overweight − 0.02 (− 0.09 ± 0.04) − 0.38 0.7087
Obesity 0.12 (0.03 ± 0.21) 1.35 0.1910
HDL (mg/dl)
Eutrophic* 0.41 (− 0.16 ± 0.97) 0.72 0.4808
Overweight 0.27 (− 0.02 ± 0.56) 0.92 0.3639
Obesity 0.06 (− 0.49 ± 0.60) 0.12 0.9160
Triglycerides (mg/dl)
Eutrophic* 0.08 (− 0.06 ± 0.22) 0.54 0.5941
Overweight 0.02 (− 0.01 ± 0.05) 0.57 0.5742
Obesity 0.02 (− 0.04 ± 0.08) 0.36 0.720
TAC (%)
Eutrophic* 27.64 (− 8.54 ± 63.83) 0.76 0.4543
Overweight 11.30 (− 8.87 ± 31.48) 0.56 0.5789
Obesity 17.42 (− 7.63 ± 42.47) 0.70 0.4940
MDA
Eutrophic* − 4.55 (− 1.37 ± 10.48) 0.77 0.4516
Overweight − 8.07 (− 12.60 ±− 3.53) − 1.78 0.0839
Obesity − 1.54 (− 6.81 ± 3.72) − 0.29 0.7720
Alpha-1 acid glycoprotein (mg/dl)
Eutrophic* 0.23 (0.02 ± 0.44) 1.07 0.2964
Overweight 0.00 (− 0.18 ± 0.19) 0.02 0.9880
Obesity 0.08 (− 0.16 ± 0.32) 0.33 0.7420
Homocysteine (micromol/l)
Eutrophic* − 1.74 (− 3.50 ± 0.01) − 0.99 0.3339 Overweight − 0.45 (− 0.82 ±− 0.08) − 1.20 0.2368
Obesity − 0.54 (− 1.02 ±− 0.06) − 1.12 0.2750
Serum folate (ng/ml)
Eutrophic* − 2.27 (− 3.26 ±− 1.28) − 2.30 0.0327* Overweight − 0.79 (− 1.53 ±− 0.05) − 1.06 0.2956
Obesity − 0.44 (− 1.13 ± 0.25) − 0.63 0.5330
Vitamin B12 (pg/ml)
Eutrophic* 6.65 (2.72 ± 10.58) 1.69 0.1067
Overweight 3.67 (1.21 ± 6.14) 1.49 0.1452
[image:6.595.56.289.127.627.2]weight and height [7]. To refine risk assessment, BMI could be complemented by also measuring WC to dis-criminate between subcutaneous obesity and visceral obesity, the ratio of WHR circumferences and the WHtR, this latter being a clinical indicator supporting of health risk, revealing that the accumulation of VAT and abdom-inal subcutaneous fat is strongly associated with cardio-metabolic risk [21].
Obesity is a heterogeneous disease with many differ-ent subtypes and DNA methylation might contribute to these differences [22]. Although few researchers have investigated the relationship of the ADRB3 gene and its role in susceptibility to obesity, only three studies on methylation were found in the literature consulted, being the first performed with methylation of ADRB3 gene in severely obese men [23], the second with methylation in VAT in obese and slim individuals [9], and the third with methylation in overweight and obese adult women [18].
In this context, Guay et al. [23] demonstrated that higher DNA methylation levels of ADRB3 gene in blood were significantly associated with a lower WHR and lower LDL cholesterol levels in severely obese men. Besides that, ADRB3 g.-843C>T and p.W64R polymor-phisms were found to be strongly associated with ADRB3 DNA methylation, reinforcing the impact of both, muta-tions as well as DNA methylation at the ADRB3 gene promoter.
It has also been postulated that the Trp64Arg ADRB3 genetic variant is associated with 3.9 increase in BMI, and these associations were observed mainly in East Asian populations. In contrast, lower gene expression of the ADRB3 gene in Caucasians and its relationship with higher propensity to obesity and related comorbidities are still controversial [24].
It was reported that the decrease in expression of ADRB3 gene in VAT is associated with obesity, but not with the hypermethylation, demonstrating that the aver-age levels of methylation of this gene in VAT was simi-lar in slim individuals and with obesity from grade III [9], corroborating with the present study regarding the absence of difference of the methylation levels of the ADRB3 gene in leukocytes for different categories of BMI. Thus, the identification in blood such as biomarker easily accessible of the DNA methylation instead of adi-pose tissue is a promising alternative in the epigenetics field, but still challenging.
However, these findings do not apply to the present study, un precedented regarding methylation levels of the ADRB3 gene in leukocytes in a representative adult pop-ulation of both genders by BMI categories. As it does not exist in literature searching studies classifying the popu-lation based in the three categories of BMI and methyla-tion levels of the ADRB3 gene for comparative purposes,
it is suggested that probably other factors have influenced the results such as sample size and non-stratification by gender. It is also important to mention that differ-ent blood cell populations may presdiffer-ent differdiffer-ent meth-ylation profiles, as already shown for genes implicated in immune-related disorders [25], however we do not know if this is applicable to the ADRB3 gene.
Nevertheless, when the gender was analyzed isolated in relation to the methylation profile of ADRB3 gene, it was observed that males showed higher methyla-tion levels than female (46.40 ± 18.81 and 39.42 ± 17.54 respectively, p = 0.0037; Mann–Whitney). On the other hand, when it evaluated the difference between levels of methylation by age groups no significant results were found (20–39 years old: 42.04 ± 19.12, 40–59 years old: 41.40 ± 17.27; p = 0.9310; Mann–Whitney); (20–30 years old: 39.95 ±18.63, 31–40 years old: 45.70 ± 19.60, 41–50 years old: 44.39 ±17.28, 51–59 years old: 39.10 ± 17.04; p = 0.1338; Kruskal–Wallis). Indeed, the literature shows that in spite of external factors such as diet [18], smoking [26], alcohol consumption [27] and air pollution [28], inner factors such as age and gender have also influence on the DNA methylation profile. Differ-ences in the profile of DNA methylation between males and female have already been observed in skin for miR -137 gene [29] and in buccal cells for MMP9 and TIMP -1 genes [30]. It is noteworthy that sex hormones may regulate DNA methylation differentially in the context of different tissues, developmental stages, and pathological conditions [31].
On the other hand, it is relevant to mention that it was not detectable a relation between the methylation levels of the ADRB3 gene with overweight and obesity, since some studies have shown that these relations are more prominent in severe obesity (grade III e IV) [9, 23]. Sug-gesting that, in overweight, mild and moderate obesity (grade I e II), the state in which starts triggers the inflam-matory cascade and the impacts of oxidative stress, the amount of adiposity is still insufficient to influence the epigenetic marks and result in alterations in phenotype.
In this context, some issues on the molecular level should be considered. Firstly, methylation may not be the chief mechanism involved in the regulation of activ-ity of that gene in blood. Secondly, the analyzed regions, although carefully chosen, may not be crucial for the regulation of gene expression [9]. Thus, the impact of the methylation levels on ADRB3 gene and its relation-ship with lipid profile variables and oxidative stress might be better elucidated through further studies of gene expression.
In summary the beta-adrenergic receptor 3 encoded by the ADRB3 gene is involved in the regulation of lipoly-sis and thermogenelipoly-sis mainly in adipose tissue which provides free fatty acids for thermogenesis, indicating the participation of the ADRB3 gene in the regulation of body weight in humans. In the present study we analysed blood tissue and it is important to mention that blood is metabolically active tissue, with an important role in the adverse inflammatory and vascular consequences of adiposity, and is widely used for clinical diagnostic pur-poses [5]. It has been suggested that polymorphisms in beta 3 adrenoreceptor signal transduction, binding, or regulatory mechanism may result in diminished lipolytic response [33]. In relation to association to ADRB3 meth-ylation profile and body weight the studies are still scarce and this relation needs to be further studied.
Some limitations of the present study are relevant. Regarding the absence of relationship with lipid pro-file, oxidative stress and food intake, probably did not occured due to the higher prevalence of eutrophic indi-viduals, lower prevalence of obesity from the degree III, and the status of all variables studied situated around 90% in reference values in the total sample. And as the obeses group was composed mostly by individuals with mild and moderate obesity (grade I e II), there was no representa-tive group of severe obesity (grade III and IV) (n = 5) in present study. In addition, a stratification by nutritional status according with gender was not performed, reflect-ing the methylation levels of the ADRB3 gene in leuko-cytes based in a representative adult population of both genders.
Conclusions
In conclusion, it was demonstrated a negative relation-ship between methylation levels of the ADRB3 gene in individuals eutrophic adults with serum levels of folic acid, as well as with the independent gender of BMI, however, it was not observed relationship between lipid profile, oxidative stress and food intake in individuals dis-tributed in the three categories of BMI.
Regarding the absence of relationship with methylation levels of the ADRB3 gene in the categories of overweight,
mild and moderate obesity, the answer probably lies in the insufficient amount of body fat to initiate inflamma-tory processes and oxidative stress with a direct impact on methylation levels, what differently is found most times in exacerbated levels in severe obesity.
Abbreviations
5-FTHF: 5-formyltetrahydrofolate; 5-MTHF: 5-methyltetrahydrofolate; II DIS-ANDNT/JP: Second Cycle of Diagnosis and Intervention on the Diet, Nutrition and Most Prevalent Noncommunicable Diseases among the Population of João Pessoa, Paraiba; ADRB3: gene encoding beta-3 adrenergic receptor; AHA: American Heart Association; BMI: body mass index; DHFR: dihydrofolate reduc-tase; HDL: high density lipoprotein; HRM: high resolution melting; LDL: low density lipoprotein; MDA: malondialdehyde; PCR: polymerase chain reaction; PPGCN: Post Graduate Program in Nutrition Sciences; R24h: 24-hour dietary recall; RBC: red blood cells; TAC : total antioxidant capacity; TC: total cholesterol; WC: waist circumference; WHO: World Health Organization; WHR: waist-to-hip ratio; WHtR: waist-to-height ratio; UFPB: Federal University of Paraíba; VAT: visceral adipose tissue.
Authors’ contributions
YdeO contributed to data acquisition and interpretation, and writing of the manuscript. RPAL coordinated the DNA methylation analyses, contributed to data to data management and DNA methylation tests. RCPL, MGAM, CSOdaS and KQFL contributed to data management. NFPdeO was involved in the interpretation and critical review of the manuscript. RPdeTV, FELdeLF and MdaCRG contributed to the analysis of food consumption. ASdaS and RAFdoN contributed to the biochemical analyses. ASD was involved in the development of the manuscript or in the critical review of relevant intellectual content. AHAeS, ATCA and RMdeM contributed to the study design and statistical analysis. MJdeCC contributed to the study design, statistical analysis, data interpretation, and writing of the manuscript; she coordinated data collection and was involved in the development of the manuscript or in the critical review of relevant intellectual content. All authors read and approved the final manuscript.
Author details
1 Health Sciences Center (Centro de Ciências da Saúde), Departament
of Nutrition, Federal University of Paraíba (Universidade Federal da Paraíba), João Pessoa, Brazil. 2 Center of Exact Sciences and Nature (Centro de Ciências
Exatas e da Natureza), Federal University of Paraíba (Universidade Federal da Paraíba), João Pessoa, Brazil. 3 Departament of Statistics, Center of Exact
Sci-ences and Nature (Centro de Ciências Exatas e da Natureza), Federal University of Paraíba (Universidade Federal da Paraíba), João Pessoa, Brazil. 4
Departa-ment of Molecular Biology, Center of Exact Sciences and Nature (Centro de Ciências Exatas e da Natureza), Federal University of Paraíba (Universidade Federal da Paraíba), João Pessoa, Brazil. 5 Department of Economics, Center
for Applied Social Sciences (Centro de Ciências Sociais Aplicadas), Federal University of Paraíba (Universidade Federal da Paraíba), João Pessoa, Brazil.
6 Departament of Nutrition, Health Sciences Center (Centro de Ciências da
Saúde), Federal University of Pernambuco (Universidade Federal de Pernam-buco), Recife, Brazil.
Acknowledgements
We would like to acknowledge the professor Ph.D. José Luiz de Brito Alves (Federal University of Paraíba), who was involved in the critical review of the manuscript. The funding agencies that enabled the project (National Council of Scientific and Technological Development (CNPq), Ministry of Health and Research Support Foundation of the State of Paraíba (FAPESQ, PB, Brazil); and research collaborators (Post Graduate Program in Nutrition Sciences, Federal University of Paraíba).
Additional file
Competing interests
The authors declare that they have no competing interests.
Availability of data and materials
The data generated in this study are coordinated by Ph.D. Maria José de Carvalho Costa.
Consent for publication
Not applicable.
Ethics approval and consent to participate
The study was approved by the Research Ethics Committee of the Center of Health Sciences (CCS), Federal University of Paraíba, under the Protocol Num-ber 0559/13. All subjects gave their written informed consent.
Funding
The funding agencies that enabled the project (National Council of Scientific and Technological Development (CNPq), Ministry of Health and Research Sup-port Foundation of the State of Paraíba (FAPESQ, PB, Brazil) under the Number EFP_00008187.
Publisher’s Note
Springer Nature remains neutral with regard to jurisdictional claims in pub-lished maps and institutional affiliations.
Received: 14 February 2018 Accepted: 28 May 2018
References
1. WHO (World Health Organization). Obesity and overweight. Fact sheets. http://www.who.int/news-room/fact-sheet s/detai l/obesi ty-and-overw eight . Accessed 20 Nov 2016.
2. NCD Risk Factor Collaboration (NCD-RisC). Trends in adult body-mass index in 200 countries from 1975 to 2014: a pooled analysis of 1698 population-based measurement studies with 19.2 million participants. Lancet. 2016;387(10026):1377–96.
3. Ghosh S, Bouchard C. Convergence between biological, behavioural and genetic determinants of obesity. Nat Rev Genet. 2017;18(12):731–48. 4. Kasinska MA, Drzewoski J, Sliwinska A. Epigenetic modifications
in adipose tissue—relation to obesity and diabetes. Arch Med Sci. 2016;12(6):1293–301.
5. Wahl S, Drong A, Lehne B, Loh M, Scott WR, Kunze S, et al. Epigenome-wide association study of body mass index, and the adverse outcomes of adiposity. Nature. 2017;541(7635):81–6.
6. Park HJ, Bailey LB, Shade DC, Hausman DB, Hohos NM, Meagher RB, et al. Distinctions in gene-specific changes in DNA methylation in response to folic acid supplementation between women with normal weight and obesity. Obes Res Clin Pract. 2017;11(6):665–76.
7. González-Muniesa P, Mártinez-González MA, Hu FB, Després JP, Matsu-zawa Y, Loos RJF, et al. Obes Nat Rev Dis Primers. 2017;3:17034. 8. Crujeiras AB, Diaz-Lagares A, Sandoval J, Milagro FI, Navas-Carretero S,
Carreira MC, et al. DNA methylation map in circulating leukocytes mir-rors subcutaneous adipose tissue methylation pattern: a genome-wide analysis from non-obese and obese patients. Sci Rep. 2017;7:41903. 9. Kurylowicz A, Jonas M, Lisik W, Jonas M, Wicik ZA, Wierzbicki Z, et al. Obesity is associated with a decrease in expression but not with the hypermethylation of thermogenesis-related genes in adipose tissues. J Transl Med. 2015;13:31.
10. IBGE. Instituto Brasileiro de Geografia e Estatística. Contagem da popu-lação 2010. Rio de Janeiro: Ministério do Planejamento; 2010. 11. Kac G, Sichieri R, Gigante DP. Epidemiologia nutricional. Rio de Janeiro:
Editora Fiocruz/Editora Atheneu; 2007. p. 580p.
12. Cochran WG. Sampling techniques. 3rd ed. New York: Walter A. Shewhart; 1977. p. 448.
13. Silva AHA, Moraes RM, Costa MJC. Plano amostral utilizando amostragem estratificada juntamente com amostragem sistemática para aplicação do Inquérito nutricional do município de João Pessoa, Paraíba. Disponível
em. http://www.de.ufpb.br/~ronei /AnaHe rmini a2009 Escol a_Amost ragem 2009.pdf. Accessed 20 Mar 2016.
14. World Health Organization. Obesity: preventing and managing the global epidemic. Report of a WHO consultation, vol. 894. Geneva: World Health Organization; 2000. p. 11–253.
15. Grundy SM, Cleeman JI, Daniels SR, Donato KA, Eckel RH, Franklin BA, et al. Diagnosis and management of the metabolic syndrome: an Ameri-can Heart Association/National Heart, Lung, and Blood Institute scientific statement: executive Summary. Crit Pathw Cardiol. 2005;4(4):198–203. 16. World Health Organization. Definition, diagnostics and classification of
diabetes mellitus and its complications. Reports of a WHO consultation. Geneva: World Health Organization; 1999.
17. Ashwell M, Gibson S. Waist-to-height ratio as an indicator of ‘early health risk’: simpler and more predictive than using a ‘matrix’ based on BMI and waist circumference. BMJ Open. 2016;6:1–7.
18. Lima RPA, do Nascimento RAF, Luna RCP, Persuhn DC, da Silva AS, da Con-ceição M, et al. Effect of a diet containing folate and hazelnut oil capsule on the methylation level of the ADRB3 gene, lipid profile and oxidative stress in overweight or obese women. Clin Epigenetics. 2017;9:110. 19. R Development Team. R: A language and environment for statistical
com-puting. R foundation for statistical comcom-puting. 2009. http://www.r-proje ct.org. Accessed 16 Oct 2017.
20. Scaglione F, Panzavolta G. Folate, folic acid and 5-methyltetrahydrofolate are not the same thing. Xenobiotica. 2014;44(5):480–8.
21. Maffetone PB, Rivera-Dominguez I, Laursen PB. Overfat adults and chil-dren in developed countries: the public health importance of identifying excess body fat. Front Public Health. 2017;5:190.
22. Fradin D, Boëlle PY, Belot MP, Lachaux F, Tost J, Besse C, et al. Genome-wide methylation analysis identifies specific epigenetic marks in severely obese children. Sci Rep. 2017;7:46311.
23. Guay SP, Brisson D, Lamarche B, Biron S, Lescelleur O, Biertho L, et al. ADRB3 gene promoter DNA methylation in blood and visceral adipose tissue is associated with metabolic disturbances in men. Epigenomics. 2014;6(1):33–43.
24. Kurokawa N, Young EH, Oka Y, Satoh H, Wareham NJ, Sandhu MS, et al. The ADRB3 Trp64Arg variant and BMI: a meta-analysis of 44,833 individu-als. Int J Obes (Lond). 2008;32(8):1240–9.
25. Reinius LE, Acevedo N, Joerink M, Pershagen G, Dahlen SE, Greco D, et al. Differential DNA methylation in purified human blood cells: implica-tions for cell lineage and studies on disease susceptibility. PLoS ONE. 2012;7:e41361.
26. Costa LA, da Silva ICB, Mariz BALA, da Silva MB, Freitas-Ribeiro GM, de Oliveira NFP. Influence of smoking on methylation and hydroxymethyla-tion levels in global DNA and specific sites of KRT14, KRT19, MIR-9-3 and MIR-137 genes of oral mucosa. Arch Oral Biol. 2016;72:56–65.
27. Bendre M, Comasco E, Checknita D, Tiihonen J, Hodgins S, Nilsson KW. Associations between MAOA-uVNTR genotype, maltreatment, MAOA methylation and alcohol consumption in young adult males. Alcohol Clin Exp Res. 2018;42(3):508–19.
28. Callahan CL, Bonner MR, Nie J, Han D, Wang Y, Tao MH, et al. Lifetime exposure to ambient air pollution and methylation of tumor suppressor genes in breast tumors. Environ Res. 2018;161:418–24.
29. Da Silva Melo AR, Barroso H, Uchôa De Araújo D, Ruidomar Pereira F, De Oliveira NF. The influence of sun exposure on the DNA methylation status of MMP9, miR-137, KRT14 and KRT19 genes in human skin. Eur J Derma-tol. 2015;25(5):436–43.
30. Li X, Lu J, Teng W, Zhao C, Ye X. Quantitative evaluation of MMP-9 and TIMP-1 promoter methylation in chronic periodontitis. DNA Cell Biol. 2018. https ://doi.org/10.1089/dna.2017.3948.
31. Edwards M, Dai R, Ahmed SA. Our environment shapes Us: the impor-tance of environment and sex differences in regulation of autoantibody production. Front Immunol. 2018;9:478.
32. Li S, Zhang J, Huang S, He X. Genome-wide analysis reveals that exon methylation facilitates its selective usage in the human transcriptome. Brief Bioinform. 2017. https ://doi.org/10.1093/bib/bbx01 9.