International Journal of
Molecular Sciences
Article
QTL Mapping Reveals the Relationship between
Pasting Properties and Malt Extract in Barley
Junmei Wang1, Jianming Yang1, Wei Hua1, Xiaojian Wu1, Jinghuan Zhu1, Yi Shang1and Meixue Zhou2,*
1 Institute of Crop and Nuclear Technology Utilization, Jinghuan, Hangzhou 310021, China; [email protected] (J.W.); [email protected] (J.Y.); [email protected] (W.H.); [email protected] (X.W.); [email protected] (J.Z.); [email protected] (Y.S.)
2 Tasmanian Institute of Agriculture, University of Tasmania, Launceston, Tasmania 6250, Australia * Correspondence: [email protected]; Tel.: +61-3-6324-5615
Received: 9 September 2018; Accepted: 30 October 2018; Published: 12 November 2018
Abstract: Pasting properties are important characteristics of barley starch from a processing standpoint. Many studies reported the close relationship between pasting properties and malting quality, especially malt extract. However, most conclusions were derived from the correlation between pasting properties and malting quality using a set of cultivars or breeding lines. In this study, a doubled haploid population of 150 lines from a cross between a Japanese malting barley and a Chinese feed barley was grown in four different environments (two sites × two years). Based on average values from all different environments, 17 significant quantitative trait loci (QTL) were identified for pasting properties. The genetic variance explained by these QTL varied from 7.0 to 23.2%. Most QTL controlling pasting properties were located on 1H, 2H, 5H, and 7H. Results confirmed the linkage between pasting properties and malt extract, with most of the QTL for pasting properties becoming nonsignificant when using malt extract as a covariate. Breakdown showed the closest correlation with malt extract. Molecular markers closely linked to the QTL can be used to select desired pasting properties to improve malting quality.
Keywords:barley (Hordeum vulgareL.); quantitative trait loci (QTL); pasting property; malt extract; rapid visco-analyzer (RVA)
1. Introduction
Barley is an important primary source for the malting and brewing industries. Starch is the principal constituent of the total reserve of carbohydrates in barley grains, accounting for over 65% by weight of barley grain [1]. In barley endosperm, starch is deposited as granules, with two distinct populations of large (A-type) and small (B-type) granules [2]. The contents of both A- and B-type granule were higher in malting barley cultivars than in feed barleys [3]. During the brewing process, degradation products from starch are central in providing substrates for the fermentative phase, and the fermentative sugars contribute to the malt extract production. Therefore, the physicochemical properties of starch have a significant impact on the resultant malt quality and brewhouse performance [4].
Gelatinization is an important and functional characteristic of barley starch, essential for the complete enzymatic hydrolysis of starch during mashing [5]. During the gelatinization process, starch granules at progressively higher temperatures absorb water, begin to expand, and then rapidly swell. As a consequence of swelling, the viscosity of the solution increases, and nutrients are released [4]. The functional properties of starch are complicated traits, mainly controlled by genotypic factors [3,4,6–8]. Starch properties of barley depend on the composition and chemical structure of starch,
Int. J. Mol. Sci.2018,19, 3559 2 of 12
such as the ratio of amylose and amylopectin, total starch levels, proportion of small starch granules, and mean large starch granule diameter in the mature barley grain [4]. Gelatinization properties are significantly correlated with the distribution of the amylopectin chain length [9]. Higher amylose content, higher first fraction of debranched amylopectin, and lower starch molecular weight lead to an increased gelatinization temperature and breakdown viscosity, but decreased peak and trough viscosity. The ratio of short chains to intermediate chains in amylopectin is negatively correlated with peak viscosity, breakdown, and gelatinization temperature of rice starch [10]. Several starch biosynthetic genes also show significant effects on starch properties [10], with the combination ofSSIIaj(indicastarch synthase IIa) andWxi(indicaWx) withSBEIIbj(japonicastarch biosynthase SBEIIb) andSBEIi(indica SBEI) alleles showing accumulative effects on lowering peak viscosity and gelatinization temperature. Stay-green-like traits have shown potential in ensuring food security, as the cultivar with such traits maintained starch biosynthesis and grain quality during drought conditions [11]. The properties of starch are under genetic control [10] but are also affected by environmental factors [9,12–16]. In general, high growth temperatures facilitate amylopectin crystallization, increase gelatinization temperatures, and delay the onset and lower the extent of swelling of granules when heated in water [10,13,14].
In order to optimize the selection of barley for malting, it is desirable to understand the genetic behavior of the properties of starch. A high heritability of starch granule traits was found based on genotype means, but the heritability was low in a parent-offspring heritability evaluation [8]. Flour pasting temperature was mainly controlled by additive effects with no significant dominance effects, and a high heritability (0.70–0.83) [17]. Quantitative traits loci (QTL) analysis provides a powerful tool for dissecting complex traits and identifying chromosome regions and molecular markers linked to these traits. The use of molecular markers associated with these traits can greatly improve selection efficiency. QTL affecting the starch granule traits have been reported on chromosomes 2H, 4H, and 5H [18], and QTL associated with flour pasting properties have been located on chromosomes 1H, 2H, 3H, and 7H [19].
The aims of this study were to identify QTL controlling flour pasting properties in a doubled-haploid (DH) population originated from a malting barley and a feed barley, and determine the relationship between pasting properties and one of the major malting quality traits, malt extract.
2. Results
2.1. Pasting Properties for Parents and DH Lines
Int. J. Mol. Sci.2018,19, 3559 3 of 12
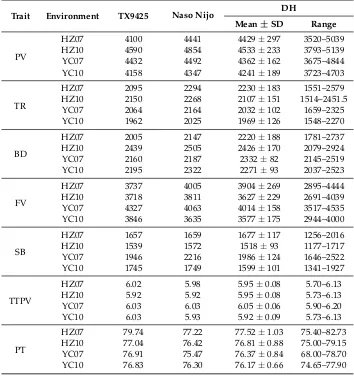
Table 1.Mean and range of pasting properties tested in different environments.
Trait Environment TX9425 Naso Nijo DH
Mean±SD Range
PV
HZ07 4100 4441 4429±297 3520–5039
HZ10 4590 4854 4533±233 3793–5139
YC07 4432 4492 4362±162 3675–4844
YC10 4158 4347 4241±189 3723–4703
TR
HZ07 2095 2294 2230±183 1551–2579
HZ10 2150 2268 2107±151 1514–2451.5
YC07 2064 2164 2032±102 1659–2325
YC10 1962 2025 1969±126 1548–2270
BD
HZ07 2005 2147 2220±188 1781–2737
HZ10 2439 2505 2426±170 2079–2924
YC07 2160 2187 2332±82 2145–2519
YC10 2195 2322 2271±93 2037–2523
FV
HZ07 3737 4005 3904±269 2895–4444
HZ10 3718 3811 3627±229 2691–4039
YC07 4327 4063 4014±158 3517–4535
YC10 3846 3635 3577±175 2944–4000
SB
HZ07 1657 1659 1677±117 1256–2016
HZ10 1539 1572 1518±93 1177–1717
YC07 1946 2216 1986±124 1646–2522
YC10 1745 1749 1599±101 1341–1927
TTPV
HZ07 6.02 5.98 5.95±0.08 5.70–6.13
HZ10 5.92 5.92 5.95±0.08 5.73–6.13
YC07 6.03 6.03 6.05±0.06 5.90–6.20
YC10 6.03 5.93 5.92±0.09 5.73–6.13
PT
HZ07 79.74 77.22 77.52±1.03 75.40–82.73 HZ10 77.04 76.42 76.81±0.88 75.00–79.15 YC07 76.91 75.47 76.37±0.84 68.00–78.70 YC10 76.83 76.30 76.17±0.66 74.65–77.90 SD: standard deviation; DH: doubled-haploid; PV: peak viscosity; TR: trough; BD: breakdown; FV: final viscosity; SB: setback; TTPV: time to peak viscosity; PT: pasting temperature. HZ: Hangzhou, Zhejiang Province; YC: Yancheng, Jiangsu Province; 07: 2007–2008 growing season; 10: 2010–2011 growing season.
2.2. QTL Analysis for Pasting Properties
Int. J. Mol. Sci.2018,19, 3559 4 of 12
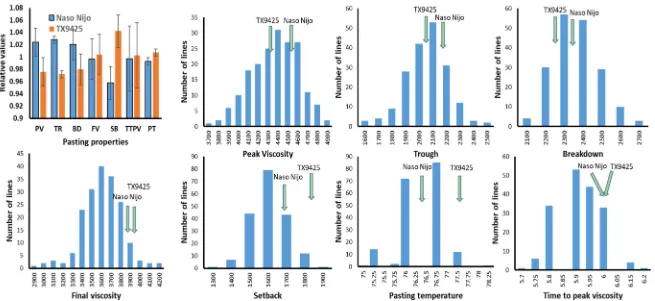
Int. J. Mol. Sci. 2018, 19, x FOR PEER REVIEW 4 of 12
[image:4.842.96.751.89.390.2]Int. J. Mol. Sci.2018,19, 3559 5 of 12
Table 2.ANOVA of different pasting properties.
Source of Variation PV TR BD FV SB TTPV PT
Block 13.89 ** 29.56 ** 49.28 ** 45.65 ** 5.49 ** 0.67 0.08 Genotype (G) 9.8 ** 9.25 ** 3.01 ** 16.04 ** 6.52 ** 3.05 ** 2.78 **
Location (L) 111.39 ** 953.08 ** 3.60 3321.46 ** 1768.62 ** 113.41 ** 1.98 Year (Y) 2.25 303.93 ** 105.67 ** 21.55 ** 3296.92 ** 224.2 ** 362.96 **
Y×L 34.78 ** 37.04 ** 371.52 ** 197.0 ** 637.9 ** 203.32 ** 112.0 ** G×Y 1.15 1.15 1.54 ** 1.29 * 0.93 1.59 ** 1.34 ** G×L 1.22 1.97 ** 2.14 ** 3.62 ** 2.58 ** 1.92 * 1.40 ** G×L×Y 0.96 1.24 * 1.72 ** 1.57 ** 1.39 ** 1.05 1.36 **
* Significant at 5%-level, ** significant at 1%-level. Abbreviations for traits are given in Table1.
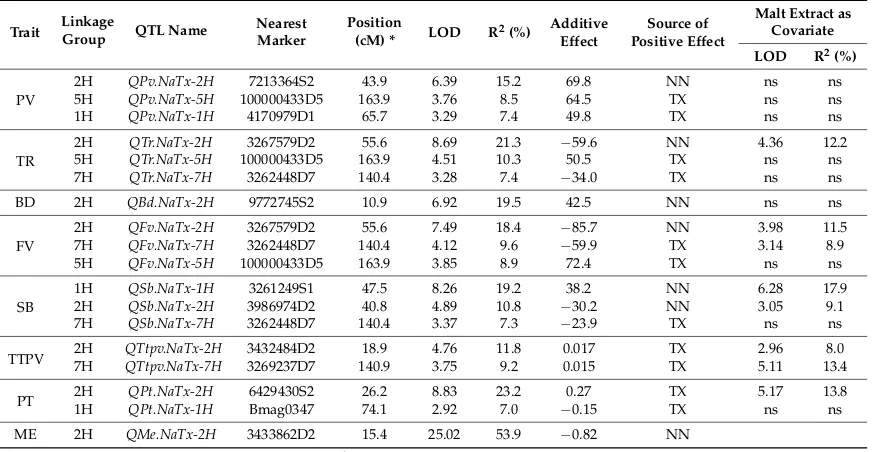
Table 3.Quantitative trait loci (QTL) for pasting properties and malt extract (ME) in the DH population of Naso Nijo×TX9425 based on average data from four different environments.
Trait LinkageGroup QTL Name Nearest Marker
Position
(cM) * LOD R2(%)
Additive Effect
Source of Positive Effect
Malt Extract as Covariate
LOD R2(%)
PV
2H QPv.NaTx-2H 7213364S2 43.9 6.39 15.2 69.8 NN ns ns
5H QPv.NaTx-5H 100000433D5 163.9 3.76 8.5 64.5 TX ns ns
1H QPv.NaTx-1H 4170979D1 65.7 3.29 7.4 49.8 TX ns ns
TR
2H QTr.NaTx-2H 3267579D2 55.6 8.69 21.3 −59.6 NN 4.36 12.2
5H QTr.NaTx-5H 100000433D5 163.9 4.51 10.3 50.5 TX ns ns
7H QTr.NaTx-7H 3262448D7 140.4 3.28 7.4 −34.0 TX ns ns
BD 2H QBd.NaTx-2H 9772745S2 10.9 6.92 19.5 42.5 NN ns ns
FV
2H QFv.NaTx-2H 3267579D2 55.6 7.49 18.4 −85.7 NN 3.98 11.5
7H QFv.NaTx-7H 3262448D7 140.4 4.12 9.6 −59.9 TX 3.14 8.9
5H QFv.NaTx-5H 100000433D5 163.9 3.85 8.9 72.4 TX ns ns
SB
1H QSb.NaTx-1H 3261249S1 47.5 8.26 19.2 38.2 NN 6.28 17.9
2H QSb.NaTx-2H 3986974D2 40.8 4.89 10.8 −30.2 NN 3.05 9.1
7H QSb.NaTx-7H 3262448D7 140.4 3.37 7.3 −23.9 TX ns ns
TTPV 2H7H QTtpv.NaTx-2HQTtpv.NaTx-7H 3432484D23269237D7 140.918.9 3.754.76 11.89.2 0.0170.015 TXTX 5.112.96 13.48.0
PT 2H1H QPt.NaTx-1HQPt.NaTx-2H Bmag03476429430S2 26.274.1 8.832.92 23.27.0 −0.270.15 TXTX 5.17ns 13.8ns
ME 2H QMe.NaTx-2H 3433862D2 15.4 25.02 53.9 −0.82 NN
The position is that of the nearest marker; R2means percentage genetic variance explained by the nearest marker; abbreviations for traits are given in Table1; ns means not significant.
Three significant QTL associated with TR were identified. A major QTL (QTr.NaTx-2H) was located on chromosome 2H with the nearest marker being 3267579D2 (55.56 cM), explaining 21.3% of the phenotypic variation (Table3). Naso Nijo contributed the allele for increasing TR for this QTL. Two other QTL,QTr.NaTx-5HandQTr.NaTx-7H, were identified on 5H and 7H, determining 10.3% and 7.4% of the phenotypic variation, respectively. TX9425 contributed the allele for increasing TR for both QTL.
Only one significant QTL (QBd.NaTx-2H) was identified for BD. This QTL was located on 2H with 9772745S2 being the closest marker, determining 19.5% of the phenotypic variation. Naso Nijo contributed the allele for increasing BD values. Three significant QTL for FV (QFv.NaTx-2H, QFv.NaTx-7H, andQFv.NaTx-5H) were located at the same position as those for TR.
[image:5.595.81.518.285.511.2]Int. J. Mol. Sci.2018,19, 3559 6 of 12
Two significant QTL (QTtpv.NaTx-2H and QTtpv.NaTx-7H) were found for TTPV (Table 3). QTtpv.NaTx-2Hwas located on 2H with the nearest marker being 3432484D2, explaining 11.8% of the genetic variation.QTtpv.NaTx-7Hwas located on 7H with the nearest marker being 3269237D7, explaining 9.2% of the genetic variation. The TX9425 allele increased TTPV in both QTL.
One major QTL (QPt.NaTx-2H) was identified for PT. This QTL was located on 2H with the nearest marker being 6429430S2, explaining 23.2% of the phenotypic variation. Another tentative QTL (QPt.NaTx-1H) was identified on 1H, explaining 7.0% of the phenotypic variation. The TX9425 allele increased PT in both QTL (Table3).
2.3. Correlations Between Pasting Properties and Malt Extract
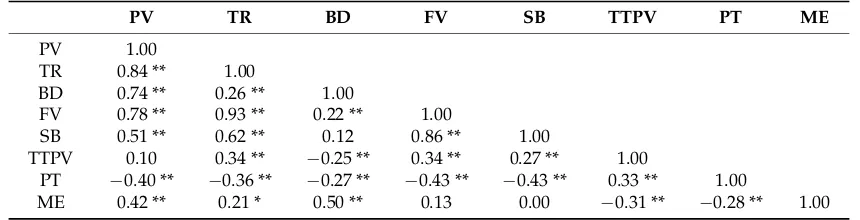
[image:6.595.83.513.322.432.2]As expected, most of the pasting properties were closely related (Table4). Pasting properties also showed a significant correlation with malt extract. BD showed the highest correlation with malt extract determined according to the official method of the European Brewery Convention (EBC, 1998) (r = 0.50), followed by PV (r = 0.42), TTPV (r =−0.31), PT (r =−0.28), and TR (r = 0.21). SB was not significantly correlated with malt extract.
Table 4.Correlations between pasting properties and malt extract.
PV TR BD FV SB TTPV PT ME
PV 1.00
TR 0.84 ** 1.00
BD 0.74 ** 0.26 ** 1.00
FV 0.78 ** 0.93 ** 0.22 ** 1.00
SB 0.51 ** 0.62 ** 0.12 0.86 ** 1.00
TTPV 0.10 0.34 ** −0.25 ** 0.34 ** 0.27 ** 1.00
PT −0.40 ** −0.36 ** −0.27 ** −0.43 ** −0.43 ** 0.33 ** 1.00
ME 0.42 ** 0.21 * 0.50 ** 0.13 0.00 −0.31 ** −0.28 ** 1.00 * Significant at 5%-level, ** significant at 1%-level. Abbreviations for traits are given in Table1.
3. Discussion
3.1. Multi-Environments Are Crucial for Determination of Flour Quality
Varying environments affect various quality traits, including barley malting quality [20]. Flour pasting properties can also be significantly affected by environments [21,22] through changed kernel size, and protein and lipid contents [23]. In this study, flour pasting properties were also affected by the environment (Table2), with QTL detected for different parameters showing some differences between the different environments. For example, QPv.NaTx-2H was identified in YC07, HZ10, and YC10 trials. The QTL on 1H (QPv.NaTx-1H) was found in both HZ10(PV3.1) and YC10(PV4.1) trials. When using average data from all four environments, a new minor QTL (QPv.NaTx-5H) was identified. Some more QTL were also identified in individual trials (data not shown). Therefore, data from multi-sites/years are needed for accurate phenotyping of quality traits, including pasting properties.
3.2. Flour Pasting Properties Showed Close Relationship with Malt Extract
Int. J. Mol. Sci.2018,19, 3559 7 of 12
concentration and composition [26], and protein, lipid, and beta-glucan contents [27,28]. However, later studies have confirmed that the pasting properties of whole grain flour are closely related to malt extract [25], with high PV, TR, BD, and FV, and low TTPV and PT being related to high malt extract. Pasting properties of whole barley flour are also correlated with the uptake of water by seeds, which is an essential and initial step towards germination in the malting process [29] and fermentability [30].
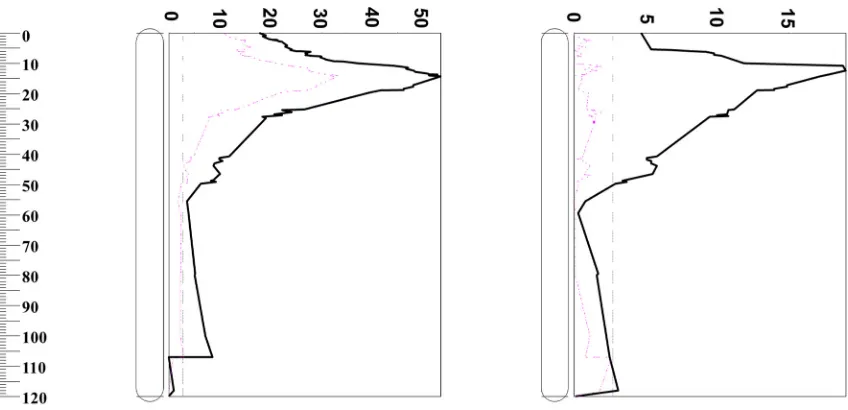
[image:7.595.109.490.347.456.2]QTL analysis has been successfully used to reveal the linkage between different traits [31–33]. In this experiment, QTL analysis for malt extract following the European Brewery Convention (1998) was conducted using different pasting properties as covariates. As shown in Table5, TR, FV, and SB had little effect on malt extract. When using PV, TTPV, and PT as covariates to analyze QTL for malt extract, the percentage of phenotypic variation explained by the QTL decreased from 53.5% to 41.9%, 44.1%, and 45.8%, respectively. BD was the most important trait contributing to malt extract. When BD was used as a covariate, the percentage of malt extract variation explained by the QTL decreased from 53.5% to 33.2% (Table5and Figure2). High values of BD are likely to be associated with a high degree of collapse of swollen starch granules (low trough viscosity) corresponding to a greater release of solubilized starch capable of re-association during the cooling portion of the RVA profile [34]; thus, this will increase the malt extract asβ-amylase does not attack whole intact starch granules, rather, it rapidly hydrolyzes a high proportion of solubilized starch and starch dextrins to maltose.
Table 5.QTL analysis for malt extract using different pasting properties as covariates.
Trait-Covariate Chromosome Nearest Marker Position (cM) LOD R2(%)
ME 2H 3433862D2 15.4 25.02 53.9
ME-PV 2H 3433862D2 15.4 24.8 46.6
ME-TR 2H 3433862D2 15.4 27.0 55.1
ME-BD 2H 3433862D2 15.4 19.0 34.2
ME-FV 2H 3433862D2 15.4 26.1 54.9
ME-SB 2H 3433862D2 15.4 24.7 53.7
ME-TTPV 2H 3433862D2 15.4 21.7 44.9
ME-PT 2H 3433862D2 15.4 25.6 53.2
Abbreviations for traits are given in Table1.
Int. J. Mol. Sci. 2018, 19, x FOR PEER REVIEW 7 of 12
later studies have confirmed that the pasting properties of whole grain flour are closely related to malt extract [25], with high PV, TR, BD, and FV, and low TTPV and PT being related to high malt extract. Pasting properties of whole barley flour are also correlated with the uptake of water by seeds, which is an essential and initial step towards germination in the malting process [29] and fermentability [30].
[image:7.595.87.511.487.692.2]QTL analysis has been successfully used to reveal the linkage between different traits [31–33]. In this experiment, QTL analysis for malt extract following the European Brewery Convention (1998) was conducted using different pasting properties as covariates. As shown in Table 5, TR, FV, and SB had little effect on malt extract. When using PV, TTPV, and PT as covariates to analyze QTL for malt extract, the percentage of phenotypic variation explained by the QTL decreased from 53.5% to 41.9%, 44.1%, and 45.8%, respectively. BD was the most important trait contributing to malt extract. When BD was used as a covariate, the percentage of malt extract variation explained by the QTL decreased from 53.5% to 33.2% (Table 5 and Figure 2). High values of BD are likely to be associated with a high degree of collapse of swollen starch granules (low trough viscosity) corresponding to a greater release of solubilized starch capable of re-association during the cooling portion of the RVA profile [34]; thus, this will increase the malt extract as β-amylase does not attack whole intact starch granules, rather, it rapidly hydrolyzes a high proportion of solubilized starch and starch dextrins to maltose.
Table 5. QTL analysis for malt extract using different pasting properties as covariates.
Trait-Covariate Chromosome Nearest Marker Position (cM) LOD R2 (%)
ME 2H 3433862D2 15.4 25.02 53.9 ME-PV 2H 3433862D2 15.4 24.8 46.6 ME-TR 2H 3433862D2 15.4 27.0 55.1 ME-BD 2H 3433862D2 15.4 19.0 34.2 ME-FV 2H 3433862D2 15.4 26.1 54.9 ME-SB 2H 3433862D2 15.4 24.7 53.7 ME-TTPV 2H 3433862D2 15.4 21.7 44.9
ME-PT 2H 3433862D2 15.4 25.6 53.2 Abbreviations for traits are given in Table 1.
Figure 2. Percentages of phenotypic variation determined by QTL on 2H. Left: Malt extract with (red-dashed line) and without (black-solid line) breakdown as a covariate. Right: Breakdown with (red-dashed line) and without (black-solid line) malt extract as a covariate.
The association between malt extract and pasting properties was further confirmed by using malt extract as a covariate to analyze QTL for pasting properties. Table 3 shows that the contribution
Figure 2. Percentages of phenotypic variation determined by QTL on 2H.Left: Malt extract with (red-dashed line) and without (black-solid line) breakdown as a covariate.Right: Breakdown with (red-dashed line) and without (black-solid line) malt extract as a covariate.
Int. J. Mol. Sci.2018,19, 3559 8 of 12
most of the QTL to pasting properties became nonsignificant when using malt extract as a covariate. For those which were still significant, the percentages of variation determined by the QTL was significantly reduced. The European Brewery Convention (1998) defined one of the methods for measuring malt extract. When a different method was used, for example, the Institute of Brewing Method (Martin and the Analysis Committee, 1979), which involves a high temperature infusion mash, the results of malt extract can be different and may thus lead to a different relationship between pasting properties and malt extract.
3.3. QTL for Malt Extract Are Associated with Flour Pasting Properties
Pasting properties can be used as selecting criteria for malt extract. However, even though the measurement of pasting properties is relatively easy and needs only about 5 g of seeds, given that most of the flour components are affected by the environment [12,19,35,36], flour pasting properties could be affected by environmental factors, which was also confirmed in the current experiment. The identification of molecular markers linked to pasting properties can make the selection more effective in a breeding program. There are very limited reports on QTL for barley pasting properties. In our previous research [19], we mapped many QTL for pasting properties from a cross between Yerong (an Australian feed barley) and Franklin (as Australian malting barley). Comparing QTL from the present study with those in the previous one, onlyQTr.NaTx-2H,QSb.NaTx-2H, andQTtpv.NaTx-2H are located at positions similar to those ofQTr.YeFr-2H,QSb.YeFr-2H, andQTpv.YeFr-2H, respectively. MLOC_60943.2could be the candidate gene that codes for endo-1,4-beta-xylanase, an important enzyme hydrolyzing the backbone of heteroxylan and releasing soluble polysaccharides [37]. All other QTL for pasting properties are different from those previously reported. These results are not without expectation. In the previous population [19], the malting barley variety, Franklin, contributed positive alleles for malt extract on 1H (close to centromere) and the long arm of 7H [38]. Several QTL for pasting properties were at similar positions [19] to those for malt extract [38]. However, in the current population, the malting barley variety, Naso Nijo, contributed positive alleles on the short arm of chromosome 2H [20], where several QTL for pasting properties are located.
4. Materials and Methods
4.1. Plant Materials and Field Experiments
A total of 150 doubled-haploid (DH) lines were produced from the F1 of the barley cross between TX9425 and Naso Nijo by the anther culture method [39]. TX9425 is a Chinese two-rowed feed variety, which shows shorter plant height and good tolerance to stresses [40,41]. In contrast, Naso Nijo is a Japanese two-rowed malting barley with good agronomic traits but less tolerant to stresses. The two parents also showed significant differences in pasting properties [17].
All the DH lines and parents were grown in Hangzhou, Zhejiang Province (HZ, 30.25◦ N, 120.17◦E) and Yancheng, Jiangsu Province (YC, 33.38◦N, 120.12◦E) in two different growing seasons, 2007–2008 (07) and 2010–2011 (10). A total of 150 vigorous seeds of each line or variety were sown in 2-m rows with 0.25-m row spacing. All experiments were arranged in a randomized complete block design with three replications. The soil type was silt-loam with medium fertility. All plots were supplied with 150 kg/ha N, 150 kg/ha P, and 80 kg/ha K as base fertilizer before sowing. No further fertilizer was applied to the plots. Fungicides were not required as no severe diseases were observed. Hand weeding was undertaken when needed. On maturity, the grains of each line or variety were harvested and stored in a room at−4◦C for further analysis.
4.2. Measurement of Pasting Properties
Int. J. Mol. Sci.2018,19, 3559 9 of 12
slurry were determined with a rapid visco-analyzer (RVA-TecMaster, Perten, Sweden) using a stirring speed of 960 rpm for the first 10 s and 160 rpm for the remainder of the test. The temperature was programmed to rise from 50◦C to 95◦C in 3.7 min, to remain for 2.5 min, to cool to 50◦C in 3.8 min, and to remain for 2 min. RVA measurements were reported in cP, min, and◦C. The RVA measurements were as follows [25]: peak viscosity (PV), highest viscosity during heating; time to peak viscosity (TTPV); trough (TR), lowest viscosity after cooling started; breakdown (BD), peak viscosity minus trough; final viscosity (FV), maximum viscosity after the temperature had returned to 50◦C; setback (SB), final viscosity minus trough; pasting temperature (PT), temperature when the viscosity reaches 10% of the peak viscosity.
4.3. Micro-Malting and Malt Extract Analysis
The barley grains were screened through a 2.2-mm sieve, and 200-g grain samples of each line were micro-malted in an automatic micro-malting system (Joe White Micro-malting Systems, Adelaide, Australia). Malt extract was determined according to the official method of the European Brewery Convention (EBC, 1998). This method is similar to that of the Institute of Brewing (IoB), with the extract following the EBC method being about 1.1% higher than that following the IoB method due to 0.2 mm (fine grind) for EBC compared to 0.7 mm (course grind) for IoB [42,43]. The average data from four different environments (two different sites×two growing seasons) [20] were used to analyze the relationship between pasting properties and malt extract.
4.4. Map Construction
Genomic DNA was extracted from the leaf tissue of 3-week old seedlings, based on a modified CTAB (cetyl trimethylammonium bromide) method described by Stein et al. [44]. DH lines and the two parental varieties were genotyped with DArTSeq (a restriction enzyme-mediated genome complexity reduction approach with subsequent NGS) ( http://www.diversityarrays.com/dart-application-dartseq). Due to the large number of DNA markers [~30,000 SNP (single-nucleotide polymorphism) and DArTSeq markers], markers with the same positions or with greater distortion and missing data were removed from the map construction. These markers were combined with previous genotypic data [DArT and SSR (simple sequence repeats markers)] [39,45]. A total of around 2500 markers were selected to construct the genetic map.
4.5. QTL Analysis
A genetic linkage map produced from the TX9425/Naso Nijo DH population using over 2500 markers was used for QTL analysis. The QTL analyses were based on the mean of the three replications from each site and year. The software package MapQTL6.0 [46] was used to detect QTL, which were first analyzed by interval mapping (IM). The closest marker at each putative QTL identified using interval mapping was selected as a cofactor, and the selected markers were used as genetic background controls in the approximate multiple QTL model (MQM). Logarithm-of-the-odds (LOD) threshold values, applied to declare the presence of a QTL, were estimated by performing genome wide permutation tests using at least 1000 permutations of the original data set for each trait, resulting in a 95% LOD threshold of around 3.0. To determine the effects of pasting properties on the QTL for malt extract, QTL for mat extract were re-analyzed by using different pasting properties as covariates. The percentage of the variance explained by each QTL (R2) was obtained by using restricted MQM mapping. Graphical representation of linkage groups and QTL was carried out using MapChart 2.2 [47].
5. Conclusions
Int. J. Mol. Sci.2018,19, 3559 10 of 12
can be achieved by pyramiding these QTL using closely linked markers. The fact that different QTL were identified from a different population opens up an opportunity of pyramiding favorite QTL from different varieties (for example Franklin and Naso Nijo) to improve pasting properties.
Supplementary Materials:The following are available online athttp://www.mdpi.com/1422-0067/19/11/3559/ s1. Figure S1: QTL for pasting properties QTL (in green) and malt extract (in red). For greater clarity, only selected markers and closest markers to different QTL were shown.
Author Contributions: J.W. and M.Z. constructed the population and molecular map; J.W. designed the experiments; J.W., J.Y., W.H., X.W., J.Z. and Y.S. performed the experiments; J.M. and M.Z. analyzed the data and wrote the paper.
Funding:This research was funded by the National Natural Science Foundation of China (31671678, 31271719), China Agriculture Research System (CARS-5), Key Research Foundation of Science and Technology, Department of Zhejiang Province of China (2016C02050-9), and Grains Research and Development Corporation (GRDC) of Australia.
Conflicts of Interest:The authors declare no conflict of interest.
References
1. Knudsen, K.E.B.; Aman, P.; Eggum, B.O. Nutritive-value of Danish-grown barley varieties. 1. Carbohydrates and other major constituents.J. Cereal Sci.1987,6, 173–186. [CrossRef]
2. Morrison, W.R.; Scott, D.C.; Karkalas, J. variation in the composition and physical-properties of barley starches.Starch-Starke1986,38, 374–379. [CrossRef]
3. Oliveira, A.B.; Rasmusson, D.C.; Fulcher, R.G. Genetic-aspects of starch granule traits in barley.Crop Sci. 1994,34, 1176–1180. [CrossRef]
4. Dunn, C.A.; Bonnici, M.J.; Logue, S.J.; Long, N.R.; Allan, G.R.; Stuart, I.M. An assessment of the physical and chemical properties of barley starch to predict malt quality. In Proceedings of the 24th Institute of Brewing Convention (Asia Pacific Region), Singapore, 1996; pp. 120–128.
5. MacGregor, A.W.; Fincher, G.B. Carbohydrates of the barley grain. InBarley: Chemistry and Technology; MacGregor, A.W., Bhatty, R.S., Eds.; American Association of Cereal Chemists: Saint Paul, MN, USA, 1993; p. 73.
6. Glennie-Holmes, M. Studies on barley and malt with the Rapid Viscoanalyser. I. The effect of variations in physical and chemical-parameters.J. Inst. Brew.1995,101, 11–18. [CrossRef]
7. Stuart, I.M.; Dunn, C.A.; Allan, G.R. The prediction of malt quality using Rapid Viscoanalyser. In Proceedings of the Sixth Institute of Brewing (Central and Southern African Section) Convention, Durban, South Africa, 1997; pp. 170–174.
8. Tester, R.F. Influence of growth conditions on barley starch properties.Int. J. Biol. Macromol.1997,21, 37–45. [CrossRef]
9. Matsuki, J.; Yasui, T.; Kohyama, K.; Sasaki, T. Effects of environmental temperature on structure and gelatinization properties of wheat starch.Cereal Chem.2003,80, 476–480. [CrossRef]
10. Luo, J.X.; Jobling, S.A.; Millar, A.; Morell, M.K.; Li, Z.Y. Allelic effects on starch structure and properties of six starch biosynthetic genes in a rice recombinant inbred line population.Rice2015,8, 15. [CrossRef] [PubMed] 11. Gous, P.G.; Hasjim, J.; Franckowiak, J.; Fox, G.P.; Gilbert, R.G. Barley genotype expressing “stay-green”-like characteristics maintains starch quality of the grain during water stress condition.J. Cereal Sci. 2013,58, 414–419. [CrossRef]
12. Chun, A.; Lee, H.J.; Hamaker, B.R.; Janaswamy, S. Effects of ripening temperature on starch structure and gelatinization, pasting, and cooking properties in rice (oryza sativa).J. Agric. Food Chem.2015,63, 3085–3093. [CrossRef] [PubMed]
13. Anker-Nilssen, K.; Faergestad, E.M.; Sahlstrom, S.; Uhlen, A.K. Interaction between barley cultivars and growth temperature on starch degradation properties measured in vitro.Anim. Feed Sci. Technol.2006,130, 3–22. [CrossRef]
Int. J. Mol. Sci.2018,19, 3559 11 of 12
15. Savin, R.; Stone, P.J.; Nicolas, M.E. Responses of grain growth and malting quality of barley to short periods of high temperature in field studies using portable chambers.Aust. J. Agric. Res.1996,47, 465–477. [CrossRef] 16. Tester, R.F.; South, J.B.; Morrison, W.R.; Ellis, R.P. The effects of ambient-temperature during the grain-filling period on the composition and properties of starch from 4 barley genotypes.J. Cereal Sci.1991,13, 113–127. [CrossRef]
17. Zhou, M.X.; Li, H.B.; Chen, Z.H.; Mendham, N.J. Combining ability of barley flour pasting properties. J. Cereal Sci.2008,48, 789–793. [CrossRef]
18. Borem, A.; Mather, D.E.; Rasmusson, D.C.; Fulcher, R.G.; Hayes, P.M. Mapping quantitative trait loci for starch granule traits in barley.J. Cereal Sci.1999,29, 153–160. [CrossRef]
19. Wang, J.M.; Yang, J.M.; McNeil, D.; Zhou, M.X. Mapping of quantitative trait loci controlling barley flour pasting properties.Genetica2010,138, 1191–1200. [CrossRef] [PubMed]
20. Wang, J.M.; Yang, J.M.; Zhang, Q.S.; Zhu, J.H.; Jia, Q.J.; Hua, W.; Shang, Y.; Li, C.D.; Zhou, M.X. Mapping a major QTL for malt extract of barley from a cross between TX9425×Naso Nijo.Theor. Appl. Genet.2015, 128, 943–952. [CrossRef] [PubMed]
21. Zhou, M.X.; Glennie-Holmes, M.; Roberts, G.L.; Robards, K.; Helliwell, S. The effect of growing sites on grain quality of oats and pasting properties of oatmeals.Aust. J. Agric. Res.1999,50, 1409–1416. [CrossRef] 22. Zhou, M.X.; Roberts, G.L.; Robards, K.; Glennie-Holmes, M.; Helliwell, S. Effects of sowing date, nitrogen
application, and sowing rate on oat quality.Aust. J. Agric. Res.1998,49, 845–852. [CrossRef]
23. Zhou, M.X.; Holmes, M.G.; Robards, K.; Helliwell, S. Fatty acid composition of lipids of Australian oats. J. Cereal Sci.1998,28, 311–319. [CrossRef]
24. Glennie-Holmes, M. Studies on barley and malt with the Rapid Viscoanalyser. 3. The prediction of malting potential from viscograms.J. Inst. Brew.1995,101, 29–32. [CrossRef]
25. Zhou, M.X.; Mendham, N.J. Predicting barley malt extract with a Rapid Viscoanalyser.J. Cereal Sci.2005,41, 31–36. [CrossRef]
26. Zheng, G.H.; Sosulski, F.W. Determination of water separation from cooked starch and flour pastes after refrigeration and freeze-thaw.J. Food Sci.1998,63, 134–139. [CrossRef]
27. Zhou, M.X.; Robards, K.; Glennie-Holmes, M.; Helliwell, S. Effects of enzyme treatment and processing on pasting and thermal properties of oats.J. Sci. Food Agric.2000,80, 1486–1494. [CrossRef]
28. Zhou, M.X.; Robards, K.; Glennie-Holmes, M.; Helliwell, S. Effects of oat lipids on great meal pasting properties.J. Sci. Food Agric.1999,79, 585–592. [CrossRef]
29. Cozzolino, D.; Roumeliotis, S.; Eglinton, J.K. The influence of starch pasting properties and grain protein content on water uptake in barley.J. Inst. Brew.2014,120, 38–44. [CrossRef]
30. Fox, G.; Visser, J.; Skov, T.; Meijering, I.; Manley, M. Effect of different analysis conditions on Rapid ViscoAnalyser malt viscograms in relation to malt of varying fermentability. J. Inst. Brew. 2014, 120, 183–192. [CrossRef]
31. Fan, Y.; Shabala, S.; Ma, Y.L.; Xu, R.G.; Zhou, M.X. Using QTL mapping to investigate the relationships between abiotic stress tolerance (drought and salinity) and agronomic and physiological traits.BMC Genom. 2015,16, 43. [CrossRef] [PubMed]
32. Liu, X.H.; Fan, Y.; Mak, M.; Babla, M.; Holford, P.; Wang, F.F.; Chen, G.; Scott, G.; Wang, G.; Shabala, S.; et al. QTLs for stomatal and photosynthetic traits related to salinity tolerance in barley.BMC Genom.2017,18, 9. [CrossRef] [PubMed]
33. Ma, Y.L.; Shabala, S.; Li, C.D.; Liu, C.J.; Zhang, W.Y.; Zhou, M.X. Quantitative trait loci for salinity tolerance identified under drained and waterlogged conditions and their association with flowering time in barley (Hordeum vulgare. L).PLoS ONE2015,10, e0134822. [CrossRef] [PubMed]
34. Higley, J.S.; Love, S.L.; Price, W.J.; Nelson, J.E.; Huber, K.C. The Rapid Visco Analyzer (RVA) as a tool for differentiating potato cultivars on the basis of flour pasting properties.Am. J. Potato Res.2003,80, 195–206. [CrossRef]
35. Delmoral, L.F.G.; Ramos, J.M.; Recalde, L. Relationships between vegetative growth, grain-yield and grain protein-content in 6 winter barley cultivars.Can. J. Plant Sci.1985,65, 523–532. [CrossRef]
Int. J. Mol. Sci.2018,19, 3559 12 of 12
37. Fincher, G.B. Biochemistry, physiology, and genetics of endosperm mobilization in germinated barley grain. InBarley: Production, Improvement, and Uses; Ullrich, S.E., Ed.; Wiley-Blackwell: Chichester, UK, 2010; pp. 449–477.
38. Panozzo, J.F.; Eckermann, P.J.; Mather, D.E.; Moody, D.B.; Black, C.K.; Collins, H.M.; Barr, A.R.; Lim, P.; Cullis, B.R. QTL analysis of malting quality traits in two barley populations.Aust. J. Agric. Res.2007,58, 858–866. [CrossRef]
39. Kasha, K.J.; Simion, E.; Oro, R.; Yao, Q.A.; Hu, T.C.; Carlson, A.R. An improved in vitro technique for isolated microspore culture of barley.Euphytica2001,120, 379–385. [CrossRef]
40. Wang, J.; Yang, J.; Jia, Q.; Zhu, J.; Shang, Y.; Hua, W.; Zhou, M. A new QTL for plant height in barley (Hordeum vulgareL.) showing no negative effects on grain yield.PLoS ONE2014,9, e90144. [CrossRef] [PubMed] 41. Wang, J.M.; Yang, J.M.; McNeil, D.L.; Zhou, M.X. Identification and molecular mapping of a dwarfing gene
in barley (Hordeum vulgareL.) and its correlation with other agronomic traits.Euphytica2010,175, 331–342. [CrossRef]
42. Evan, D.E.; Redd, K.; Haraysmow, S.E.; Elvig, N.; Meta, N.; Koutoulis, A. The influence of malt quality on malt brewing and barley quality on barley brewing with ondea pro, compared by small-scale analysis.J. Am. Soc. Brew. Chem.2014,72, 192–207. [CrossRef]
43. Evan, D.E.; Goldsmith, M.; Dambergs, R.; Nischwitz, R. A comprehensive revaluation of small-scale congress mash protocol parameters for determining extract and fermentability.J. Am. Soc. Brew. Chem.2011,69, 13–27. [CrossRef]
44. Stein, N.; Herren, G.; Keller, B. A new DNA extraction method for high-throughput marker analysis in a large-genome species such asTriticum aestivum.Plant Breed.2001,120, 354–356. [CrossRef]
45. Xu, R.; Wang, J.; Li, C.; Johnson, P.; Lu, C.; Zhou, M. A Single locus is responsible for salinity tolerance in a Chinese landrace barley (Hordeum vulgareL.).PLoS ONE2012,7, e43079. [CrossRef] [PubMed]
46. Van Ooijen, J.MapQTL®6: Software for the Mapping of Quantitative Trait Loci in Experimental Populations; Kyazma BV: Wageningen, The Netherlands, 2009.
47. Voorrips, R.E. MapChart: Software for the graphical presentation of linkage maps and QTLs.J. Hered.2002, 93, 77–78. [CrossRef] [PubMed]