Local Expansion and Optimization for Higher-Order
Graph Clustering
Wenhong Ma, Lijun Cai, Tingqin He, Lei Chen, Zehong Cao, and Renfa Li,
Senior Member, IEEE
Abstract—Graph clustering aims to identify clusters that feature tighter connections between internal nodes than external nodes. We noted that conventional clustering approaches based on a single vertex or edge cannot meet the requirements of clustering in a higher-order mixed structure formed by multiple nodes in a complex network. Considering the above limitation, we are aware of the fact that a clustering coefficient can measure the degree to which nodes in a graph tend to cluster, even if only a small area of the graph is given. In this study, we introduce a new cluster quality score, i.e., the local motif rate, which can effectively respond to the density of clusters in a higher-order graph. We also propose a motif-based local expansion and optimization algorithm (MLEO) to improve local higher-order graph clustering. This algorithm is a purely local algorithm and can be applied directly to higher-order graphs without conversion to a weighted graph, thus avoiding distortion of the transform. In addition, we propose a new seed-processing strategy in a higher-order graph. The experimental results show that our proposed strategy can achieve better performance than the existing approaches when using a quadrangle as the motif in the LFR network and the value of the mixing parameter µ exceeds 0.6.
Index Terms—community detection, community search, higher-order graph clustering, hypergraph clustering, motif clus-tering.
I. INTRODUCTION
A. Background
In the past decade, graph clustering has become a popular topic in analyzing the structure of graphs [1]. In a graph or network, clusters are typically groups of vertices with a higher probability of connecting to each other than to members of other groups, although other patterns are possible [2]. Clusters have many application scenarios in the Internet of Things [3], including sensor networks [4], vehicular ad hoc networks [5]– [7], and in-vehicle networks [8]–[10]. Community detection can be viewed as a problem of graph clustering in which each community corresponds to a cluster in the graph [11], [12]. In this study, the two notions are interchangeable. Community
This work was supported by the National Natural Science tion of China (61472127, 61272395), China Postdoctoral Science Founda-tion (2013M540628, 2014T70767), Natural Science FoundaFounda-tion of Hunan Province (14JJ3107), and Excellent Youth Scholars Project of Hunan Province (15B087). (corresponding author: Lijun Cai).
Wenhong Ma, Lijun Cai, Tingqin He, and Renfa Li are with the College of Information Science and Engineering, Hunan University, Chansha, China (email: wenhongma, ljcai, hetingqin, [email protected])
Lei Chen is with the School of Information and Electrical Engineering, Hunan University of Science and Technology, Xiangtan, China (email: [email protected])
Zehong Cao is with the Discipline of ICT, School of Technology, Envi-ronments and Design, College of Sciences and Engineering, University of Tasmania, TAS, Australia (email: [email protected])
detection algorithms are generally divided into global-based and local-based community detection [13]–[15]. Global-based community detection requires knowledge of the entire network structure, and current networks are too large to change in real time, such as the World Wide Web [14]. In contrast with global-based community detection, local-based community de-tection requires knowledge of only a small area of the relevant graph of the input node. Consequently, these approaches are more adaptable to large-scale and real-time changes in a network and haves a more extensive development space [16]. The input node is known as a seed, and a community search is a common application scenario in which a given seed finds its community. Seeds are typically processed to improve the community quality before the community is identified [17].
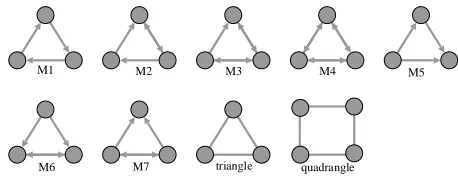
Traditional community detection is based on a single vertex or edge, and it disregards the interactions among vertices, which are likely to capture social phenomena. These interac-tions correspond to induced subgraphs of networks that contain multiple vertices and edges and represent the information from different interactions among multiple vertices, and this kind of subgraph is also refered to as a motif [18]. The motif of a network is crucial to organization of complex networks [19], [20] and has a wide range of application scenarios in many fields, such as carbon exchange models in food chains, resource allocation in the Internet of Things [7], and analysis of small structures in social networks [21]. The use of motifs as atomic units in graph clustering is known as higher-order graph clustering. Similar to traditional graph clustering, higher-order graph clustering is used to identify clusters with tighter connections between internal units than between external units. If the unit is a node, then it is a graph cluster in the typical sense. Triangles are social and biological network motifs that play important roles [18], [21], [22]. In the current study, we use triangles as the main motifs, but to increase generality, we also use undirected quadrilaterals as motifs (Figure 1).
M4 M5
M3 M2
M1
[image:1.612.321.550.649.741.2]M6 M7 triangle quadrangle
B. Motivation
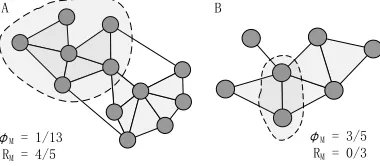
Benson et al. [23] proposed motif conductance based on conductance, a cluster quality scoring method, designed to incorporate higher-order structure and handle edge directions. However, if no motif exists in the cluster, the motif conduc-tance cannot accurately reflect the quality of the cluster, as shown in Figure 2B. We introduce a new cluster quality score, namely, the local motif rate, which calculates the density of the motif in a cluster. This score can be used to control the cluster size by adjusting parameter α. Given a graph G and a motif M, and under the same parameter α, if the number of motifs whose nodes are all in cluster C is considerably higher than that of motifs where only a portion of nodes are in clusterC, then cluster Chas a good (high) score for motif M. Figure 2A illustrates the concept of the local motif rate, where the number of M in C is counted, but not the edges. In this manner, edges that are not in a given motif do not contribute to the local motif rate.
Higher-order graph clustering can also be classified into global and local methods. Benson et al. [23], [24] recently used spectral clustering to complete higher-order graph clustering. Because this algorithm is based on a global algorithm and is not suitable for large-scale real-time changing networks, Yin et al. [12] proposed the motif-based approximate personalized PageRank (MAPPR) algorithm, which sorts the motif con-ductance after applying approximate personalized PageRank (APPR) [25]. The MAPPR considers graph clustering as a graph partitioning problem. After calculating the number of occurrences of all nodes in the motif for the entire graph, the original graph is transformed into a matrix of motif counts. Each given seed is required to traverse the entire graph that contains the motif and the graph is divided into two portions: cluster C and other parts, i.e., it is still required to know the structure of the entire graph to count the motifs and convert them to a matrix. Thus, MAPPR is not a purely local method. In this study, we develop the motif-based local expansion and optimization (MLEO) algorithm, a purely local method, which is only required to know the nodes associated with the seed node instead of the entire network. In addition, Benson et al. [23] and Yin et al. [12] converted the higher-order graph into a standard weighted graph and used spectral clustering or APPR algorithms on this weighted graph, but this conversion can cause performance distortion [26]. Our algorithm is based on the concept of local expansion and optimization [16], [27]– [29], and achieves good performance on higher-order graphs without transforming it into a weighted graph. This algorithm can be applied to hierarchical and overlapping community detection.
The seed strategy is essential in community detection and community search [13]. In community detection, seeds typi-cally are selected from important nodes, and the community gained from these important nodes is usually meaningful. Use of node degrees to represent the node importance is a common method. In community search, although the seed is a given node, the processing of seeds is crucial to improve the quality of a community [17]. The traditional seed processing strategy simply takes a given node and its neighbor nodes as the initial
structure, and cannot apply it to higher-order graph clustering. Yin et al. [12] proposed a strategy that uses the local minimum of motif conductance as a seed. However, this method merely focuses on finding better seeds in the entire network and cannot obtain a good initial structure for any given node. Therefore it cannot effectively work on community search. We propose a new motif-based processing strategy that treats a given node and the motifs with the given node as seeds. We compare several processing strategies in the networks and prove that our method is more adaptive to higher-order graphs.
C. Our contributions
In summary, our main contributions are listed as follows.
• A new clustering scoring method known as the called
local motif rate is proposed for higher-order graph clus-tering. This method determines the quality of the cluster by calculating the density of the motif in the cluster and solves the error quality score of motif conductance when no motif exists in the cluster. Simultaneously, this method can also react to cluster quality with different particle sizes of parameterα.
• A new algorithm (MLEO) for higher-order graph cluster-ing is proposed based on local expansion and optimiza-tion. This is a purely local algorithm that uses a greedy approach to find clusters that maximize quality scores on the higher-order graph, without converting it into a weight graph, to avoid conversion caused performance distortion. This algorithm can be applied to directed, undirected, and overlapping hierarchical networks, and even to a weighted network with a simple adjustment.
• A new seed processing strategy (motif seed) is proposed
that improves the final community by obtaining an initial community with better clustering quality scores. Experi-ments show that this strategy is suitable for higher-order graph clustering.
II. PRELIMINARY
We formally describe the higher-order graph clustering problem, and review important concepts in graph clustering. We also introduce a new cluster quality score, namely, the local motif rate.
A. Problem statement
Given a graphG, which might be a directed or an undirected graph, G=(V,E) represents an unweighted graph, and G =
(V,E,W) represents a weighted graph. We define V, E, and W to represent the node sets, edge sets, and edge weight sets, respectively. Let vi denote node i, ei j denote the edge from vi to vj, and wi j denote the weight of node vi to node vj.
Additionally, vi ∈ V, ei j ∈ E, and wi j ∈ W. For any set
X, this study uses |X| to denote its size. The motif M has k nodes. The objective of higher-order graph clustering is to find higher-order clustersC1, . . . ,CPwith high quality. In this
B. Motif conductance
When the motif is a node, the motif conductance represents conductance in graph theory, which is a measure of connec-tivity that uses the remainder of the graph to identify high-quality clusters, and the score of the cluster is obtained by calculating the cut ratio [15]. Cut and volume are the bases of conductance. We define link s(Si,Sj) as the sum of the edge
weights between vertex sets Si andSj.
Cut. The cut of a clusterC is defined as the sum of edge weights betweenC and its complemetsC:
cut(C)=link s(C,C).
V olume. The volume of a clusterC is defined as the sum of the edge weights between CandV:
vol(C)=link s(C,V).
Conductance. The conductance of a cluster is defined as the cut divided by the least number of the edges incident on either setC or C:
φ(C)= cut(C)
min{vol(C),vol(C)}.
By definition, φ(C)=φ(C) and lower values indicate higher cluster quality.
When motif M has multiple nodes, motif conductance is used to reflect the quality of higher-order clusters. We define link sM(Si,Sj)as the sum of instances of motif M, where there
are r nodes in setSi and other nodes in Sj,r∈ [1,k−1].
M oti f cut. The motif cut of a cluster C is the number of instances of M with at least one end point (i.e., node) in C and at least one end point inC:
cutM(C)=link sM(C,C).
M oti f volume. The motif volume of a cluster C is the number of occurrences for nodes inC, counted over each node in every instance of M:
volM(C)=
Õ
vj∈C
link sM({vj},V).
M oti f conductance. The motif conductance of a clusterC is the ratio of cutM(C) tomin{volM(C),volM(C)}:
φM(C)=
cutM(C)
min{volM(C),volM(C)} .
Motif conductance is used to reflect the quality of the cluster by minimizing the ratio of the motif cut to the motif volume. As such, cutM(C) is the number of motifs in cut,
which is the unit of motif, and volM(C) is the number of
times that each node in C appears in motif M, i.e., the number of nodes. The counting units of cut and volume are inconsistent, and thus certain errors might exist. We offer two examples of calculating the motif conductance in Figure 2. The dotted region is a cluster. In Figure 2A, motif conductance obtains the correct response cluster quality score. In Figure 2B, the corresponding motif conductance value is 3/5, and no complete motif is found in cluster C. In other words, the motif should have the worst quality score of1 for cluster C.
φM = 1/13
RM = 4/5
φM = 3/5
RM = 0/3
[image:3.612.342.532.59.142.2]B
Fig. 2. Steps in calculating motif conductance and local motif rate when motif M is the triangle and the area enclosed by the dotted line is cluster C. In A, both methods measure the clustering score. In B, the motif conductance score is not equal to 1, which is the worst score for cluster C without motif M.
In addition, φM(C) = φM(C), C is an unconnected graph,
and the obtained φM(C) is meaningless, i.e., it cannot be
used as a quality scoring function to reflect the quality of clusters in this situation. ThevolM(C)disregards the atomicity
of the motif in the higher-order graph cluster, i.e., higher-order graph clustering uses the motif as an atomic unit rather than a node, which might cause incorrect boundary motifs. Thus, we introduce a new higher-order cluster quality score.
C. New cluster quality score
In traditional graph clustering, in addition to conductance, the quality of density metrics is also a method commonly used to reflect cluster quality. This metric is equal to the ratio of the sum of intra-cluster weights to the sum of intra-cluster and inter-cluster weights [2], [14], [30].
Intr a-clusterweight. The intra-cluster weight of clusterC is defined as the sum of edge weights in cluster C:
Win(C)=link s(C,C).
Inter-clusterweight. The inter-cluster weigt of cluster C is defined as the sum of edge weights between C and its complementsC:
Wout(C)=link s(C,C).
Relative density. The relative density of clusterCis defined as the ratio ofWin(C)to the sum ofWin(C)andWout(C):
R(C)= Win(C)
Win(C)+Wout(C) .
In this study, we introduce a new cluster quality score, local motif rate, which reflects the quality of a cluster by measuring the density of the “atomic unit” motif M in a higher-order graph.
Number o f intr a-cluster moti f. The number of instances of motif M in which all nodes are inC:
Nin(C)=link sM(C,C). (1)
Number o f inter-cluster moti f. The number of instances of motif M in which only some of the nodes are inC:
Nout(C)=link sM(C,C). (2)
Local moti f r ate. The local motif rate of motifM of cluster C is defined as the ratio ofNin(C) to(Nin(C)+Nout(C))α:
RM(C)=
Nin(C) (Nin(C)+Nout(C))α
Parameter α=1 indicates the relative density of the higher-order cluster. Parameter αcan be used to adjust cluster size.
Compared with motif conductance, the local motif rate shows the following advantages. 1) The local motif rate addresses the motif of the higher-order graph as the atomic unit and does not count the nodes, thereby avoiding repeated counting when no motif exists in the cluster. 2) The local motif rate can use a different parameterαto adjust cluster size. Asα increases, the size of a community gradually decreases. From another perspective, the stability of a cluster can be reflected by the range of α, i.e., when the range of α in a cluster is large, then the cluster is stable.
Figure 2 shows two examples of motif conductance and local motif rate calculations. In Figure 2B, when cluster C does not include a motif M, the local motif rate is equal to the worst value (0). If α = 1, then RM(C) ∈ [0,1], RM(C)
represents the density ofC, and values closer to 1 mean better quality. Hence, higher-order clustering is converted to find a high RM(C)value of the region.
III. PROPOSED ALGORITHM
Our algorithm uses local expansion and optimization. This approach generally relies on a local benefit function that characterizes the quality of a densely connected subgraph. In this work, we use the local motif rate, and our method differs from the usual non-higher-order local expansion and optimization. Higher-order graph clustering exhibits its own characteristics and is based on motif M with k nodes. If k−1 nodes are expanded at one time, then too many combinations result, which considerably increases the calculation amount. If only one node is expanded, then the obtained cluster will has poor quality. In accordance with this feature, complexity and accuracy are both considered in expanding and optimizing, and different expansion and optimization methods are proposed.
Algorithm 1 Algorithm Framework
Input: G = (V,E), k node of motif M, seed node v0,
parametersα, β
Output: Motif-based clusterC
1: use the seed-processing strategy:C←Ð
v0∈MiSi
2: whilecheckPhase(G, M, C, α)do 3: C← ex pansionPhase(G,M,C,k, α, β) 4: end while
5: return C
Our algorithm is divided into three components. The first component is the seed phase, which addresses a given node to obtain the initial community. The second component is the expansion phase, which uses a clustering fitness function to expand the nodes to join the community. The third component is the check phase, which checks whether a node is able to reduce the cluster score. If such a node exists, then it is deleted. Algorithm 1 describes the processes of the three phases. The algorithm framework is explained as follows.
1) Line 1, seed phase (Section III-A). The seed strategy is used to process the seed nodev0, and the initial cluster
Cis obtained.
M1
M2 v5
v7 v6
v12 v0
v2 v1
v3
v8 v4
v11
v9
v0 M
Motif Seed
[image:4.612.330.547.57.166.2]e07
Fig. 3. Example ofdM(v0)and motif seed when the motif is a triangle.
2) Line 2, check phase (Section III-C). The initial commu-nityCis checked, and the negatively affected nodes are deleted.
3) Line 3, expansion phase (Section III-B). Cluster C is continuously expanded until the maximum cluster quality score is obtained.
In the algorithm, the granularity of a community can be adjusted by changing the parameter α. When entering or exiting the expansion phase, a check phase is performed to determine whether deleting the node can improve the local benefit function. Additionally, the checking frequency in the expansion phase is set by parameter β, which is generally related to the graphical scale. The following subsections describe the steps of each phase in detail.
A. Seed phase
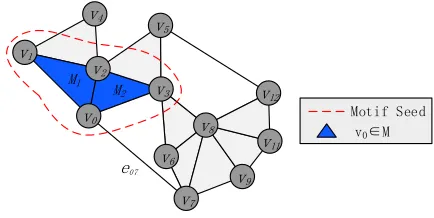
Seeds are the initial structure of a cluster. In community detection, the center or important node is typically viewed as the seed. A node with a high degree is usually the central node of the network. However, in a higher-order graph, a simple count of all the edges to a node might fail to re-flect the importance of a node. In Figure 3, for example, the degrees of nodes v0 and v1 are 4 and 3, respectively.
However,φM(V\v0)=φM(V\v1)andRM(V\v0)=RM(V\v1),
indicating that v0 is not more important thanv1 for a
higher-order graph, even if the degree of v0 is greater that of v1.
The reason for such a finding is that e07 is counted and
not involved in the motif. Simply removing the edges that do not participate in the motif is not a good solution. For example, for v2 and v3 in Figure 3, φM(V\v2) < φM(V\v3)
andRM(V\v2)>RM(V\v3). Evidently,v2 is more suitable as
a seed, but the both have equal degree and edge are involved in the motif. We considered motif clustering from the perspective of hypergraph [26], [31]–[33], suggesting that the hyperedges correspond to motifs [26], [33], so it is reasonable to apply the concept of degree from hypergraph in this study. To distinguish from the traditional degree, it is known as the M-degree in this study.
Given a graph G and motif M, the node motif M-degree dM is the number of occurrences of a node in motif M. The
equation is given as follows:
dM(v0)=
Õ
i1v0∈Mi(v0),
where 1v0∈Mi(v0) is an indicator function for each v0 ∈ Mi.
traditionally defined node degree. We measure the importance of the node by counting the motifs instead of the edges. In Figure 3, dM(v2)anddM(v3)are 4 and 3, respectively, which
correctly reflect the importance of the nodes.
Using a central node or an important node as a seed is a prudent solution. However, in community search, a community should be found for any given node. This solution might not designate a major node as a seed, and the resulting community might be inaccurate. To improve the results, we propose a new seed-processing strategy that can handle any node.
If only one node is used as a seed, then the node that joins at the beginning might be a sparse node. Currently, the most commonly used method is to select a node and its neighbor node as seeds [11], [21], [34]. However, this method might introduce nodes that do not contribute. In Figure 3, for example, the neighboring seed set of v0 is {v0,v1,v2,v3,v7},
where v7 has no contribution. In local higher-order graph
clustering, we introduce a new seed strategy known as the motif seed, which is defined as follows.
Definition 1. In graph G, given a vertexv0and motif M, motif
seed is a motif set that contains node v0. The equation is as
follows:
M oti f Seed = Ø
v0∈Mi
Mi.
As shown in Figure 3, the motif seed of node v0 is {v0,v1,v2,v3}. In Algorithm 1, after obtaining the motif seed,
we examine the set and remove several negatively affected nodes. Notably, the seed in this case is an initial structure that contains a cluster of nodes and edges and is no longer a collection of nodes. If we do not specify the original node, then we use the node with a motif M-degree that is higher than the original node, and add the motif M that contains the original node to the seed. We experimentally prove that using this strategy to select seeds is effective.
B. Expansion phase
Once we obtain the original cluster, we intend to expand the cluster around this region. The traditional extension method selects a node from the cluster neighbor nodes to join the cluster, which can cause the fitness function to obtain the maximum and positive value until the neighbor node no longer increases or no neighbor node exists. However, certain different situations occur in higher-order networks, i.e., they use the motif as a unit. When only one node is added at each time, a network is likely to fall into a local pause or no suitable cluster might be found. Oncek−1nodes are added at each time, considerable time is required to obtain the optimal combination.
In this work, we propose a new method based on the characteristics of multiple nodes in a higher-order network. In the beginning, we add only one node to the cluster, i.e., we select a node from the neighbors of the cluster that causes the fitness function to take on a maximum and positive value to join the cluster. If all of the joined nodes are negative, then we consider adding two nodes at a time. We also consider making the fitness function take on the maximum and positive value
for both nodes. Otherwise, we add more nodes until we obtain k−1 nodes. If the fitness function no longer increases or no neighbor node exists, then the expansion phase is stopped. To save computing costs, multiple connected nodes are added at one time.
We use the local motif rate RM as the fitness function. The
equation is given as follows:
RAi
M(C∪Ai)=RM(C∪Ai) −RM(C), (4)
whereC represents a cluster. To ensure that the calculation is not excessively large, Ai denotes a set of respective adjacent
nodes of size i in which at least one node is a neighbor of clusterC,iranges from1tok−1, andRM(C∪Ai)andRM(C)
represent the local motif rate when the cluster node set isC∪Ai
andC. This equation represents the gain obtained by adding node setAi to clusterC, andAi is added to the cluster to make
the fitness function obtain a maximum and positive value. To calculate RM(C∪ Ai), we do not need to recount the
number of motifs each time and can directly use the RM(C)
solution. Only the motif related to Ai should be calculated.
We use Ein(Ai)to represent the number of instances of motif
M between Ai andC,
Ein(Ai)=link s(C,Ai). (5)
Eout(Ai) represents the number of instances of motif M
between Ai andC,
Eout(Ai)=link s(C,Ai). (6)
In Figure 4A, Ai is {v0}; and Ein(Ai) and Eout(Ai) are the
numbers of blue and green triangles, respectively, i.e., 1 and 2. In Figure 4B,Ai is{v0,v1}; andEin(Ai)andEout(Ai)are 3
and 4, respectively. From Eqs. (3), (5), and (6), we can obtain the following expression:
RM(C∪Ai)=
Nin(C)+Ein(Ai) (Nin(C)+Nout(C)+Eout(Ai))α
. (7)
Nin(C) and Nout(C) have been derived in RM(C), and only
Eout(Ai)andEin(Ai)are calculated. We can simply prove that
Eq. (7) is established.
Proof: For the number of intra-cluster motifs, according to Eqs. (1) and (5),
Nin(C∪Ai)=link sM(C∪Ai,C∪Ai)
=link sM(C,C)+link sM(C,Ai)+link sM(Ai,Ai)
=Nin(C)+Ein(Ai)+Nin(Ai).
Given that|Ai|<|M|, i.e., no motif M exists in Ai,Nin(Ai)=
0. The final result is
Nin(C∪Ai)=Nin(C)+Ein(Ai). (8)
For the number of inter-cluster motifs, according to Eqs. (2), (5), and (6),
Nout(C∪Ai)=link sM(C∪Ai,C∪Ai)
=link sM(C,C) −link sM(C,Ai)+link sM(C,Ai)
v0
v1
v0
v1
A B
Ein(Ai) C∪Ai C
[image:6.612.63.296.55.133.2]Eout(Ai)
Fig. 4. Examples of calculatingRM(C∪Ai)when the motif is a triangle
andRM(C)is4/(4+4)α. A: Add{v0},RM(C∪A1)is(4+1)/(4+4+2)α.
B: Add {v0,v1},RM(C∪A2)is(4+3)/(4+4+4)α.
For the local motif rate, according to Eqs. (3), (8), and (9), we can obtain
RM(C∪Ai)=
Nin(C∪Ai)
(Nin(C∪Ai)+Nout(C∪Ai))α
= Nin(C)+Ein(Ai) (Nin(C)+Nout(C)+Eout(Ai))α
.
Therefore we only need to recalculateEin(Ai)andEout(Ai)
when obtaining RM(C∪Ai).
In Figure 4, we provide two examples of calculatingRM(C∪
Ai).Nin(C)and Nout(C)are equal to 4, andRM(C)is4/(4+
4)α. In Figure 4A, Ai is {v0}. From Eq. (5) and (6), we can
only calculate Ein(Ai)andEout(Ai), which are equal to 1 and
2, respectively, andRM(C∪Ai)is(4+1)/(4+4+2)α.RM(C∪Ai)
is less than RM(C), and thus,Ai cannot be expanded toC. In
Figure 4B, Ai is{v0,v1}.Ein(Ai)andEout(Ai)are equal to 3
and 4, respectively. We can obtain RM(C∪Ai)as(4+3)/(4+
4+4)α, which is greater than RM(C).
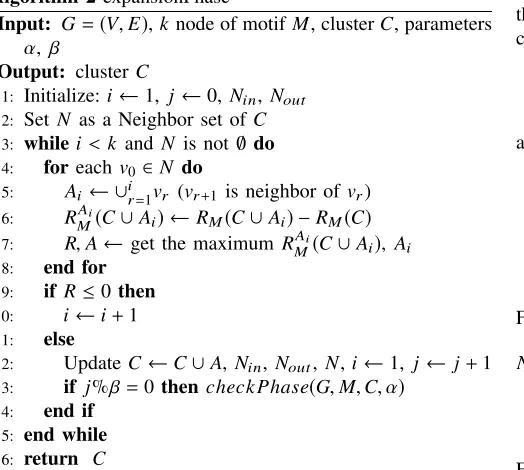
Algorithm 2 expansionPhase
Input: G=(V,E),knode of motifM, clusterC, parameters
α, β
Output: clusterC
1: Initialize:i←1, j ←0,Nin, Nout
2: Set N as a Neighbor set ofC 3: whilei<k andN is not ∅ do 4: foreachv0 ∈N do
5: Ai ← ∪ir=1vr (vr+1 is neighbor ofvr)
6: RAi
M(C∪Ai) ←RM(C∪Ai) −RM(C)
7: R,A← get the maximumRAi
M(C∪Ai), Ai
8: end for 9: if R≤0then 10: i←i+1 11: else
12: UpdateC←C∪A,Nin,Nout, N,i←1, j← j+1
13: if j%β=0 thencheck Phase(G,M,C, α) 14: end if
15: end while 16: return C
We use Algorithm 2 to describe the extension phase, and the concrete steps are explained as follows.
1) In lines 1 and 2, the variables i and j are initialized to 1 and 0, respectively, where i represents the scale of Ai and j represents the number of extensions. Nin and
Nout are calculated, andN is established to be a set of
neighbor nodes ofC.
2) In lines 4-8, the maximum value ofRAi
M(C∪Ai)and its
corresponding Ai are obtained asRand A, respectively.
To reduce the combination, Ai is a set of neighboring
nodes and |Ai|is i.
3) In lines 9-14, when R is less than 0, the value of i is increased, i.e., the number of extended nodes is increased. Otherwise, the clusterC∪Ais set toC, and the values of Nin, Nout, N, i, and j are updated. In
line 13, cluster C is checked every β times, which is an option, and a larger β value can be set to obtain a shorter time.
C. Check phase
When the nodes in a cluster continue to increase, previous nodes might have a negative effect cluster quality. To address the negative impact, the check phase was added. This phase is similar to the expansion phase, and both aim to increase cluster quality, but the difference is that nodes are removed in the latter.
To ensure that the calculation is not too large, our algorithm only checks a single node, i.e., whether the local motif rate increases after temporarily removing a node in the cluster. If the rate increases, then we delete it, and otherwise, we preserve it. For specific methods, please refer to Algorithm 3. The equation is given as follows:
Rv0
M(C− {v0})=RM(C− {v0}) −RM(C). (10)
Similar to Eq. (7), Eq. (10) can also take advantage of the results of previous calculations, as long as the motif that contains nodev0 is calculated. The calculation method is
RM(C− {v0})=
Nin(C) −Ein({v0}) (Nin(C)+Nout(C) −Eout({v0}))α
, (11)
and the proof is as follows.
Proof:For the number of intra-cluster motifs,
Nin(C− {v0})=link sM(C− {v0},C− {v0})
=link sM(C,C) −link sM(C,v0)
=Nin(C) −Ein({v0}). (12)
For the number of inter-cluster motifs,
Nout(C− {v0})=link sM(C− {v0},C− {v0})
=link sM(C,C)+link sM(C,{v0}) −link sM(C,{v0})
=Nout(C)+Ein({v0}) −Eout({v0}). (13)
For the local motif rate, according to Eqs. (3), (12), and (13),
RM(C− {v0})=
Nin(C− {v0})
(Nin(C− {v0})+Nout(C− {v0}))α
= Nin(C) −Ein({v0}) (Nin(C)+Nout(C) −Eout({v0}))α
.
[image:6.612.54.316.417.652.2]Algorithm 3 checkPhase
Input: G=(V,E), motif M, clusterC, parametersα Output: The Boolean value that cluster C whether to change
1: Initialize:r esult ← f alse 2: foreach v∈C do
3: if|C|=1then reutrn r esult
4: RvM(C− {v}) ←RM(C− {v}) −RM(C)
5: if RvM(C− {v})>0 then 6: C←C− {v}
7: r esult ←true 8: end if
9: end for 10: return r esult
D. Time complexity analysis
We analyze the time complexity of the MLEO algorithm. Given a graph, n nodes, m edges, and the degree of each node isd={d1,· · ·,dn}, where the maximum degree isdmax.
For Algorithm 2, when maximizing the fitness of neighbors, the time complexity of sorting them is d1logd1. Subsequent
extensions only consider the insert sequence. In the worst case, the remaining n−1 nodes are added to the cluster, which is Ín
i=2logdi. For the motifs of k nodes, the result must be
multiplied by k−1. Using simple scaling calculations,
(k−1)d1logd1+(k−1)
Õn
i=2logdi ≤k dmaxlogdmax+k(n−1)logdmax
≤k(2n−1)logdmax.
The complexity of Algorithm 2 is O(knδlogdmax), where δ
is the complexity of finding a motif. Furthermore, the com-plexity of Algorithm 1 isO(kn2δlogdmax). The complexity of
MAPPR isO(δall+mlog4m/φ2), whereφis conductance, and δallrepresents the cost of constructing W, which must identify
the motif of the entire graph, but our method only needs to identify the relevant region. The problem of identifying motifs and counting them is a highly challenging task, and it is NP-complete [35]. Many studies focus on quickly identifying motifs in the network [36]–[38].
IV. EXPERIMENTS
In Section IV-A, we discuss the evaluation metrics. In Section IV-B, we introduce the dataset in the experiment. In Section IV-C, we evaluate the MLEO algorithm in directed and undirected networks. In a directed network, we set α=1and use a variety of motifs to determine the degree of clustering to the local motif rate. In an undirected network, we use F1,
recall, and precision as measures.
In Section IV-D, we use each node in the network as the original seed and compare different seed strategies. Simultane-ously, we count the clustering results that correspond to differ-ent node motifM-degrees. In Section IV-E, we use differentα values to find clusters of different sizes, which proves that the proposed algorithm is also feasible for hierarchical clustering.
A. Evaluation metrics
In using our proposed evaluation metrics local motif rate to evaluate the degree of clustering, we also adopt the uni-versal evaluation metric F1 to evaluate ground truth clusters.
Formally, givenCandC0as two arbitrary clusters in the same network, theF1 score ofC in matching withC0is defined as
follows;
F1=
2×pr ecision(C,C0) ×r ecall(C,C0)
pr ecision(C,C0)+r ecall(C,C0) ,
wherepr ecision(C,C0)= |C|∩C0|
C| andr ecall(C,C
0)= |C∩C0| |C0| . F1 is frequently used in supervised learning; however,
the matching of clusters in unsupervised learning is more complicated. When we focus on the evaluation of a cluster, i.e., the performance evaluation of a clusterCi with the ground
truth cluster set C0 = {C10,· · ·,CQ0}, we divide the F1 score
into a maximum matching F1−max and an average matching
F1−ave.
F1−max(Ci,C0)=maxj:1→QF1(Ci,Cj0),
F1−ave(Ci,C0)=aver agej:1→Q,Ci∪C0j,∅F1(Ci,C
0
j).
F1−max and F1−ave are both in [0,1]; the closer to 1, the
better the result. F1−max calculates theF1 score that matches
the cluster best in the result set, whereas F1−ave calculates
the average F1 of all the sets that intersect with the ground
truth clusters. In the experiment, we obtain the average of the F1 that correspond to clusters C = {C1,· · ·,CP}, including
F1−max and F1−ave, which are calculated as follows:
F1−max(C,C0)=
1 P
P
Õ
i=1
F1−max(Ci,C0),
F1−ave(C,C0)=
1 P
P
Õ
i=1
F1−ave(Ci,C0).
B. Dataset
[image:7.612.51.301.61.209.2]Several different real network datasets from the Stanford Network Analysis Project [40] are used in the experimen-tal comparison, including 4 ground-truth community undi-rected networks, i.e., com-dblp, com-amazon, com-youtube and com-lj, and 6 directed networks, i.e., Florida-bay, C-elegans-frontal, Email-Eu-core, Cit -hepPh, Soc-Slashdot0811 and Web-Stanford. The details of each network are shown in Table I.
TABLE I
AN INTRODUCTION TO THE REAL NETWORK IN THE EXPERIMENT[39].
Name Type Nodes Edges Description
Com-dblp Undirected, Communities 317080 1049866 DBLP collaboration network Com-amazon Undirected, Communities 334863 925872 Amazon product network Com-youtube Undirected, Communities 1134890 2987624 Youtube online social network Com-lj Undirected, Communities 3997962 34681198 LiveJournal online social network
Florida-bay Directed 128 2106 Florida Bay food web
C-elegans-frontal Directed 131 764 Frontal neuronal connections in C. elegans
Email-Eu-core Directed 1005 25571 E-mail network
Cit-HepPh Directed 34546 421578 Arxiv High Energy Physics paper citation network Soc-Slashdot0811 Directed 77360 905463 Slashdot social network from November 2008 Web-Stanford Directed 281903 2312497 Web graph of Stanford.edu
TABLE II
COMPARISON BETWEEN THEMLEOALGORITHM AND THEMAPPRALGORITHM,WHERE THE MOTIF IS A TRIANGLE. BOTH ALGORITHMS USE
RANDOMLY SELECTED SEEDS. ATOTAL OF100COMMUNITIES WITH MORE THAN50NODES ARE CONSIDERED ANDF1−a v eIS COMPARED.
Networks |V| |E| |C| F1−a v e pr ecisiona v e r ecalla v e (size > 50) MAPPR MLEO MAPPR MLEO MAPPR MLEO
com-dblp 317K 1.05M 100 0.167 0.224 0.197 0.666 0.225 0.155
com-amazon 335K 926K 100 0.648 0.684 0.838 0.924 0.555 0.587
com-youtube 1.13M 2.99M 100 0.232 0.331 0.270 0.371 0.303 0.430
com-lj 4.00M 34.7M 100 0.251 0.330 0.182 0.266 0.556 0.536
TABLE III
COMPARISON BETWEEN THEMLEOALGORITHM AND THEMAPPRALGORITHM,WHERE THE MOTIF IS A TRIANGLE. BOTH ALGORITHMS USE
RANDOMLY SELECTED SEEDS. ATOTAL OF100COMMUNITIES WITH MORE THAN50NODES ARE CONSIDERED ANDF1−m a xIS COMPARED.
Networks |V| |E| |C| F1−m a x pr ecisionm a x r ecallm a x (size > 50) MAPPR MLEO MAPPR MLEO MAPPR MLEO
com-dblp 317K 1.05M 100 0.406 0.603 0.314 0.748 0.853 0.618
com-amazon 335K 926K 100 0.940 0.960 0.914 0.951 0.982 0.976
com-youtube 1.13M 2.99M 100 0.440 0.500 0.390 0.465 0.711 0.744
com-lj 4.00M 34.7M 100 0.459 0.529 0.318 0.391 0.991 0.964
average degree is 30, the maximum degree is 50, and the community size ranges from 50 to 500.
C. Recovering communities in networks using MLEO
We compare the MLEO and MAPPR algorithms on real networks with the ground truth communities. We analyze the ground truth community on several well-known networks, including dblp, amazon, youtube, and com-LiveJournal. For each network, we use a triangle (shown in Figure 1) as a motif and randomly select nodes as seeds to examine 100 communities with more than 50 nodes. The experimental data sets and results are presented in Tables II and III. The experimental results demonstrate that our algorithm performs better in terms of F1 and precision with
the ground truth community in these networks than MAPPR, and its recall is also competitive.
We also examine different motifs in several directed real networks and randomly select 50 seeds from the network to obtain the average local motif rate (without special expla-nation, the following experiment generally sets α to 1) of the community. The datasets include Florida-bay, C-elegans-frontal, email-Eu-core, cit-HepPh, soc-Slashdot0811, and web-Stanford. The results are shown in Table IV. There is no
M4 in the Florida-bay network, and thus, it is indicated by
a horizontal line.
The references [23], [26] offer some selected interesting experiments on Florida Bay. To further demonstrate our al-gorithm, we search for higher-order graph clustering of the Florida-bay food web, which represents the carbon exchange in Florida Bay. In this work, we use M7 as the motif, i.e.,
we examine the clustering of this carbon exchange pattern in this network. As shown in Figure 5A, a total of 57 nodes, including M7, are grouped into 5 clusters. To illustrate the
result clearly, we use Figure 5B to represent the purple clusters in Figure 5A. This higher-order cluster shows that Eels and Lizardfish eat each other, and they are food for several animals. Nodes 100 (Loon), 103 (Comorant), 110 (Predatory Ducks), 111 (Raptors) are overlapping nodes of the purple and green communities. These animals can both prey on fish and have more food sources on the shore.
D. Obtaining good seeds
TABLE IV
RANDOMLY SELECTED50NODES FROM THE REAL NETWORK AS SEEDS TO OBTAIN THE AVERAGE LOCAL MOTIF RATE(α= 1)OF THE COMMUNITY,
WHERE THE MOTIF ISM1−M7.
Networks |V| |E| Local Motif Rate
M1 M2 M3 M4 M5 M6 M7
Florida-bay 128 2106 0.943 0.766 1.000 − 0.662 0.706 0.692 C-elegans-frontal 131 764 0.928 0.781 0.733 0.850 0.415 0.523 0.652 email-Eu-core 1005 25571 0.492 0.322 0.404 0.445 0.346 0.300 0.362 cit-HepPh 34546 421578 0.943 0.935 0.992 1.000 0.392 0.758 0.774 soc-Slashdot0811 77360 905468 0.695 0.329 0.227 0.326 0.240 0.265 0.292 web-Stanford 281903 23124907 0.889 0.703 0.896 0.884 0.441 0.829 0.560
TABLE V
SEED STRATEGY ON REAL NETWORKS. OS, NS,ANDMSREPRESENT ORIGINAL SEED,NEIGHBOR SEED,AND MOTIF SEED.
Network
F1−a v e F1−m a x
Triangle Quadrangle Triangle Quadrangle
OS NS MS OS NS MS OS NS MS OS NS MS
com-dblp 0.224 0.181 0.182 0.234 0.271 0.297 0.603 0.549 0.562 0.453 0.509 0.538 com-amazon 0.684 0.703 0.705 0.490 0.574 0.582 0.960 0.960 0.966 0.907 0.907 0.909
A 15
16
17 18 19 20
21 22
23
24 25 26
29 30
31
33 34 35 36
37 38 39
40
43 44 47
48 49 50
52
54
59 60
61 65
75 76
86 89
90
91
95 98
99
100 101
102
103 104
110 111 116
120 122
123
126
127
Lizardfish 59
Eels 61
100 Loon
102 Pelican
103 Comorant
110 Predatory Ducks
111 Raptors
116 Crocodiles
B
Fig. 5. M7is used for higher-order graph clustering of the Florida-bay food web. A: 57 nodes containing motifM7. The algorithm finds 5 clusters and uses
different colors for representation. B: Clear illustration of the purple community in A.
com-dblp, the original seed exhibits better community effect. We hypothesize that this result is related to seed size and community size. The size of the community that the neighbor seed or motif seed has obtained is two to three times that of the original seed. In synthetic networks, when triangles are used as motifs, motif seed and neighbor seed exhibit similar effects and are superior to the original seed. Considering the special nature of triangles, the resulting motif seed is a subset of the neighbor seed. We use a quadrangle (as shown in Figure 1) as the motif. The results indicate that the motif seed is similar to the neighbor seed when µ is less than or equal to 0.45. However, when µ is greater than 0.45, the effect is considerably better than that of the neighbor seed. We speculate that the motif seed is more effective than the neighbor seed in the case of more complex incomplete graphs because finding complex motifs is a complicated problem itself. We plan to complete this experiment in the future.
We use triangle and quadrangle as motifs, and adopt the original seed strategy for all nodes in several LFR models; that is, we do not process the seeds and use the MLEO algorithm directly for each node. We calculate the distribution of nodes with different M-degrees and the average local motif rate and
F1. The result is shown in Figure 7. Using a triangle as the
motif, as shown in Figures 7A and 7B, the trends of the local motif rate andF1 are highly similar and even notably close at
many values. In Figures 7C and 7D, quadrilaterals are used as motifs, and although the local motif rate andF1 values are not
close to each other, their trends and shapes are highly similar. In other words, our local motif rate can reflect the clustering results to a certain extent.
In Figure 7, the overall trend of F1 increases with an
increase in M-degree and decreases locally. In Figure 7A, when the M-degree is 2, the value of F1 is notably high,
which is equal to 1, but there is only one such point. We use the other nodes in this cluster as seeds, and the experimental results show that most of the clusters have anF1 value equal
to 1.
E. Adjustingαto discover communities with different sizes
Fig. 6. Results of using different seed strategies in the LFR model. For each data set, 100 original seeds are randomly selected using different strategies. A: When a triangle is used as the motif, the motif seed and neighbor seed exhibit similar effects and are better than the original seed. B: The motif seed and neighbor seed are better than the original Seed, where the motif seed is the same as the neighbor seed whenµis less than or equal to 0.45, but when the value ofµis larger, the motif seed effect is considerably better than that of the neighbor seed.
Girvan and Newman [42]. There are a total of 512 nodes, including 4 groups of benchmark data proposed by Girvan and Newman, with each group containing 128 nodes, which are divided into 4 communities, i.e., 32 nodes per community. We simply expand the data such that the edge density between the two sets of data is greater than that of the other two sets, as shown in Figure 8.
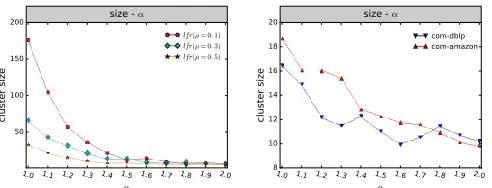
In the preceding network, a seed is selected and a triangle is used as motif. We change parameter α, use the MLEO algorithm for clustering and subsequently observe the change in cluster size with parameterα. The result is shown in Figure 9. We also apply the algorithm to synthetic and real networks. The result is shown in Figure 10. As αincreases, the average cluster size decreases. Our algorithm can find clusters with different sizes after adjusting parameter α. In Figure 9A, we increase the value of α with an increment of 0.01. With the increases in parameter α, the size of the cluster gradually decreases. To observe the changes further, we reduce the spacing and set it to 0.001, as shown in Figure 9B. After the spacing is decreased, we determine that the range of the
α values corresponds to different sizes of clusters. When α is within the range of 0.15 to 1.52, the cluster size is 32, and its range is relatively large, thereby indicating that the community structure is relatively stable, which is consistent with the network proposed by Girvan and Newman. Proving the stability of a community structure still remains an open question, and we plan to investigate it in a future study.
V. DISCUSSION AND CONCLUSION
[image:10.612.320.552.58.317.2]In this study, we propose the local motif rate to improve the density of motifs in a cluster for higher-order graph clustering. Compared with motif conductance, this rate is superior in
Fig. 7. Distribution and clustering results at different M-degrees. Triangles and quadrilaterals are used as motifs for clustering under several different LFR networks. In the four graphs, 1 denotes the distribution of M-degrees, and 2 denotes the average of the clustering results that correspond to all nodes as seeds in the M-degree.
Fig. 8. Expansion of the 4 Girvan and Newman benchmark networks into a hierarchical network with 512 nodes.
measuring the degree of clustering in a local area. The experi-mental results show that our proposed method exhibits similar trends and shapes in terms ofF1 values and can respond to the
degree of higher-order graph clustering. The local motif rate allows us to adjust the parameterα and control the size of a cluster. This approach can be applied to hierarchical clustering. Additionally, clustering stability can be estimated by adjusting the range of parameter αthat corresponds to cluster size.
[image:10.612.366.509.394.537.2]512
256
128
32
12 7
512
256
128
32
[image:11.612.49.300.56.146.2]Fig. 9. Cluster size changes with parameter αunder the MLEO algorithm when a triangle is used as the motif. A: The value of parameter αranges from 0.01 to 2, and the distance is 0.01. B: The value of parameterαranges from 0.001 to 0.2, and the pitch is 0.001.
Fig. 10. Cluster size changes with parameterαin synthetic and real networks when a triangle is used as motif.
node with a higher degree can be used as a seed to obtain a better community, and thus, we compare the experimental findings under different M-degrees, showing that selecting nodes with a higher M-degree as seeds is more likely to achieve robust clusters.
In addition, we apply the concept of local extension op-timization to higher-order graph clustering and propose an MLEO algorithm. This algorithm is a purely local method, and thus, it has no need to recognize the information of the entire network and can avoid the distortion caused by conversion to a weighted graph. In the experiment of directed and undirected graphs, we prove that the performance of MLEO can meet the standard of higher-order clustering. Higher-order graph clustering has a wide range of application scenarios. We can further compare the clusters with different motifs in the network to determine which collaboration model can achieve more extensive cooperation in scientific research.
REFERENCES
[1] T. He, L. Cai, T. Meng, L. Chen, Z. Deng, and Z. Cao, “Parallel Community Detection Based on Distance Dynamics for Large-Scale Network,”IEEE Access, vol. 6, pp. 42 775–42 789, 2018.
[2] S. Fortunato and D. Hric, “Community detection in networks: A user guide,”Physics Reports, vol. 659, pp. 1–44, Nov. 2016.
[3] T. Wang, J. Tan, W. Ding, Y. Zhang, F. Yang, J. Song, and Z. Han, “Inter-Community Detection Scheme for Social Internet of Things: A Compressive Sensing Over Graphs Approach,”IEEE Internet of Things Journal, pp. 1–1, 2018.
[4] J.-S. Lee and T.-Y. Kao, “An Improved Three-Layer Low-Energy Adap-tive Clustering Hierarchy for Wireless Sensor Networks,”IEEE Internet of Things Journal, vol. 3, no. 6, pp. 951–958, Dec. 2016.
[5] M. Ren, J. Zhang, L. Khoukhi, H. Labiod, and V. Vèque, “A Unified Framework of Clustering Approach in Vehicular Ad Hoc Networks,”
IEEE Transactions on Intelligent Transportation Systems, vol. 19, no. 5, pp. 1401–1414, May 2018.
[6] R. S. Bali and N. Kumar, “Secure clustering for efficient data dissemina-tion in vehicular cyber–physical systems,”Future Generation Computer Systems, vol. 56, pp. 476–492, Mar. 2016.
[7] C. Chen, B. Wang, and R. Zhang, “Interference Hypergraph-Based Resource Allocation (IHG-RA) for NOMA-Integrated V2x Networks,”
IEEE Internet of Things Journal, vol. 6, no. 1, pp. 161–170, Feb. 2019. [8] G. Xie, G. Zeng, J. Jiang, C. Fan, R. Li, and K. Li, “Energy management for multiple real-time workflows on cyber–physical cloud systems,”
Future Generation Computer Systems, May 2017.
[9] G. Xie, G. Zeng, Y. Liu, J. Zhou, R. Li, and K. Li, “Fast Functional Safety Verification for Distributed Automotive Applications During Early Design Phase,” IEEE Transactions on Industrial Electronics, vol. 65, no. 5, pp. 4378–4391, May 2018.
[10] G. Xie, G. Zeng, R. Kurachi, H. Takada, R. Li, and K. Li, “Exact WCRT analysis for message-processing tasks on gateway-integrated in-vehicle CAN clusters,” vol. 17, no. 6, pp. 95:1–95:29.
[11] J. J. Whang, D. F. Gleich, and I. S. Dhillon, “Overlapping Community Detection Using Neighborhood-Inflated Seed Expansion,”IEEE Trans-actions on Knowledge and Data Engineering, vol. 28, no. 5, pp. 1272– 1284, May 2016.
[12] H. Yin, A. R. Benson, J. Leskovec, and D. F. Gleich, “Local higher-order graph clustering,” in Proceedings of the 23rd ACM SIGKDD International Conference on Knowledge Discovery and Data Mining. ACM, 2017, pp. 555–564.
[13] I. M. Kloumann and J. M. Kleinberg, “Community membership identifi-cation from small seed sets,” inProceedings of the 20th ACM SIGKDD international conference on Knowledge discovery and data mining. ACM, 2014, pp. 1366–1375.
[14] S. Fortunato, “Community detection in graphs,”Physics reports, vol. 486, no. 3-5, pp. 75–174, 2010.
[15] S. E. Schaeffer, “Graph clustering,”Computer Science Review, vol. 1, no. 1, pp. 27–64, Aug. 2007.
[16] F. Havemann, M. Heinz, A. Struck, and J. Gläser, “Identification of overlapping communities and their hierarchy by locally calculating community-changing resolution levels,”Journal of Statistical Mechan-ics: Theory and Experiment, vol. 2011, no. 01, p. P01023, 2011. [17] L. Cai, T. Meng, T. He, L. Chen, and Z. Deng, “K-Hop community
search based on local distance dynamics,” inLecture Notes in Computer Science (including subseries Lecture Notes in Artificial Intelligence and Lecture Notes in Bioinformatics), vol. 10638 LNCS, 2017, pp. 24 – 34. [18] P. Li, H. Dau, G. Puleo, and O. Milenkovic, “Motif clustering and overlapping clustering for social network analysis,” inINFOCOM 2017-IEEE Conference on Computer Communications. IEEE, 2017, pp. 1–9. [19] R. Milo, S. Shen-Orr, S. Itzkovitz, N. Kashtan, D. Chklovskii, and U. Alon, “Network Motifs: Simple Building Blocks of Complex Net-works,”Science, vol. 298, no. 5594, pp. 824–827, Oct. 2002. [20] Ö. N. Yavero˘glu, N. Malod-Dognin, D. Davis, Z. Levnajic, V. Janjic,
R. Karapandza, A. Stojmirovic, and N. Pržulj, “Revealing the Hidden Language of Complex Networks,” Scientific Reports, vol. 4, p. 4547, Apr. 2014.
[21] H. Shakeri, P. Poggi-Corradini, N. Albin, and C. Scoglio, “Network clustering and community detection using modulus of families of loops,”
Physical Review E, vol. 95, no. 1, p. 012316, 2017.
[22] C. Klymko, D. Gleich, and T. G. Kolda, “Using triangles to im-prove community detection in directed networks,” arXiv preprint arXiv:1404.5874, 2014.
[23] A. R. Benson, D. F. Gleich, and J. Leskovec, “Higher-order organization of complex networks,”Science, vol. 353, no. 6295, pp. 163–166, 2016. [24] ——, “Tensor spectral clustering for partitioning higher-order network structures,” inProceedings of the 2015 SIAM International Conference on Data Mining. SIAM, 2015, pp. 118–126.
[25] R. Andersen, F. Chung, and K. Lang, “Local graph partitioning using pagerank vectors,” inFoundations of Computer Science, 2006. FOCS’06. 47th Annual IEEE Symposium on. IEEE, 2006, pp. 475–486. [26] P. Li and O. Milenkovic, “Inhomogeneous Hypergraph Clustering with
Applications,” inAdvances in Neural Information Processing Systems, 2017, pp. 2308–2318.
[27] A. Lancichinetti, S. Fortunato, and J. Kertész, “Detecting the overlap-ping and hierarchical community structure in complex networks,”New Journal of Physics, vol. 11, no. 3, p. 033015, Mar. 2009.
[28] C. Lee, F. Reid, A. McDaid, and N. Hurley, “Detecting highly overlap-ping community structure by greedy clique expansion,”arXiv preprint arXiv:1002.1827, 2010.
[image:11.612.53.299.209.303.2][30] J. Xie, S. Kelley, and B. K. Szymanski, “Overlapping community detection in networks: The state-of-the-art and comparative study,”ACM Computing Surveys, vol. 45, no. 4, pp. 1–35, Aug. 2013.
[31] D. Zhou, J. Huang, and B. Schölkopf, “Learning with Hypergraphs: Clustering, Classification, and Embedding,” in Advances in Neural Information Processing Systems 19, B. Schölkopf, J. C. Platt, and T. Hoffman, Eds. MIT Press, 2007, pp. 1601–1608.
[32] P. Li and O. Milenkovic, “Submodular Hypergraphs: p-Laplacians, Cheeger Inequalities and Spectral Clustering,” 2018, pp. 3020–3029. [33] C. E. Tsourakakis, J. Pachocki, and M. Mitzenmacher, “Scalable
Motif-aware Graph Clustering,” in Proceedings of the 26th International Conference on World Wide Web - WWW ’17. Perth, Australia: ACM Press, 2017, pp. 1451–1460.
[34] B. Liao, X. Li, L. Cai, Z. Cao, and H. Chen, “A Hierarchical Clustering Method of Selecting Kernel SNP to Unify Informative SNP and Tag SNP,”IEEE/ACM Trans. Comput. Biol. Bioinformatics, vol. 12, no. 1, pp. 113–122, Jan. 2015.
[35] A. Sarkar, Y. Ren, R. Elhesha, and T. Kahveci, “A new algorithm for counting independent motifs in probabilistic networks,”IEEE/ACM Transactions on Computational Biology and Bioinformatics, pp. 1–1, 2018.
[36] S. Wernicke, “Efficient Detection of Network Motifs,”IEEE/ACM Trans-actions on Computational Biology and Bioinformatics, vol. 3, no. 4, pp. 347–359, Oct. 2006.
[37] M. Latapy, “Main-memory triangle computations for very large (sparse (power-law)) graphs,”Theoretical Computer Science, vol. 407, no. 1-3, pp. 458–473, 2008.
[38] N. H. Tran, K. P. Choi, and L. Zhang, “Counting motifs in the human interactome,”Nature Communications, vol. 4, no. 1, p. 2241, Dec. 2013. [39] J. Leskovec, “Stanford Large Network Dataset Collection,” 2014. [40] J. Leskovec and R. Sosiˇc, “SNAP: A General-Purpose Network Analysis
and Graph-Mining Library,”ACM Transactions on Intelligent Systems and Technology, vol. 8, no. 1, pp. 1:1–1:20, Jul. 2016.
[41] A. Lancichinetti, S. Fortunato, and F. Radicchi, “Benchmark graphs for testing community detection algorithms,”Physical review E, vol. 78, no. 4, p. 046110, 2008.
[42] M. Girvan and M. E. J. Newman, “Community structure in social and biological networks,”Proceedings of the National Academy of Sciences, vol. 99, no. 12, pp. 7821–7826, Jun. 2002.
Wenhong Mais currently working toward the Ph.D. degree with Hunan University, Changsha, China. His current research interests data mining,big data analysis, automotive cyber-physical systems, and embedded and cyber-physical systems.
Lijun Cai received the Ph.D. degree in College of Computer Science and Electronic Engineering from Hunan University in 2007. He is currently a Professor at Hunan University. His research interests include bioinformatics, cloud computing, big data scheduling and management.
Tingqin He received the M.S. degree in College of Computer Science and Electronic Engineering, from Hunan University, Changsha, China. He is currently pursuing the Ph.D. degree in the College of Infor-mation Science and Engineering, Hunan University, Changsha, China. His research interests include date mining, cloud computing, big data analysis.
Lei Chenreceived the PhD degree from Hunan Uni-versity in 2017. He is currently a lecturer at Hunan University of Science and Technology. His research interests include date mining, web mining, graph mining, cloud computing, and big data scheduling and analysis.
Zehong Caois a Lecturer (a.k.a. Assistant Profes-sor) with Discipline of Information and Commu-nication Technology (ICT), School of Technology, Environments and Design, College of Sciences and Engineering, University of Tasmania (UTAS), Ho-bart, Australia, and an Adjust Fellow with School of Computer Science, Faculty of Engineering and Information Technology, University of Technology Sydney (UTS), Australia. He received the dual PhD degree in Information Technology from UTS, and Electrical and Control Engineering from National Chiao Tung University (NCTU) in Taiwan. His research interests cover Fuzzy Sets and Systems, Fuzzy Neural Networks, Brain-Computer Interaction, Biosignal Processing, Game-based Machine Learning, and Data Mining.
![Table I.The LFR [41] is a model for generating benchmark datasetsto synthesize the network](https://thumb-us.123doks.com/thumbv2/123dok_us/8390407.323338/7.612.51.301.61.209/table-lfr-model-generating-benchmark-datasetsto-synthesize-network.webp)