1
A finer-grained approach to assessing the ‘quality’ (‘quantity’ and
‘richness’) of risk management disclosures
Jing Jia, Lois Munro, Sherrena Buckby
Abstract:
Purpose – Utilising a finer-grained approach, this paper examines the ‘quality’ of narrative risk
management disclosures (RMD) from a ‘quantity’ and ‘richness’ (width and depth) perspective. Evidence is then provided on the relationships between RMD quality and the corporate determinants driving that quality.
Design/methodology/approach – Within a multidimensional quality disclosure framework, annual
report narrative RMD from the top 100 Australian Securities Exchange (ASX) listed companies precisely ‘matched’ for the 2010 and 2012 years were examined using semantic content analysis. The
relationship between the dimensions and sub-dimensions of RMD ‘quantity’ and ‘richness’, and
various corporate characteristics were explored using ordinary least squares (OLS) regression analysis.
Findings – The results indicate that RMD are considerably lacking in quality, from the ‘quantity’,
‘width’ and particularly the ‘depth’ dimension and sub-dimensions for both years. Many companies provide ‘boiler plate’ RMD over consecutive years and many do not comply with the intent of the
ASX Corporate Governance Principles and Recommendations (CGPR) under the ‘if not, why not’
regime (ASX CGC 2010). Company size and cross listing were found to be the primary determinants of higher quality RMD and to a lesser extent firm risk. Some evidence was found that ‘quality’ RMD were less likely where companies are more highly leveraged and when their shareholders are more concentrated.
Research limitations/implications – Although two coders independently coded the RMD and
specific decision rules were followed, the subjectivity inherent in conducting semantic content analysis into the dimensions and sub-dimensions of the framework cannot be completely eliminated. However, by adopting a finer-grained approach this study contributes to the global literature on the quality of RMD. Previous studies are extended by analysing and testing the individual dimensions
and sub-dimensions of ‘quantity’ and ‘richness’ which provides new empirical evidence and a more
comprehensive portrayal of RMD quality and a greater understanding why some companies are more likely to disclose higher quality RMD than others.
Practical implications –These results provide useful and predominantly new empirical evidence on
the quality of RMD for practitioners, regulators and researchers. As many companies are not complying with the ‘intent’ of the ‘if not, why not’ approach, these results support the argument for mandated narrative RMD regulations at an international level.
Originality/value – The multidimensional framework of RMD ‘quantity’ and ‘richness’ provides a
bases for examining not only how much is disclosed, but what is disclosed and how. In adopting a
finer-grained approach, this study analyses and tests the individual dimensions and sub-dimensions of the framework. This provides a deeper understanding of the overall quality of RMD and the determinants driving RMD quality for the sample companies.
Keywords Risk management disclosures, Quality, Quantity, Richness, Width, Depth, Determinants.
2 Introduction
High quality narrative RMD can assist investors, shareholders and analysts in making superior investment decisions (Lajili and Zéghal, 2005; Miihkinen, 2012), by enabling accuracy in determining the risk profile of companies (Linsley et al., 2008) and in assessing the potential impact of risks on a firms’ value and growth (Clarkson et al., 1999; Lajili and Zéghal 2005; Elshandidy and Neri, 2015). However, many companies have neglected to provide adequate and meaningful RMD (Cabedo and Tirado, 2004; Beretta and Bozzolan, 2008; Perignon and Smith, 2010). This was a significant contributor to both the cause and the severity of the global financial crisis (ASX CGC, 2013), prompting the United States (US) Securities Exchange Commission (SEC) to warn companies about providing generic non-company specific RMD (Johnson, 2010). In response there has been an international drive by academics, regulators and professionals for higher quality RMD (ASB, 2009; Dobler et al., 2011; FASB, 2001a; ICAEW, 2011; Ismail and Rahman, 2011; Abraham and Shrives, 2014).
Research on the quality of RMD is extremely important from a global perspective given the differing regulatory and institutional settings in various jurisdictions. This study is conducted in Australia where a unique environment exists in which to examine narrative RMD as they are neither mandatory, nor purely voluntary. The Australian RMD regulatory framework is principle-based and self-regulatory, where an ‘if not, why not’ approach has been adopted since 2003. Principle 7 ‘Recognise and Manage Risk’ of the ASX Corporate Governance Principles and Recommendations (CGPR) Second Edition (ASX CGC, 2010), provides the primary guidance for RMD at the time of this study. Principle 7 recommends that companies need to consider disclosing all material business risks and if they do not an explanation should be provided.
3 managers in a positive light. More recently Buckby et al. (2015) discover divergent RMD practices, which are unlikely to depict underlying corporate risks, when examining the top 300 ASX listed companies in 2010. These previous Australian studies focus predominantly on the total quantity of RMD overlooking the examination of ‘richness’.
The objective of this study is to utilise a finer-grained approach to examine the ‘quality’ - ‘quantity’ and ‘richness’ (width and depth) of RMD for the top 100 ASX listed companies, by adopting the multidimensional disclosure framework proposed and tested by Beretta and Bozzolan (2008). They argue that although assessing disclosure quality is inherently complex, merely adopting quantity measures alone are not a good proxy for disclosure quality. The utilisation of this framework enables the ‘capture’ of quality dimensions not achievable by adopting a simplistic approach. The top 100 ASX listed companies for the 2012 financial year will be precisely ‘matched’ to the same companies for the 2010 financial year. These years were specifically selected as representing a time frame where there have been no institutional changes to RMD regulations, i.e. following the adoption of the second edition of the ASX CGPR (ASX CGC, 2010), but before the release of the consultation draft on the third edition of the ASX CGPR (ASX CGC, 2013). It is within this time frame that the ASX CGC has determined that the ‘if not, why not’ approach may not be working effectively. Therefore it is important to provide empirical evidence on the quality of RMD and whether RMD were updated during this time in accordance with the intent of ASX CGPR (ASX CGC, 2010), or whether company compliance with the ‘if not why not’ regime is deficient. To acquire further insights statistical analysis was performed to determine the relationships between total RMD and various sub-dimensions of RMD quality and the determinants driving that quality. In order to achieve this objective two research questions have been developed.
RQ1. What is the ‘quality’ - ‘quantity’ and ‘richness’ of RMD for the top 100 ASX listed companies?
RQ2. What are the determinants driving ‘quality’ - ‘quantity’ and ‘richness’ of
RMD for the top 100 ASX listed companies?
4 companies. First, a large proportion of disclosures for both years contained ‘information not relevant to RM’. This confirms that merely counting the number of sentences or words does not adequately measure the amount of useful information. Additionally, many companies produced ‘boiler plate’ RMD for 2010 and 2012. These RMD were subsequently examined for the 2011 year and found to be identical/close to identical to the years previously examined. Thus, the RMD for these companies were ‘boiler plate’ in three consecutive annual reports. Second, a large number of ‘information relevant to RM’ disclosures for both years, could only be classified as ‘general risk’, rather than within the ‘13 specific risk categories’ as recommended in the ASX CGPR (ASX CGC 2010). This indicates that many disclosures are vague and are not providing users with meaningful ‘company specific’ risk information. Third, companies provided a low level of ‘forward-looking’, ‘financial’ and ‘negative’ RMD, with an almost non-existent number of ‘monetary’ and ‘positive’ RMD in both years. These results strongly indicate that the ‘richness’ attributes of ‘width’ and ‘depth’ most useful to users, are severely lacking in RMD for the top 100 ASX listed companies in Australia. They also reaffirm the assertion that analysing quantity (total RMD) alone is not a good proxy for quality.
In answering RQ2, results of the OLS regression analysis for the pooled data (2010 and 2012) reveal numerous significant associations between company determinants and the ‘quantity’ and ‘richness’ (width and depth) sub-dimensions of the RMD framework. Firm size is positively associated with total RMD and the seven sub-dimensions of the framework that arguably produce a higher quality of RMD. Cross listing is also positively associated with total RMD and the seven dimensions. Leverage is negatively associated with two sub-dimensions, while firm risk is positively associated with two sub-dimensions. The results for
RQ1 and RQ2 clearly demonstrate that by conducting a ‘finer-grained’ analysis of the quality of RMD and exploring the determinants driving quality, a more comprehensive understanding of RMD quality is depicted compared to more simplistic approaches.
5 of RMD aiming towards an international mandatory approach would assist in the advancement of RMD quality. This research may also be useful to the capital markets, as high quality RMD can significantly improve market liquidity through a reduction in information asymmetry thus increasing the flow of capital into the markets (Campbell et al., 2014; Elshandidy and Neri, 2015). The Australian equities market is the fifth largest in the world with a total market capitalisation of AU$ 1.28 trillion in 2012 (ASX Limited 2012), with foreign investors owning at least 40% (Black and Kirkwood, 2010). Consequently the quality of RMD for Australian listed companies’ is important both domestically and internationally, and is integral to the availability, accessibility and security of funds in the capital markets.
Literature review
International mandatory and voluntary studies
Although there is a consensus on the need for informative narrative RMD, opinions differ as to whether these should be mandatory or voluntary (Cabedo and Tirado, 2004) and as yet the International Accounting Standards Board (IASB) has not issued a mandatory risk reporting standard (Elshandidy et al., 2013; Campbell et al., 2014). A dilemma facing regulators is that if the requirements are too prescriptive RMD may become ‘uniform’ providing minimal useful company specific information to investors. Conversely, where RMD are ‘optional’ companies may provide little or no risk management information. The underlying motives influencing how much companies disclose and the usefulness of disclosures also vary depending on whether the RMD are mandatory or voluntary (Miihkinen, 2012; Elshandidy and Neri, 2015).
Studies have been conducted in various countries that have adopted International Financial Reporting Standards where, under IFRS7 ‘Financial Instruments: Disclosures’, mandatory RMD are required in the Notes to the Accounts for financial instruments [1]. For example, Lajili and Zéghal (2005) in Canada, Hassan (2009) in the United Arab Emirates,
Taylor et al. (2010) in Australia, Elshandidy et al. (2013) in the United Kingdom (UK) and Domínguez and Gámez (2014) in Spain.
6 forward-looking information in the Management Discussion and Analysis (MD&A) section of annual reports filed on a 10K-form (Clarkson et al., 1999; Lajili and Zéghal 2005; Amran
et al., 2009). Recent research suggests these RMD appear to be firm specific and are more
useful to investors’ in assessing risk (Kravet and Muslu, 2013; Campbell et al., 2014). Studies have examined RMD following the implementation of the German Accounting Standards Board’s GAS 5 ‘Risk Reporting’. Results reveal an increase in RMD over time, but they are predominantly qualitative (compared to quantitative), historical, non-time specific and concentrate on general risk factors (Vielmeyer, 2004; Kajüter, 2004). The Finnish Accounting Practice Board published a risk disclosure standard in 2006, which specifies reporting requirements. The overall quality of RMD improved post-standard with more qualitative information, but only a marginal increase in quantitative information (Miihkinen 2012). The improvements under mandatory regimes can be explained by litigation theory, where the threat of litigation from regulatory authorities for inadequate disclosures (Healy and Palepu, 2001), can provide the motivation for improving RMD quality.
Voluntary narrative RMD are also encouraged in various jurisdictions, within domestic regulatory frameworks (CICA, 2001; FASB, 2001b; ICAEW, 2002). All promote the disclosure of financial and non-financial information, strategies and actions to mitigate risk, forward-looking information and other information to clarify the risk profile of the company. Studies examining voluntary disclosures in the UK have found non-monetary RMD are much more prevalent than monetary, are generally lacking in coherence and are non-specific (Linsley and Shrives, 2005; 2006). The findings in a later longitudinal study were similar, where RMD were very general rather than specific, qualitative rather than quantitative, non-company specific, were often ‘boilerplate’ and of limited use to investors (Abraham and Shrives, 2014). They attribute this finding to the threat of proprietary costs restricting managements’ willingness to disclose higher quality RMD. Proprietary cost theory does suggest that companies may produce RMD that are unhelpful to users, as managers will trade off the benefits of increased disclosure against the potential costs of disclosing (Abraham and Shrives, 2014). Therefore, companies may have an incentive not to disclose ‘firm specific’ information as this may reduce their competitive advantage (Healy and Palepu, 2001; Cotter
et al., 2011).
7 Italian companies provided more mandatory RMD than voluntary. Dobler et al. (2011) compared RMD in all sections of the annual reports (mandatory and voluntary) for companies in the US, Canada, the UK and Germany. They found a prevalence of qualitative (compared to quantitative), historic, present and non-time specific (compared to forward-looking) RMD. They suggest this may be due to management withholding quantitative and forward-looking information in order to avoid the negative consequences of disclosure. Litigation theory suggests that the threat of stakeholder litigation can provide a disincentive for voluntary disclosures (Healy and Palepu, 2001), particularly when the information is subjective or based on estimates.
Common approaches to RMD research
Content analysis is commonly used to examine RMD and at a basic level is based on counting the total number of sentences or total number of specific words. Studies using this approach find that RMD in many countries lack specificity and depth, showing a low level of forward-looking and quantitative information (Linsley and Shrives, 2005; 2006; Lajili and Zéghal, 2005; Linsley et al., 2006; Abraham and Cox, 2007; Amran et al., 2009; Dobler et al., 2011; Oliveira et al., 2011; Mokhtar and Mellett, 2013; Al-Najjar and Abed, 2014).
A disclosure index, can be, self-constructed, an adopted index or a readability index (see Hassan, 2009; Taylor et al., 2010; Hemrit and Arab, 2011; Domínguez and Gámez, 2014). All attempt to measure the level and indicate the quality of RMD by developing a numerical indicator. Studies using this approach have found RMD to be of a low level of quality (Beretta and Bozzolan, 2004; Lajili and Zéghal, 2005).
Textual analysis and semantic properties of RMD
8 then sub-categorised. They found that where the companies’ risk factors are higher there is an increased number of RMD and that the type of risk determines the number of RMD, providing evidence that RMD are useful to investors.
Consistent with prior research, this study will adopt a manual content analysis approach which will include examining the semantic properties of RMD (Beretta and Bozzolan, 2004, 2008; Cerbioni and Parbonetti, 2007; Miihkinen 2012). This analysis will focus on how much is disclosed (the quantity of disclosures), what is disclosed and how, that is the richness of the content of disclosures (Beretta and Bozzolan, 2008). The semantic properties of information serve as useful proxies for the quality of RMD and “allow external users to look at firms through the eyes of management” (Cerbioni and Parbonetti, 2007, p. 806).
RMD Framework
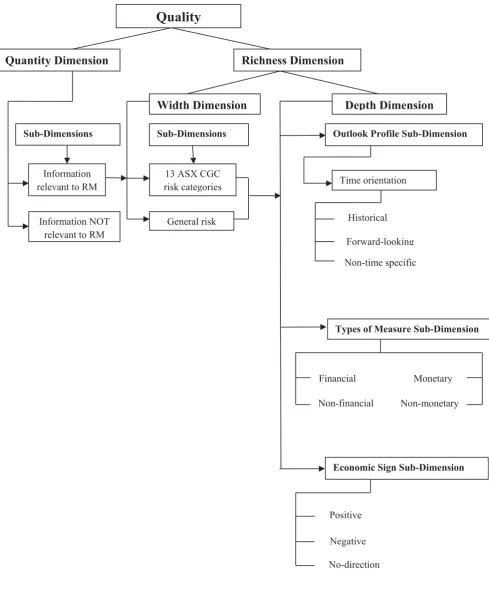
Three dimensions and seven sub-dimensions of the disclosure framework proposed by Beretta and Bozzolan (2008) will be adopted and applied to the Australian regulatory context to examine the quality of RMD. The dimensions and sub-dimensions consist of: (i) quantity (‘information relevant to RM’ and ‘information not relevant to RM’), (ii) width (‘13 ASX CGPR risk categories’ and ‘general risk’) and (iii) depth (‘time orientation’, ‘types of measure’ and ‘economic sign’). Time orientation comprises of ‘historical’, ‘forward-looking’ and time specific’ information. Types of measure comprises of ‘financial’, ‘non-financial’, ‘monetary’ and ‘non-monetary’ information. Economic sign consists of ‘positive’, ‘negative’ and ‘no-direction’ information. Other studies have focused on only a select number of these variables for example, Linsley and Shrives (2005) examined forward-looking and quantified RMD. Miihkinen (2012) examined the semantic properties of quantity, coverage, qualitative, quantitative and outlook profile of RMD and calculated a composite score of RMD quality. In extending prior research this study will individually examine all the dimensions and sub-dimensions of the framework depicted in Figure 1. This will provide a finer-grained approach to investigating the ‘quantity’ and ‘richness’ of RMD quality.
[Insert Figure 1 here]
9 positively related”. This may be valid to some extent however; the advantage of analysing the sematic properties of content is that it provides more precise, detailed information, which is then aggregated in some meaningful way into numeric values for further analysis (Li, 2010). In their later paper Beretta and Bozzolan (2008) validated their multidimensional framework by testing the quantity and richness of forward-looking disclosures in the Italian stock market and found that the model was useful to financial analysts in forecasting earnings and in supporting investors’ economic decisions. Miihkinen (2012) also recognised the importance of adopting various elements of the framework. Thus, the authors contend that the adoption of this framework will provide a richer profile of corporate RMD in Australia than previous studies. Arguably some sub-dimensions provide more useful information to users than others and therefore could be considered as providing a higher quality of RMD.
Quantity - (‘Information relevant/not relevant to RM’)
Although total quantity is not a valid proxy for RMD quality in its entirety (Beretta and Bozzolan, 2008; Beattie et al., 2004b), the total quantity can indicate the effort that companies employ in providing comprehensive RMD (Shrives and Brennan, 2015) and has been shown to have a significant positive correlation with RMD quality (Miihkinen, 2012). Importantly, in this study, total quantity is assessed as representing quality based on whether the RMD includes ‘information relevant to RM’. That is, RMD are perceived to be meaningful only when they provide financial report users with relevant risk information for decision making. Conversely ‘information not relevant to RM’ is perceived to be not meaningful and does not provide users with relevant risk information. This distinction is extremely important as users require RMD that are useful in forming their own individual risk assessments (ICAEW, 2011). The distinction is also consistent with prior studies (Beretta and Bozzolan, 2004, 2008; Cerbioni and Parbonetti, 2007). Therefore only sentences useful to external users are recognised as providing RM information (Cheung et al., 2010) and are further coded according to the framework as they represent a higher quality of RMD.
Richness: Width - (‘13 ASX CGPR risk categories’ and ‘General risk’)
10 profile (Garcia-Meca and Martinez, 2005; Aerts et al., 2008; Oliveira et al., 2011). Conversely, general risk disclosures can only provide users with a ‘vague’ or an ‘overall’ view of a company’s risk and are inadequate for financial report users (Oliveira et al., 2011). It follows that RMD coded within the ‘13 ASX CGPR risk categories’ will provide a higher quality of RMD. Disclosures too vague to be coded to any of the specific categories were coded to ‘general risk’.
Richness:Depth
Time Orientation - (‘historical’, ‘forward-looking’ and ‘non-time specific’)
Forward-looking RMD are considered more useful to users than ‘historical’ or ‘non-time specific’ (Beretta and Bozzolan, 2004, 2008; Linsley and Shrives, 2005, 2006; Miihkinen, 2012) and are required to be included in the MD&A section under US SEC listing rules (Linsmeier et al., 2002; Lajili and Zéghal, 2005). Forward looking RMD play an important role in efficient market reactions being positively associated with the accuracy of analysts’ future earnings forecasts (Barron et al., 1999; Dietrich et al., 2001; Linsley and Shrives, 2000; 2005). Clarkson et al. (1999) also provide evidence that changes in forward-looking RMD vary directly with future company performance and can therefore positively affect the level of share price anticipation (Schleicher and Walker, 1999). The value of forward-looking RMD is in enabling investors to better assess the firms predicted future risks, economic performance and adjust their investment decisions accordingly (Linsley and Shrives, 2006; Dobler, 2008). Although predictive, provided forward-looking RMD are forecast accurately some of the risks should crystallise (Abraham and Shrives, (2014), thereby validating their usefulness to investors. However, managers are more likely to disclose historical rather than forward-looking RMD, because forward-looking RMD tend to be uncertain and could expose companies to potential claims or threats from users who rely on that information (Linsley and Shrives, 2005; 2006; Dobler, 2008; Oliveira et al., 2011). Historical and non-time specific RMD are considered unhelpful to investors and may not assist in providing an efficient and effective allocation of capital to the markets (Al-Najjar and Abed, 2014). Therefore, based on the above discussion and consistent with Beretta and Bozzolan (2008), ‘forward-looking’ RMD would indicate a higher quality of RMD.
Types of measure - (‘financial’, ‘non-financial’,‘monetary’ and ‘non-monetary’)
11 commodity price changes etc. In some instances these disclosures are then quantified into monetary terms, or remain as non-monetary terms. Previous studies advocate the usefulness of financial and monetary disclosures. For example, companies could quantify the risk size wherever possible to provide a monetary value in order to improve the quality of RMD and assist users to assess company risks (Linsley and Shrives, 2000; Beretta and Bozzolan, 2004). Under US SEC listing rules companies are required to quantify their RMD for interest rate risk, foreign currency exchange rate risk and commodity price risks in their MD&A section of 10-K filings (Linsmeier et al., 2002; Lajili and Zéghal, 2005). In reporting evidence on this Linsmeier et al. (2002) found that quantitative RMD reporting on adverse changes in interest rates, foreign currency exchange rates and commodity prices; provide investors with useful information by reducing uncertainty regarding changes in firm value. They found that following these disclosures there was a decline in trading volume sensitivity based on changes in these financial indicators.
It follows that ‘financial’ and ‘monetary’ RMD would indicate a higher quality. However, difficulties exist in relation to companies providing this information (Schrand and Eilliott, 1988; Linsley and Shrives, 2000; Beretta and Bozzolan, 2004). Managers are unlikely to quantify the monetary size of their risks, as this can be highly judgemental and difficult (Kadous et al., 2005). They also have incentives not to disclose quantitative or financial RM information, as they may be subsequently required to justify their prior estimates (Linsley and Shrives, 2005; Dobler, 2008; Oliveira et al., 2011), which may leave them vulnerable to litigation.
Economic sign - (‘positive’, ‘negative’ and ‘no-direction’)
12 undervaluation (Weisbach, 1988; Marsden et al., 2011). Therefore, both ‘positive’ and ‘negative’ disclosures would indicate a higher quality of RMD than ‘no-direction’.
Hypotheses development
This study will examine the impact of firm leverage, risk, size, and cross listing status on the total quantity of RMD, which is consistent with many previous disclosure studies (Abraham and Cox, 2007; Amran et al., 2009; Hassan, 2009; Taylor et al., 2010; Oliviera et al., 2011; Elshandidy et al., 2013; Campbell et al., 2014), and the individual sub-dimensions of RMD quality (RQ2).
Leverage
In many studies leverage has been identified as a factor that may influence the level of disclosures. Agency theory suggests that agency costs are higher for companies that have higher leverage, as increased debt levels allow potential wealth transfers from debtholders to shareholders (Jensen and Meckling, 1976). In order to reduce agency costs, highly leveraged firms may increase their RMD quality to satisfy their shareholders and to illustrate the companies’ ability to manage high leverage risk. By providing a higher quality of RMD companies can also signal to the capital market their success in managing risks in order to make their securities more attractive. Stakeholder theory suggests that shareholders in companies with high levels of debt require more informative disclosures in order to assess the risk level and how the company proposes to manage that risk. Alternatively, highly leveraged firms may be reluctant to disclose high quality RMD as high leverage increases the potential for bankruptcy risk and divulging too much information increases the company’s vulnerability (Miihkinen, 2012). According to proprietary cost theory, highly leveraged companies may be reluctant to reveal their proprietary information to competitors, as it may damage their competitive position (Healy and Palepu, 2001; Miihkinen, 2012).
13 shareholders and debtholders are in a bargaining position and therefore companies are more likely to provide a higher quality of RMD (Ahn and Lee, 2004). Therefore, a positive directional hypothesis is proposed:
H1. There is a positive association between leverage and RMD quality
Firm Risk
Systematic risk (beta) is a market based measure of risk which has been widely used in accounting research (Bowman, 1979; Linsley and Shrives, 2006). A higher beta risk may lead to an increase in material risks associated with company operations and share price instability (Tao and Hutchinson, 2013). According to stakeholder theory companies are more likely to provide a greater quantity of RMD in order to explain why they have such high risks, and to provide investors with a better understanding of how they propose to manage those risks (Linsley and Shrives, 2006; Dobler et al., 2011). However, some companies may not want to draw attention to the fact they have a high level of firm risk and in order to avoid costs they may be reluctant to disclose high quality RMD (Dobler et al., 2011). Proprietary cost theory suggests that companies may be reluctant to divulge firm specific information, particularly if it is negative, as it may reduce their competitiveness. Companies with low risk may want to highlight this achievement and therefore they may communicate a higher quality of RMD, signalling to the market their superior management skills in order to attract increased investment (Linsley and Shrives, 2006).
In general, the higher the firm risk the more likely shareholders are to demand higher quality RMD, which companies need to provide to satisfy their shareholders’. Both Dobler et al. (2011) and Miihkinen (2012) found that firms with high beta provide a higher total quantity of RMD, for Canadian and Finnish companies respectively. Therefore, a positive directional hypothesis is proposed:
H2. There is a positive association between firm risk and RMD quality.
Firm size
14 high quality RMD are necessary for large firms in order to satisfy the needs of a larger group of stakeholders (Amran et al., 2009). In addition larger companies have an incentive to improve investors’ confidence and reduce political sensitivities by providing higher quality RMD (Hassan, 2009). Larger companies also have the expertise and resources to cover the cost of producing high quality RMD (Miihkinen, 2012) and are therefore more likely to provide a higher quality of RMD.
Consistent with the above, studies reveal a positive association between firm size and total RMD quantity (Beretta and Bozzolan, 2004; Linsley and Shrives, 2005; 2006; Amran et al., 2009; Hemrit and Arab, 2011; Dobler et al., 2011; Elzahar and Hussainey, 2012; Elshandidy
et al., 2013). Importantly, Miihkinen (2012) found that firm size is significantly associated
with RMD quantity, coverage, qualitative, quantitative, and outlook profile information. Therefore, a positive directional hypothesis is proposed:
H3. There is a positive association between firm size and RMD quality.
Cross listing
Cross listed companies face greater regulation being subject to the listing rules of each jurisdiction they operate within. As a result, they may be exposed to a wider range and increased complexity of risks, including the potential of litigation for non-compliance. These companies are likely to have adopted more sophisticated RM policies and disclose a higher quality of RMD (Taylor et al., 2010). Additionally, cross listed companies have incentives to provide high quality RMD in order to signal ‘good news’ to the capital markets regarding their risks, risk management activities and the sustainability of their operations; which improves their access to financial resources (Elzahar and Hussainey, 2012). The relationship between cross listed companies and their diverse stakeholders is likely to be more complex, with companies endeavouring to satisfy all their stakeholders’ needs by balancing their competing demands (Roberts, 1992; Gray et al., 1996) thus driving the provision of higher quality RMD.
15 more likely to provide a higher quality of RMD as their requirements are more rigid than they are under the ‘if not, why not’ regime. For example, since 2005 the SEC has mandated that companies identify, discuss and analyse risk factors in relation to cash flows and their operations in Section 1A of their annual report on a 10-K form. The SEC reviews these disclosures and where companies have not provided adequate risk information they have been required to provide more (Johnson, 2010), thus providing a strong incentive for higher quality RMD. Therefore, a positive directional hypothesis is proposed:
H4. There is a positive association between cross listing and RMD quality.
Research design
Sample selection
The sample comprises the top 100 ASX listed companies ‘matched’ for the years 2012 and 2010, i.e. 100 ‘matched pairs’. The initial sample, selected in 2012, comprises the top 100 ASX listed companies measured by market capitalisation. These 100 companies were then precisely matched to the same companies in 2010. However, nine companies were removed from the initial 2012 sample as they could not be matched to the 2010 year. These were replaced with the next nine companies listed on the ASX by market capitalisation in 2012 that could be specifically matched to the same companies in 2010, thus bringing the total up to ‘100 matched pairs’. The sample profile by industry sector code is presented in Table 1.
16 [Insert Table 1 here]
Data analysis method
In order to answer RQ1 semantic content analysis was performed on the RMD included in the corporate governance statement of company annual reports [3]. The sentence as the text unit was adopted which is consistent with many previous studies (Lajili and Zéghal, 2005; Linsley and Shrives, 2005; 2006; Linsley et al., 2006; Abraham and Cox, 2007; Dobler, et al., 2011; Elshandidy et al., 2013; Abraham and Shrives, 2014). Content analysis is inevitably subjective (Milne and Adler, 1999; Linsley and Shrives, 2006; Li, 2010), therefore two approaches to minimise subjectivity were adopted (Milne and Adler, 1999). First, the data was coded using QSR Nvivo with one coder performing the initial data coding, which was then repeated by a second coder. Any coding differences between the two were discussed and the data re-analysed in order to reach a consensus decision. Second, the data evaluation and coding process followed a well-defined set of categories and specific decision rules developed by Linsley and Shrives (2006) [4]. Although these were developed and tested during content analysis of narrative RMD for firms listed on the FT-SE 100, they are generic, non-country specific and therefore are easily adopted in the Australian context.
The coding process then followed the quantity, width and depth dimensions of the RMD framework. Initially all sentences were coded within the quantity dimension as ‘information relevant to RM’ or ‘information not relevant to RM’. Consistent with prior research the sentences coded as not relevant were not analysed further (Linsley and Shrives, 2006; Abraham and Cox, 2007). Wilcoxon signed rank tests were conducted to compare the differences between the years and between the sub-dimensions. This test does not need to satisfy the normality assumption and has been used in other risk disclosures studies (Tufano, 1996; Linsley and Shrives, 2006).
17 Research model
As hypothesised a number of factors may influence RMD quality and the following regression model is utilized to test the association between potential determinants, total RMD and sub-dimensions of the framework.
Yi,t= a + b1LEVi,t+ b2BETAi,t+ b3lnMKTCAPi,t + b4CSLTi,t + b5ROAi,t + b6PTBi,t + b7SCONi,t +
b8INDUSi + b8YEARi + ɛi,t
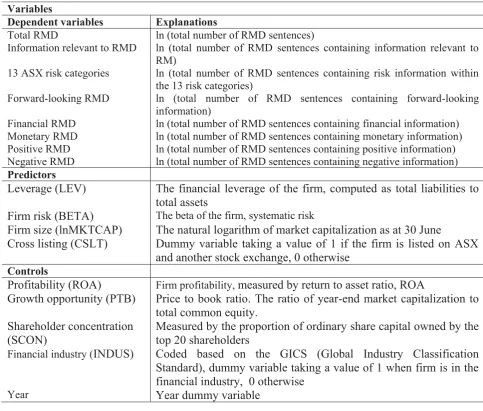
Table 2 presents a more detailed description of all variable definitions.
[Insert Table 2 here]
Dependent variables
The dependent variables represent sub-dimensions of the framework that arguably produce a higher quality of RMD; ‘total RMD’, ‘information relevant to RM’, ‘13 ASX risk categories’, ‘forward-looking’, ‘financial’, ‘monetary’, ‘positive’ and ‘negative’.
Independent variables and control variables
The independent variables of: leverage, firm risk, firm size and cross listing were utilised to test the four hypotheses. Consistent with prior literature, profitability (ROA), growth opportunity (PTB), shareholder concentration (SCON) and industry (INDUS) were selected as control variables (Miihkinen, 2012).
Profitability (ROA):
18
Growth opportunity (PTB):
Growth opportunity may impact RMD as investors tend to have high expectations of firms with high growth opportunity. Thus, growth firms are more likely to issue higher quality risk disclosures in order to satisfy these expectations (Miihkinen, 2012). Growth companies may also produce high quality RMD to mitigate information asymmetry problems and higher agency costs (Smith and Watts, 1992; Eng and Mak, 2003). Therefore, positive relationships between growth opportunity and RMD quality sub-dimensions are expected.
Shareholder concentration (SCON):
Shareholder concentration may impact RMD levels as agency theory suggests ownership structure affects the level of monitoring, which in turn affects the level of disclosures (Eng and Mak, 2003). Companies with a concentrated ownership structure may not be willing to provide high quality RMD, as their shareholders can obtain risk information privately (Miihkinen, 2012). Therefore, negative relationships between shareholder concentration and RMD quality sub-dimensions are expected.
Industry (INDUS):
Different industry sectors may provide quite different RMD due to industry specific characteristics. This particularly applies to the financial industry sector, which operates under a layer of increased regulation and scrutiny. Although it is acknowledged financial industry firms have additional mandatory requirements, which are not examined in this study, these companies may also produce higher quality RMD under the ‘if not, why not’ regime than companies in other sectors. As the financial industry sector comprises of 26% of the total sample, this study controls for industry effects by including the financial industry sector as a control variable (Amran et al., 2009) [5].
Results and discussion - RQ1
What is the quality of RMD?
19 Quantity
Table 3 shows that the number of RMD sentences totalled 4057 in 2012, (3775 in 2010). Of these 63% contained ‘information relevant to RM’, with 37% containing ‘information not relevant to RM’ in both years.
[Insert Table 3 here]
Examples follow:
Information Relevant to RM
“Changes in currency exchange rates may adversely affect ANZ’s result” (ANZ, 2010, p74).
“Atlas will establish and maintain risk and opportunity management by ensuring a consistent approach to capturing and evaluating risks and opportunities” (AGO, 2010, p37).
Information not Relevant to RM
“The Australian Government and its agencies, including APRA, the RBA and other financial industry regulatory bodies including the Australian Securities and Investment Committee, have supervisory oversight of ANZ” (ANZ, 2012, p67).
“The board receives updates from management in relation to Caltex’s approach to climate change” (CTX, 2010, p78).
The results of the quantity dimension strongly indicate that merely counting the total number of RMD sentences does not adequately measure the amount of ‘useful’ information, as companies may disclose a large amount of ‘information not relevant to RM’. This result supports Beretta and Bozzolan (2008) who advocate that the quantity of RMD is not necessarily a good proxy for quality.
20 either. Of the 21 companies where there were very minor changes in the wording of their RMD between 2010 and 2012, two companies had a very slight change in both 2011 and 2012; one company had exactly the same wording for 2010 and 2011 with a slight change occurring in 2012. The remaining 18 companies had very slight changes between 2010 and 2011, but were exactly the same between 2011 and 2012. Examples follow:
No change in RMD
“Crown has established policies for the oversight and management of material business risks and has adopted a formal Risk Management Policy. Risk management is an integral part of the industry in which Crown operates” (CWN, 2012, p38; 2011, p39; 2010, p38).
Minor changes in RMD
“Telstra has established a formal and robust approach for assessing, treating and monitoring risks related to the successful pursuit of its business” (TLS, 2010, p54).
“Telstra continues to improve its approach for managing, monitoring and reporting risks related to the successful pursuit of its business objectives” (TLS, 2011, p59).
“Recognising this, Telstra continues to improve its approach for managing, monitoring and reporting risks related to the successful pursuit of its business objectives” (TLS, 2012, p59).
This result may be due to an unchanged risk profile for these companies over this period. However, a more plausible explanation is that companies develop ‘boiler plate’ RMD and these are not re-evaluated or up-dated on an annual basis, during a period of no regulatory changes. This is not the intent of the ASX CGPR (ASX CGC, 2010) and provides evidence of a reasonably low level of RMD quality. This result confirms the findings of Abraham and Shrives (2014, p.101) where RMD did not alter from year to year, indicating ‘disclosure inertia’ and the provision of information that was not particularly useful to users.
Width
21 within ‘general risk’ (97 in 2012, 96 in 2010), with a substantially lower number, disclosing within the ‘13 ASX categories’ (67 in 2012, 68 in 2010).
[Insert Table 4 here]
These results are consistent with previous RMD studies, where strategic, financial, operational and market risk categories are the most dominant (Linsley and Shrives, 2005; Lajili and Zéghal, 2005; Dobler et al., 2011; Buckby et al., 2015). Importantly the results demonstrate that many companies prefer to provide an overall ‘general’ risk disclosure instead of conforming to principle 7 of the ASX CGPR, which would provide more useful information for financial report users. Similar results were found by Abraham and Shrives (2014) where a much higher proportion of RMD were of a ‘general’ nature rather than relating to ‘company specific’ factors. Therefore, it is concluded the level of quality RMD within the ‘width’ dimension is reasonably low. Wilcoxon signed rank tests indicate a significantly higher level of operational and strategic RMD in 2012 compared to 2010.
Depth
Table 5 presents the descriptive results for ‘depth’ sub-dimensions of: ‘time orientation’, ‘types of measure’ and ‘economic sign’.
[Insert Table 5 here]
Time orientation
Results reveal that companies provide a lower level of ‘forward-looking’ RMD, 28% for 2012 (27% in 2010), compared to ‘historical’, 36% in 2012 (37% in 2010) and ‘non-time specific’, 35% in 2012 (36% in 2010). Importantly, the number of companies disclosing ‘forward looking’ RMD totalled 14 in both years, while the number of companies disclosing ‘historical’ totalled 96 in 2012 (95 in 2010) and ‘non-time specific’ 77 in 2012 (74 in 2010). This indicates that very few companies are prepared to release ‘forward-looking’ risk information, which would provide future risk predictions useful for decision making. The results of wilcoxon signed rank tests, presented in table 6, indicate there is a significantly lower number of ‘forward-looking’, compared to ‘non-time specific’ and ‘historical’ RMD for both years.
22 These results are consistent with prior findings in other countries, (Beretta and Bozzolan, 2004; Beattie et al., 2004a; Konishi and Ali, 2007; Dobler et al., 2011; Oliveira et al., 2011), where forward-looking information was extremely scant, but contrary to Linsley and Shrives (2006) who unexpectedly found a higher level of forward-looking RMD. As forward-looking RM information is more useful to investors (Dietrich et al., 2001; Beretta and Bozzolan, 2004; Linsley and Shrives, 2005), RMD quality could be considerably improved with the adoption of greater levels of ‘forward-looking’ RMD and particularly an increase in the number of companies disclosing ‘forward-looking’ information.
Types of measure
Results for 2012 reveal that 21% of RMD contained ‘financial’ information (22% in 2010) and 79% ‘non-financial’ information (78% in 2010). Additionally, 99% of RMD contained ‘non-monetary’, while 1% contained ‘monetary’ information for both years. Wilcoxon signed rank tests indicate companies provide significantly less ‘financial’ than ‘non-financial’ RMD, and significantly less ‘monetary’ than ‘non-monetary’ RMD. These results are consistent with Lajili and Zéghal (2005) and Abraham and Shrives (2014) where little evidence was found of the quantification of risk impacts.
Importantly, the number of companies who disclose ‘non-financial’ RMD is more than four times higher than the number of companies who disclose ‘financial’ RMD. Similarly, the results suggest that even fewer companies disclose ‘monetary’ RMD, with 5 companies in 2012 and 7 in 2010.
Economic sign
23 (98 in 2012, 97 in 2010). The overall conclusion from the results of the depth dimension is that there is a low level of RMD quality.
The overall results for RQ1, suggest the quality of RMD in Australia is fairly low. Approximately one third of disclosures do not provide useful information to stakeholders as they contained ‘information not relevant to RM’. Of the two thirds that contained ‘information relevant to RM’, 39 companies did not change the wording of their RMD (or changed very little) for three consecutive financial years, 2010, 2011 and 2012. This finding strongly suggests that those companies are simply using ‘boiler plate’ RMD, during a time frame when there have been no regulatory changes to impose improved disclosures. Within the ‘13 ASX risk categories’, ‘financial’ and ‘strategic’ risk dominates with disclosure levels around 12% - 14% for both years. However, the ‘general’ risk category is the most dominant category at approximately 20% for both years. This result may be explained by proprietary cost theory as some companies may prefer to disclose vague RM information rather than divulge company specific risk information, which may provide their competitors with sensitive information and reduce their competitiveness. Companies were also more reluctant to divulge ‘forward-looking’ and ‘financial’ RMD, while ‘monetary’ and ‘positive’ RMD were almost non-existent. The unwillingness of companies to provide, what arguably is a higher quality of RMD, may be explained by the threat of subsequent stakeholder litigation due to inaccurate predictions, overriding the appeal of improving the quality of RMD. However, overall the results suggest that the level of RMD quality is fairly low for this sample of companies with many not complying with the intent of the ASX CGPR (ASX CGC, 2010) under the ‘if not, why not’ regime.
Results and discussion – RQ2
What are the determinants driving RMD quality? Descriptive statistics
Table 7 provides the descriptive statistics of the variables in the OLS regressions. These indicate that sample companies have a low level of, systematic risk (BETA) and leverage (LEV), with respective means of 1.13 and 0.45. Among the 100 ‘matched’ sample companies, 26 are cross listed on other stock exchanges, such as the New York Stock Exchange (NYSE) and the London Stock Exchange (LSE).
24 OLS Regression results
Table 8 provides the regression results for the pooled sample for 2010 and 2012. The following discussion highlights the significant results of the regressions used to test the hypothesised associations.
[Insert Table 8 here]
Leverage
The results reveal that H1 is not supported. Leverage is not significantly associated with total RMD, which is consistent with prior studies (Linsley and Shrives, 2006; Oliveira et al., 2006; Abraham and Cox, 2007). However, leverage is negatively associated with ‘forward-looking’ and ‘positive’ RMD. This provides new evidence on the relationship between leverage and RMD quality sub-dimensions. Firms with higher leverage are likely to provide less ‘forward- looking’ and ‘positive’ RMD than other firms. This can be explained by the argument that more highly leveraged companies are more reluctant to expose their vulnerability by communicating future risk predictions and any positive risk information to the market, as their risk of bankruptcy is higher than lower leveraged companies (Dobler et al., 2011; Miikinen, 2012). In addition, managers’ reluctance to divulge this proprietary information may be motivated by a desire to withhold company specific risk information from competitors (Cotter et al., 2011) and in particular mitigate any adverse consequences from subsequent litigation proceedings stemming from inaccurate future or positive predictions which do not eventuate.
Firm risk
25 Firm size
The results provide total support for H3. Firm size is positively associated with total RMD which is consistent with prior literature (Amran et al., 2009; Beretta and Bozzolan, 2004; 2008; Elshandidy et al., 2013; Linsley and Shrives, 2005, 2006; Miihkinen, 2012; Oliveira et al., 2011; Buckby et al., 2015). Firm size is also positively associated with all seven sub-dimensions of RMD quality; ‘information relevant to RM’, ‘13 ASX risk categories’, ‘forward-looking’, ‘financial’ ‘monetary’, ‘positive’ and ‘negative’ RMD. The majority of these results provide new evidence on the relationship between firm size and RMD quality sub-dimensions. This strongly suggests that larger firms are not only providing a higher number of RMD, but more importantly are considering the substance and usefulness of their disclosures to users in the market. This evidence also supplements Miihkinen (2012) who found that size has a significant positive association with qualitative and quantitative RMD and Linsley and Shrives (2006) who found that firm size was positively associated with financial RMD.
The significance of size as a determinant of quality RMD supports the arguments proposed by agency and stakeholder theory. Larger companies are more willing to disclose a higher quality of RMD to meet the information needs of lenders (Jensen and Meckling, 1976), which in turn decreases information asymmetry and reduces agency costs. Larger firms also have a greater number and more diverse group of stakeholders and therefore will endeavour to satisfy a vast range of information needs.
Cross listing
26 These results may be explained by the fact that reporting requirements differ in various jurisdictions and a higher quality of RMD comes at zero marginal cost when companies are cross listed (Abraham and Cox, 2007). Higher quality RMD can also signal to the market that these companies manage their risks effectively, which enhances their ability to raise funds in foreign markets (Taylor et al., 2010; Miihkinen, 2012). Cross listed companies are also reporting to a more diverse group of stakeholders and face more complicated regional risks. Additionally, a higher quality of RMD will also reduce the threat of litigation for non-compliance with various regulatory requirements. Agency costs would be higher for firms with a more dispersed share ownership (Fama and Jensen, 1983) and by providing a higher quality of RMD information asymmetry problems can be reduced.
Control variables
Shareholder concentration is significantly negatively associated with the ‘13 ASX risk categories’, ‘forward-looking’, ‘financial’ and ‘negative’ RMD. This provides new evidence and indicates companies with a more concentrated ownership structure provide a lower quality of RMD. These results extend the findings of Abraham and Cox (2007) who found long term institutional ownership was negatively related to the total quantity of RMD and short term institutional ownership was positively related to the total quantity of RMD. Proprietary cost theory and agency theory could explain this result. Institutional investors with large stockholdings may consider it too costly for companies to divulge more sensitive, firm-specific (quality) information to competitor investors and they have the power to command that information privately (Abraham and Cox, 2007). Larger shareholders are also more dominant in monitoring and directing the firm (Birt et al., 2006), therefore agency costs are lower and consequently there may be less pressure to provide a higher quality of RMD.
27 firms are not willing to provide a higher quality of RMD than non-financial firms, when disclosing under the ‘if not, why not’ regime of the ASX CGPR (ASX CGC, 2010).
Profitability and growth opportunity were mainly found not to be significantly associated with any of the RMD framework sub-dimensions. The one exception is a marginally positive association between growth opportunity and ‘monetary’ RMD. These results support the findings of Taylor et al. (2010) who found an insignificant association between profitability and total quantity of RMD. In contrast, Miihkinen (2012) found profitability is significantly associated with total quantity of RMD, coverage, quantitative and outlook profile, whereas growth opportunity is significantly associated to total quantity of RMD and coverage. Finally, the results show that in 2012 companies disclose a higher level of ‘13 ASX risk categories’ and ‘financial’ RMD, compared to 2010.
Robustness tests
In order to assess the validity of the OLS regressions a check for multicollinearity and autocorrelation was conducted. In order to test the non-existence of autocorrelation the Durbin-Watson statistic was utilised. The results are considered acceptable as they are all approximately equal to two (Field, 2000). The correlation coefficients between the regressions variables were viewed. The results suggest that multicollinearity does not pose a severe problem to the validity of the regressions as none of the correlation coefficients exceed the cut-off point 0.80 (Gujarati, 2003). Table 8 presents the variance inflation factor (VIF) results checking for multicollinearity. All the VIF values are between one and three, suggesting multicollinearity should not be an issue for the regression models. Further, this study adopted ridge regressions and condition indices to check for multicollinearity. The results suggest that ridge regressions produce the same results as OLS regressions and the condition indices are all less than 10, indicating that there is no multicollinearity issue in the regressions (Belsley, 1991). Therefore the OLS regressions utilised in this study are valid.
28 high level of shareholder concentration, disclose a significantly lower level of ‘forward-looking’ RMD in 2012 and a significantly lower level of ‘financial’ RMD in 2010. Additionally in 2012, financial firms disclose highwe levels of ‘information relevant to RM’, and consistent with the pooled sample results, financial firms disclose a lower level of RMD within the ‘13 risk ASX categories’.
Conclusion and limitations
Conclusion
Beretta and Bozzolan (2008) developed and tested a multidimensional framework which advocates that RMD quantity is not a valid proxy for RMD quality in its entirety however; the vast majority of RMD studies in various jurisdictions have predominantly used this proxy. Motivated by this and the fact that there has been a scarcity of studies conducted in Australia under the ‘if not, why not’ RMD regime this study adopted a multi-dimensional framework to examine the quality - ‘quantity’ and ‘richness’ (width and depth) of RMD for the top 100 ASX listed companies matched for the 2010 and 2012 years (RQ1). By applying semantic content analysis to all of the dimensions and sub-dimensions of the framework a finer-grained and more detailed analysis of RMD quality is obtained.
The results reveal a low level of RMD quality from the ‘quantity’ and ‘richness’ perspective, indicating low compliance with the ‘if not, why not’ regime for the top 100 ASX listed companies. From the ‘quantity’ perspective, a large proportion of RMD (37%) did not provide ‘relevant RM information’ in both years. In addition, 39 companies produced ‘boiler plate’ RMD for 2010, 2011and 2012. Companies also have a propensity to provide ‘general’ risk disclosures which are vague, in preference to providing more company specific risk disclosures within the ‘13 ASX CGPR risk categories’ of Principle 7. From the richness perspective the results indicate a low level of ‘forward-looking’, ‘financial’, ‘quantitative’, ‘positive’ and ‘negative’ RMD for both years. This relates to the number of disclosures and more importantly to the number of companies who are not disclosing within the ‘richness’ sub-dimensions. In summary the quality of RMD could be assessed as being fairly low, which indicates that the conformity level with the intent of the ASX CGPR is deficient and consequently the quality of RMD could be greatly improved.
29 produced some important empirical evidence which extends prior research and provides new evidence on these associations. (1) Leverage is significantly negatively associated with ‘forward-looking’ and ‘positive’ RMD. (2) Firm risk is significantly positively associated with ‘total RM disclosures’ and ‘information relevant to RM’. (3) Company size is positively associated with ‘total RM disclosure’, ‘information relevant to RM’, ‘13 ASX risk categories’, ‘forward-looking’, ‘financial’, ‘monetary’, ‘positive’ and ‘negative’ RMD. (4) Cross listing is also positively associated with ‘total RM disclosures’, ‘information relevant to RM’, ‘13 ASX risk categories’, ‘forward-looking’, ‘financial’, ‘monetary’, ‘positive’ and ‘negative’ RMD.
In addition, shareholder concentration is significantly negatively associated with the ‘13 ASX risk categories’, ‘forward-looking’, ‘financial’, and ‘negative’ RMD. Financial firms provide a higher level of ‘total RMD’ and a lower level of ‘13 ASX risk categories’, compared to non-financial firms.
Several implications are derived from these results for practitioners, regulators and researchers. Evidence is provided that RMD quality is fairly poor for the top 100 ASX listed companies in Australia for the years examined. This supports the view of the ASX CGC (2010) that the principle-based, self-regulatory environment for narrative RMD is not working effectively. A considerable number of companies are not complying with the ‘intent’ of the ‘if not, why not’ approach. This adds weight to the argument for the IASB (and/or other regulatory authorities) to introduce mandated narrative RMD regulations. Prior research in other countries has shown that under mandatory regulatory regimes, RMD were found not to be ‘boilerplate’ (Kravel and Muslu, 2013; Campbell et al., 2014) and of a higher quality (Miikinen, 2012), thus providing meaningful firm-specific information useful to investors. In addition Campbell (2014) suggests that mandated RMD reduce information asymmetry, with investors incorporating the information into stock prices. From a global perspective it would benefit users greatly to know that RMD were compiled under comparable regulations in different jurisdictions. These results and recommendations were submitted to ASX CGC as part of the call for comments on the proposed third edition of the ASX CGPR (ASX CGC, 2013).
30 contribute significantly to the global literature on RMD. The ‘quality’ of RMD have been examined using a ‘finer-grained’ approach to investigate at a deeper level, compared to counting total sentences, words or calculating an index. This provides a ‘richer’ portrayal of RMD quality and provides new empirical evidence as to why some companies are more likely to disclose higher quality RMD than others.
Limitations
The importance of evaluating RMD quality cannot be underestimated even though it is evident that it is difficult to assess because the concept is both abstract and subjective (Beattie
et al., 2004a, 2004b; Botosan, 2004). Although two coders independently coded the RMD
the subjectivity in conducting semantic content analysis cannot be completely eliminated. The detailed coding into the specific dimensions and sub-dimensions of the RM framework may be subject to debate. However, this does not mean that semantic content analysis should not be attempted (Shrives and Brennan, 2015).The results do make an important contribution by expanding on the existing literature and providing new empirical evidence. Risk information is also available from sources other than the narratives of annual reports, such as tables and graphs, which were not examined in his study. Companies may also disclose RM information through web sites and social media. These limitations provide opportunities for future studies to include risk information from these alternative sources.
31 Notes
1. Other RMD are required under IFRS 4 ‘Insurance contracts’ and IFRS 9 ‘Financial Instruments’.
2. The ‘13 ASX CGPR risk categories’ are: operational, environmental, sustainability, compliance, strategic, ethical conduct, reputational, technological, product service quality, human capital, financial reporting, market related and legal risk.
3. A few companies indicated there was a continuation of these disclosures in other sections of the annual report. These were also included in the analysis.
4. The coding decision rules are available from the authors on request.
32 References
Abraham, S. and Cox, P. (2007), “Analysing the determinants of narrative risk information in UK FTSE 100 annual report”, The British Accounting Review, Vol.39 No.3, pp. 227-248.
Abraham, S. and Shrives, P. J. (2014), “Improving the relevance of risk factor disclosure in corporate annual reports”, The British Accounting Review, Vol. 46 No.1, pp. 91-107.
Aerts, W., Cormier, D. and Magnan, M. (2008), “Corporate environmental disclosure, financial markets and the media: an international perspective”, Ecological Economics, Vol. 64 No. 3, pp. 643–660.
Ahn, T.S. and Lee, J. (2004), “Determinants of voluntary disclosures in management discussion and analysis (MD&A): Korean evidence”, paper presented at the 16th Asian Pacific Conference on International Accounting Issues, Seoul, November 7-10.
Al-Najjar, B and Abed, S. (2014), “The association between disclosure of forward-looking information and corporate governance mechanisms, evidence from the UK before the financial crisis period”, Managerial Auditing Journal, Vol. 29 No.7, pp. 578-595. Amran, A., Bin, A. M. R. and Hassan, B.C.H.M. (2009), “Risk reporting: an exploratory
study on risk management disclosure in Malaysian annual reports”, Managerial
Auditing Journal, Vol. 24 No. 1, pp. 39 – 57.
ASB (2009), “Rising to the challenge, a review of narrative reporting by UK listed
companies”, Accounting Standards Board, London.
ASX CGC (2007), “Corporate Goverance Principles and Recommendations” (2nd edition). Australian Security Exchange Corporate Governance Council, Sydney, Australia. ASX CGC (2010), “Corporate Governance Principles and Recommendations with 2010
Amendments” (2nd edition), Australian Security Exchange Corporate Governance
Council, Sydney, Australia.
ASX CGC (2013), “Corporate Governance Principles and Recommendations” (3rd edition, consultation draft), Australian Security Exchange Corporate Governance Council, Sydney.
ASX CGC (2014), “Corporate Governance Principles and Recommendations” (3rd edition). Australian Security Exchange Corporate Governance Council, Sydney.
ASX Limited (2012), “Australian Securities Exchange Life Science, Investing and Funding
Opportunities”, Sydney, Australia.
Barron, O. E., Kile, C. O. and O’Keefe, T. B. (1999), “MD&A quality as a measure by the SEC and analysts’ earnings forecasts”, Contemporary Accounting Research, Vol.1 No.1, pp. 75-109.
Beattie, V., McInnes, W. and Fearnley, S. (2004a), “Through the eyes of management:
narrative reporting across three sectors”. Final Report. London: ICAEW Centre for
Business Performance.
Beattie, V., McInnes, W. and Fearnley, S. (2004b), “A methodology for analysing and evaluating narratives in annual reports: a comprehensive descriptive profile and metrics for disclosure quality attributes”, Accounting Forum, Vol. 28 No.3, pp. 205-236.
Belsley, D. A. (1991), “Conditioning diagnostics”. John Wiley & Sons, Inc.
Beretta, S. and Bozzolan, S. (2004), “A framework for the analysis of firm risk communication”, The International Journal of Accounting, Vol. 39 No.3, pp. 265-288. Beretta, S. and Bozzolan, S. (2008), “Quality versus quantity: the case of forward-looking
disclosure”, Journal of Accounting, Auditing and Finance, Vol. 15 No. 3, pp. 333-375. Birt, J.L., Bilson, C.M., Smith, T. and Whaley, R.E. (2006), “Ownership, competition, and
33 Black, S. and Kirkwood, J. (2010), “Ownership of Australian Equities and Corporate Bonds”,
RBA Bulletin, pp. 25-33.
Botosan, C. A. (2004), “Discussion of a framework for the analysis of firm risk communication”, The International Journal of Accounting, Vol. 39 No. 3, pp. 289-295. Bowman, R. G. (1979), “The theoretical relationship between systematic risk and financial
(accounting) variables”, The Journal of Finance, Vol. 34 No.3, pp. 617–630.
Buckby, S., Gallery, G. and Ma, J. (2015), “An analysis of risk management disclosures: Australian evidence”, Managerial Auditing Journal, Vol. 30 No. 8/9, pp. 812-869. Cabedo, J. D. and Tirado, J.M. (2004), “The disclosure of risk in financial statements”,
Accounting Forum, Vol. 28 No. 2, pp. 181-200.
Campbell, J. L., Chen, H., Dhaliwal, D. S., Lu, H. M. and Steele, L. B. (2014). “The information content of mandatory risk factor disclosures in corporate filings”, Review of Accounting Studies, Vol. 19 No. 1, pp. 396-455.
Carlon, S., Loftus, J. A. and Miller, M.C. (2003), “The challenge of risk reporting: regulatory and corporate responses”, Australian Accounting Review, Vol. 13 No.3, pp. 36-51. Cerbioni, F. and Parbonetti, A. (2007), “Exploring the effects of corporate governance on
intellectual capital disclosure: an analysis of European biotechnology companies”,
European Accounting Review, Vol. 16 No. 4, pp. 791-826.
Cheung, E., Evans, E. and Wright, S. (2010), “An historical review of quality in financial reporting in Australia”, Pacific Accounting Review, Vol. 22 No. 2, pp. 147-169.
CICA (2001), “Management’s discussion and analysis; guidance on preparation and
disclosure”, Review Draft December, Canadian Institute of Chartered Accountants.
Clarkson, P.M., Kao, J.L. and Richardson, G.D. (1999), “Evidence that management discussion and analysis is a part of a firm’s overall disclosure package”, Contemporary
Accounting Research, Vol. 16 No. l, pp. 111-134.
Cotter, J., Lokman, N. and Najah, M.M. (2011), “Voluntary disclosure research: which theory is relevant?” Journal of Theoretical Accounting Research, Vol. 6 No. 2, pp. 77-95.
Dietrich, J.R., Kachelmeier, S.J., Kleinmuntz, D.N. and Linsmeier, T.J. (2001), “Market efficiency, bounded rationality, and supplemental business reporting disclosures”,
Journal of Accounting Research, Vol. 39 No.2, pp. 213–268.
Dobler, M. (2008), “Incentives for risk reporting - a discretionary disclosure and cheap talk approach”, The International Journal of Accounting, Vol. 42 No. 3, pp. 184–206.
Dobler, M., Lajili, K. and Zéghal, D. (2011), “Attributes of corporate risk disclosure: an international investigation in the manufacturing sector”, Journal of International
Accounting Research, Vol. 10 No. 2, pp. 1-22.
Domínguez, L. R. and Gámez, L.C.N., (2014), “Corporate reporting on risks: Evidence from Spanish companies, Spanish Accounting Review, Vol. 17, No. 2 , pp 116-129.
Elshandidy, T., Fraser, I. and Hussainey, K., (2013), “Aggregated, voluntary, and mandatory risk disclosure incentives: Evidence from UK FTSE all-share companies”,
International Review of Financial Analysis, Vol. 30, pp 320-333.
Elshandidy, T. and Neri, L. (2015), “Corporate governance, risk disclosure practices, and market liquidity: comparative evidence from the UK and Italy”, Corporate
Governance: An International Review, Vol. 23 No. 4, pp. 331-356.
Elzahar, H. and Hussainey, K. (2012), “Determinants of narrative risk disclosures in UK interim reports”, The Journal of Risk Finance, Vol. 13 No. 2, pp. 133-147.
Eng, L. and Mak, Y. (2003), “Corporate governance and voluntary disclosures”, Journal of
Accounting and Public Policy, Vol. 22 No. 4, pp. 325-345.
Fama, E. and Jensen, M. (1983), “Separation of ownership and control”, Journal of Law and