Design of a Web-Based Educational Interface for Wireless
sensor Networks
Mustafa KUŞ, Murat ÇAKIROĞLU
Department of Computer Science, Sakarya University, Sakarya-TURKEY Email: [email protected]
Email: [email protected]
ABSTRACT
Wireless Sensor Networks (WSNs) become a very popular topic in both academic and industrial areas such as remote monitoring, telemedicine, military surveillance, and smart office applications. These applications can involve many design phases along with expertise knowledge. The researchers or students studying on WSNs must complete these phases to develop a WSN application. In this study, we focus on facilitating one of the application phases of WSNs and we have designed a web-based visualization interface for educational purpose. By using the designed interface, the users are able to remotely monitor the deployed WSN, to observe the sensed data coming from the sensor nodes in real-time manner, to create the various charts from sensed data, to check the performance of the sensor nodes, and to analyze the topological changes of the network without writing any code via a PDA or a computer connected to internet. The designed web interface simplifies such a tedious and difficult phase; as a result, the users can save time, and can be focus onother difficult WSNs’ phases.
INTRODUCTION
Wireless sensor networks (WSNs) are a network which consists of a large number of small sizes, low cost and short-range wireless sensor nodes. In WSNs, the nodes can be randomly dispersed into the target environment and can be self organized by the help of developed communication protocols. The sensor nodes can sense the physical phenomena such as light, temperature, humidity and pressure in the environment and transmit the sensed data to sink or base station via multi-hop routes. WSNs can be used in many diverse application areas and have become more and more popular due to its low-cost, easily deployable into harsh environment and long term maintenance-free properties [1]. Today, wireless sensor networks are used in wide range applications such as environmental monitoring systems, military applications and telemedicine.
Wireless sensor network applications consist of complex phases. For example, the design of protocols/algorithms, which ensure the nodes sensing the phenomenon, processing the data and transmit it to the base station, is a complex phase. In the literature, there are various tools to make easy this phase for WSNs [2-4]. The other phase is to ensure deployment of the nodes in target field according to randomly or predetermined scenarios and to make possible self organization. In the literature, there are various studies focused on these issues [5, 6]. Another phase is to store the data coming from the target environment to any computer, to process it, to filter and to visualize according to the user request. This final phase is a great importance in WSN education because it facilitates the collection, understanding and analysing of results coming from deployed WSN nodes. In this study, we have focused on this need of WSNs and we have realized a web-based visualization interface design for WSN education.
Various data processing and visualization tools have been developed for WSNs in the literature. For examples, Mote-View software, which was developed by Crossbow, can set node configuration and allows monitoring, plotting and storing of real-time sensed data [7]. But this software is able to support plotting and visualization service in local manner. MoteLab [8], is a web-based sensor network testbed and it can be used as a remote laboratory for WSN application. But it is not completely visualization tool. Spyglass is java-based and modular WSN visualization software [9]. jWebDust is also java-based and general-purpose visualization tool [10]. Cao et al. were designed the general-purpose web interface for WSNs [11]. This interface focuses on data processing capability and congestion avoidance. There are other examples of data processing and visualization study for WSN in the literature and these examples can be increased. However, these studies were not designed for educational purpose, therefore they are not suitable for engineering education in terms of ease of use, flexibility, visuality.
In this study, we have developed PHP [12] based educational web interface for remote monitoring and controlling of WSNs. The most important difference of this interface than others focuses on flexibility, visuality, and ease of use. Therefore PHP and the PostgreSQL [13] database are used in this web-based interface for receiving, analyzing, processing, visualizing, and showing the data in a web browser. The users are able to monitor any WSN application which is deployed in a remote region via any device connected to internet, to analyse the sensed data of nodes, to plot the graphs of sensed data, to examine the topological changes of WSN. Namely, the users are able to monitor the many features of network by means of proposed web interface.
The rest of this paper is organized as follows. System architecture of designed web interface is explained in section 2. Design features and usage of proposed educational interface are described in section 3 and the paper is concluded by section 4.
SYSTEM ARCHITECTURE OF THE PROPOSED WEB-BASED EDUCATIONAL INTERFACE
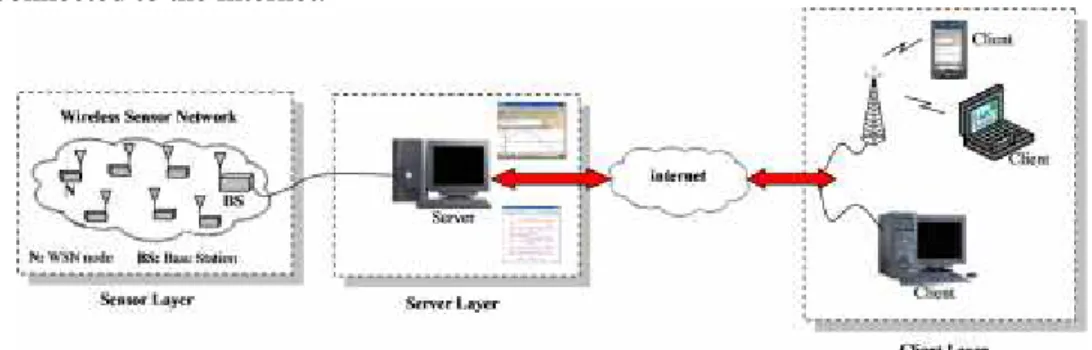
The system architecture, which consists of WSN, server, and users, are shown in Figure 1. WNS is consisting of more than one wireless sensor nodes, which sense the phenomenon, and a base station, which ensure communication of the nodes with the server. The nodes regularly collect the information such as temperature, humidity, light and forward them to the server through base station. Server is responsible to evaluate, process, and visualize the data coming from the base station. For this purpose PostgreSQL [13] database, Apache server and PHP language are used. First, server record the data coming from base station to the PostgreSQL database, then, it process the data in the database depending on user requests, and last, it display the processed data with the help of Apache Web server and PHP. Users are able to examine the processed data by means of any device connected to the internet.
Figure 1 System architecture
DESIGN FEATURES AND USAGE OF WEB-BASED EDUCATIONAL INTERFACE FOR WSNS
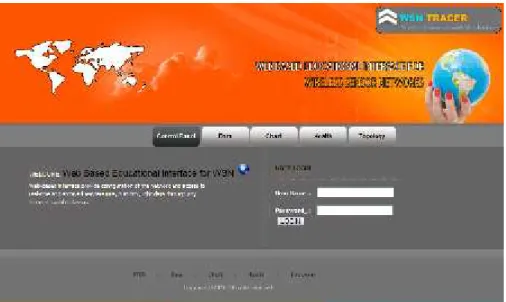
In this section the properties and usage of proposed general-purpose and web based educational interface are described. In Figure 2, introduction page is shown. This page allows to user securely accessing the web based interface. There are two account types called user and administrator to access web based educational interface. Each of accounts is able to monitor sensed data, to plot the graphs, to examine the nodes success and to check the topological changes. The biggest difference between the two accounts is to administrator account have all permission of web-based interface. User account is a limited account which has some permission given from administrator account. The administrator account may be
considered as a lecturers’ account who manages a WSN project and the user
accounts may be considered as students’ accounts who are in this WSN project. After a user or administrator’s password is entered in introduction page, the
server verifies it and if the password has approved by the server, the account has logged. The main purpose of the proposed interface is to be user friendly. Therefore the interface is divided into five main sections. All of the network parameters can be
monitored by help of these sections.
Figure 2 Introduction page
Control Panel Section
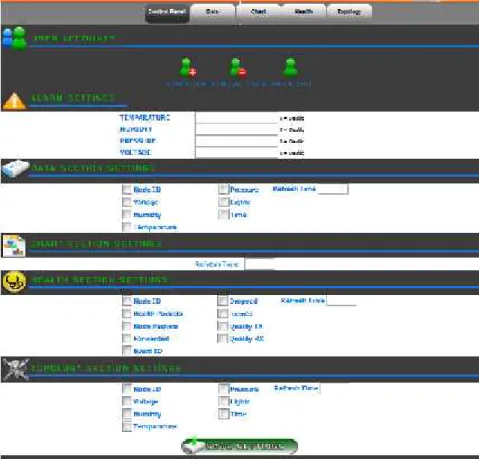
In control panel section, the general settings of web-based educational interface can be made and this section varies related to the used account type. In Figure 3, it can be seen the control panel section for administrator accounts. Administrator is able to create new users, to delete existing users and to list all users in User Account division. In Alarm Settings division, administrator can define the critical (alarm) values for sensed data such as temperature, humidity and voltage level. The lower or higher values than expected can be easily seen in him account by means of different color. In Data, Chart, Health and Topology Section Setting
division, administrator is able to enable or to disable the desired features’ visibility
for him account. The user accounts have not User Account division; therefore they have no permission about account and membership process. But, they are able to change other settings as administrator for their interface appearance.
Figure 3 Control Panel Data section
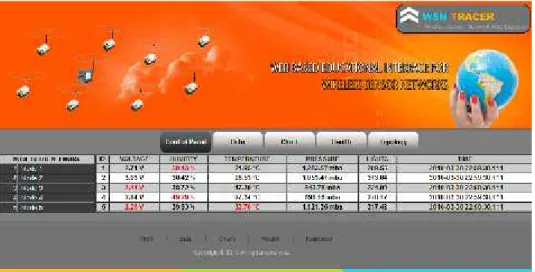
In data section, the momentary value of the temperature, humidity, pressure, light and voltage level information coming from sensor nodes are shown in Figure 4. Determined alarm values in control panel section can be seen as red color in this section. Moreover, this section’s refresh frequency can be configured in user or administrator’s control panel section. Therefore any user or administrator is able to
Figure 4 Data Section Chart section
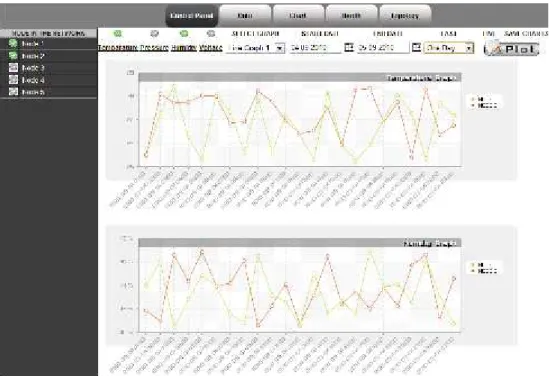
In chart section, the temperature, humidity, pressure and voltage values coming from sensor nodes can be converted to the various graphical forms. Moreover, these graphs can be saved by the user/administrator. Designed web-based interface can plot the graphs of specified physical quantities for selected nodes in the network between desired dates. In Figure 5, it can be seen the chart of two nodes measured the temperature and humidity between September 04 and September 05.
Figure 5 Graphs of specified physical data for selected nodes between desired dates
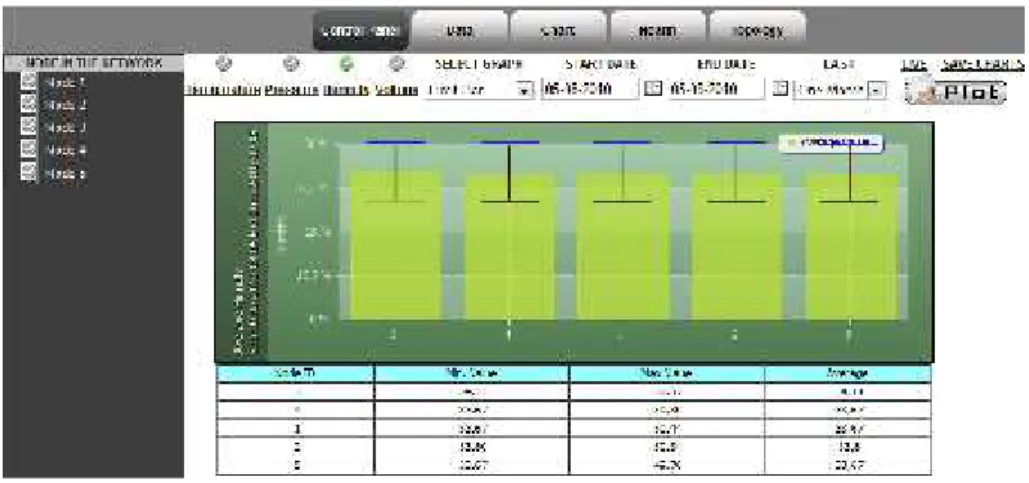
Another graphical feature of the proposed interface is to be able to plot the minimum, maximum and average values of the specified physical data for all nodes in the network between chosen dates. This chart type is very useful because it can statistically show the chosen physical phenomenon for all nodes in the network. In Figure 6, the minimum, maximum and average values of the measured humidity can be seen in last month.
Another important feature of the graphical web interface is to be able to plot the changes of two physical data according to each other. It can be plotted the charts of Temperature-Humidly, Temperature-Pressure and Pressure-Humidity between desired dates by mean of this chart type. In Figure 7, it can be seen the chart of temperature-humidity for two nodes in last day.
Figure 6 Min., max. and average values of the measured humidity in last month.
Figure 7 Chart of temperature-humidity for two nodes in last day. The refresh frequency of CHART section can be adjusted to desired value by means of the control panel section. So, any user or administrator is able to change the refresh frequency according to internet speed. Moreover, the web interface plots the charts in real-time manner when LIVE check box is enabled.
Health section
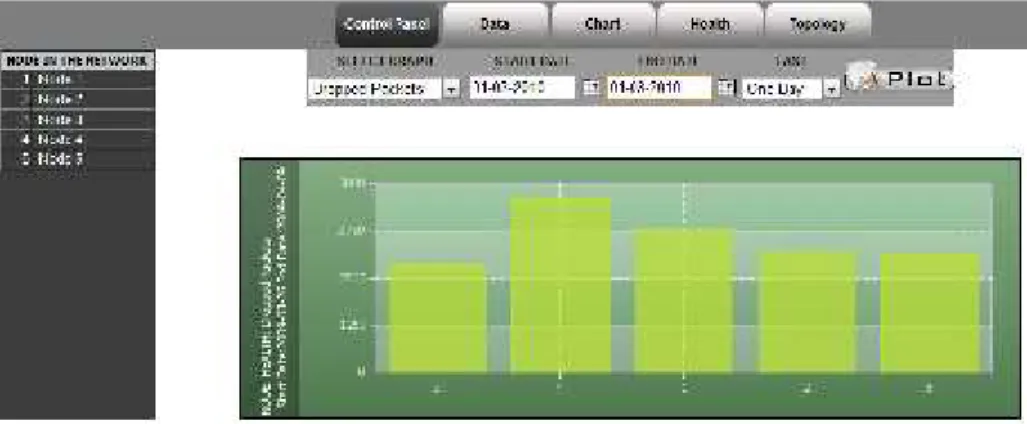
In the health section, It can be plot the chart of parameters which show the success rate of sensor nodes such as number of dropped packets, number of retries, number of received packets, number of forwarded packets, transmission quality, received signal strength indicator (RSSI). In Figure 8, it can be seen the chart of
Figure 8 Chart of number of dropped packets in last day. Topology section
In topology section, it can be observe the logical connection of the sensor nodes deployed in the target environment. Further, sensed data of the nodes can be easily seen as summary. The refresh time of TOPOLOGY section can be adjustable by the control panel section as DATA and CHART section. The example of a network topology can be seen in Figure 9.
Figure 9 Topology section. CONCLUSIONS
After deployment of WSN in target environment, monitoring, collection and archiving of sensed data are required to considerable technical expertise. This tedious process gets harder the WSN education. To simplify this process, and to get save time the users, we have designed the web-based educational interface for wireless sensor networks. Proposed web interface is able to monitor the sensed data of nodes, to create the chart from sensed data, to observe the success rate of sensor nodes and to examine the topology of network. The main advantage of the proposed interface is to be a user friendly and educational tool. By the help of useful features of proposed interface, any users are able to easily monitor their WSN application without going to the deployment area via a computer or PDA connected to internet.
ACKNOWLEDGMENT
This study is supported by Sakarya University under the grant number 2010-05-02-008
REFERENCES
[1] Akyildiz, I. F., Su, W., Sankarasubramaniam, Y., Cayirci, E., (2002) Wireless sensor networks: survey, Computer Network, Vol. 38, pp. 393–422
[2] Jara, C. A. Candelas, F. A. et al. (2009) Real-time collaboration of virtual laboratories through the internet. Comput & Educ, Vol. 52, 2009, pp. 126-140. [3] Mozumdar, M.M.R., Gregoretti, F., Lavagno, L., Vanzago, L., Olivieri, S., (2008) Framework for modeling, simulation and automatic code generation of sensor network applications. SECON '08, pp. 515–522
[4] Hill, J., Szewczyk, R., et al. (2000) System architecture directions for networked sensors. ASPLOS’00, ACM Press, Cambridge.
[5] Huang, Y. K., Hsiu, P. C., et al., (2008) An Integrated Deployment Tool for ZigBee-based Wireless Sensor Networks. EUC '08, pp. 309-315
[6] Chu D., Zhao, F., Liu, J., Goraczko M., (2008) Que: A Sensor Network Rapid Prototyping Tool with Application Experiences from a Data Center Deployment. EWSN 2008, 4913, pp. 337–353.
[7] Turon M., (2005) MOTE-VIEW: A Sensor Network Monitoring and Management Tool.EmNets’05, May.
[8] Werner-Allen G., Swieskowski P.and Welsh M.,(2005) MoteLab: A Wireless Sensor Network Testbed. IEEE SPOTS.
[9] Buschmann C., Psterer D., Fischer, S. Fekete, P. and Kroler, A. (2005) Spyglass: a wireless sensor network visualize. ACM SIGBED Review, 2005;2 (1):1-6.
[10] Chatzigiannakis, I. Mylonas G. and Nikoletseas, S. E. (2005) jWebdust: a javabased generic application environment for wireless sensor networks. DCOSS, 2005, 376–386.
[12] PHP, URL: http://www.php.net