T E C H N I C A L N O T E
Open Access
Leukocyte count affects expression of reference
genes in canine whole blood samples
Christine J Piek
1*, Bas Brinkhof
1, Jan Rothuizen
1, Aldo Dekker
2, Louis C Penning
1Abstract
Background:The dog is frequently used as a model for hematologic human diseases. In this study the suitability of nine potential reference genes for quantitative RT-PCR studies in canine whole blood was investigated. Findings:The expression of these genes was measured in whole blood samples of 263 individual dogs, representing 73 different breeds and a group of 40 mixed breed dogs, categorized into healthy dogs and dogs with internal and hematological diseases, and dogs that underwent a surgical procedure. GeNorm analysis revealed that a combination of 5 to 6 of the most stably expressed genes constituted a stable normalizing factor. Evaluation of the expression revealed different ranking of reference genes in Normfinder and GeNorm. The disease category and the white blood cell count significantly affected reference gene expression.
Conclusions:The discrepancy between the ranking of reference genes in this study by Normfinder and Genorm can be explained by differences between the experimental groups such as“disease category” and“WBC count”. This stresses the importance of assessing the expression stability of potential reference genes for gene experiments in canine whole blood anew for each specific experimental condition.
Findings Context
The dog is frequently used as an experimental model for hematologic human diseases [1]. The use of dogs can be explained by the fact that the dog offers a vari-ety of spontaneous and experimental models of hema-tologic diseases. Recent examples are the use of canine hemophilia A [2] and B models [3,4], and the Canine Leukocyte Adhesion Deficiency model (CLAD) [5,6] in gene therapy experiments [2-8], and pharmacological experiments in leukopenic dogs [7] and in dogs with CLAD [8]. The larger size of dogs compared to small rodent models allows similar surgical procedures in humans as in dogs, and permits in most cases ade-quate acquisition of diagnostic samples. The dog has been a longstanding model for bone marrow and more recently for stem cell transplantations [9,10]. Anticoa-gulant therapy has been tested extensively in canine cardiac surgery models [11,12]. Also the pathogenesis and therapy of acquired disorders of hemostasis such
as disseminated intravascular coagulation [13], throm-bosis [14,15], and hemolytic uremic syndrome [16] have been investigated in canine models.
A disadvantage of the canine model compared to human or small rodent models is the limited availability of antibodies against canine intra- and extracellular pro-teins such as CD markers. At least 350 CD markers are defined in humans [17,18], while in the first and to date only workshop on canine leukocyte antigens only 127 antibodies were investigated [19]. A more recent study tested cross species reactivity with commercially avail-able anti human CD molecules against canine leuko-cytes, erythrocytes and platelets and identified only a limited number of 51 cross reacting mAbs [20]. In con-trast to the limited knowledge of canine CD markers, the canine genome has been sequenced in total [21]. Therefore most molecular tools can be readily applied in dog research. Real-time quantitative reverse transcrip-tase PCR (Q-PCR) offers an accurate and sensitive alter-native to quantification of gene expression [22] and for that reason is well suited to study biological processes and has also many practical clinical applications. Q-PCR has already been shown to be a valuable adjunct in * Correspondence: [email protected]
1
Department of Clinical Sciences of Companion Animals, Utrecht, Utrecht University, PO Box 80154, 3508 TD Utrecht, The Netherlands
Full list of author information is available at the end of the article
immunophenotyping and the quantification of residual disease in leukemia [23-26].
Multiple variables need to be controlled when per-forming a Q-PCR, such as the quality of RNA after iso-lation, the input amount and quality of mRNA and cDNA reaction efficacy, efficiency of the enzymatic reac-tions, and cell to cell variability in translational activity. One of the solutions to control for the internal variation that affect the outcome of the Q-PCR reaction is the use of reference genes as an internal standard [22,27]. Reference genes are selected based on the supposition that their expression is stable in all cells regardless of the tissue or individual [28]. It has been proven, how-ever, that many genes essential for basic cellular mechanisms and hitherto thought to have a stable expression throughout the organism actually did not comply with this assumption [29-35]. Therefore, it is essential that the assumption of stable expression of potential reference genes is verified for each experimen-tal set up [28,36-38].
In this study we investigated the suitability of nine fre-quently used reference genes in Q-PCR for the use as reference genes in a quantitative real-time PCR in canine whole blood and the influence of dog breed, sex, disease category and disease duration on the Cq of these genes was assessed.
Methods
Blood sample collection
Between September 2007 and October 2008 canine blood samples (n = 263) were taken from dogs sub-mitted to the intensive care unit of the small animal hospital of the Veterinary Faculty of the Utrecht Univer-sity (The Netherlands) from healthy control dogs (n = 6; group A) and dogs categorized into three disease groups. Group B (n = 85) had surgery within the pre-ceding 24 hours, group C (n = 107) were dogs with mis-cellaneous internal diseases, and group D (n = 65) had hematologic disease (disseminated intravascular coagula-tion (n = 27), systemic inflammatory disease (n = 24), and immunemediated hemolysis (n = 14).
The 263 dogs represented 73 different breeds and a group of mixed breed dogs (n = 40). Breeds that were represented by at least 5 dogs were the Labrador retrie-ver (n = 30), Golden retrieretrie-ver (n = 18), Jack Russell ter-rier (n = 10), (Bordeaux dog (n = 9), Dachshund n = 9), Boxer (n = 7), German shepherd and German pointer (n = 6), and the Bernese mountain dog, Beagle, English Cocker spaniel, and the Bearded collie were all repre-sented by 5 dogs. There were 42 female dogs, 91 castrated female dogs, 78 males, and 47 castrated male dogs. Of 3 dogs the sex was not noted in the file. The mean age of the dogs was 6.5 years (range 12 weeks to 14 years, SD 3.5 years).
Two milliliters of EDTA-anticoagulated blood were collected from each dog on the day of admittance and during the period the dog was hospitalized consecutive samples were taken at least 24 hours apart.
From 99 of the dogs, a second sample was available (37 of group B, 30 of group C, 32 of group D), and in, respectively, 34 dogs a third (10 of group B, 6 of group C, 18 of group D), and in 13 dogs a fourth sample (4 of group B, 3 of group C, 6 of group D) was available.
All procedures were approved by and performed according to the ethical committee as required under Dutch legislation.
RNA isolation and cDNA synthesis
In view of the large sample number but small samples size, the RT-reaction was performed only once. The MIQE guidelines, however, suggest to perform it twice [39,40]. From each dog duplo samples were prepared by mixing 0.5 ml EDTA-anticoagulated blood with 1.3 ml RNAlater (Ambion, Applied Biosystems, Foster City, California, USA). Samples were stored at -20°C. Total RNA was extracted from the samples using the Ribo-Pure™-Blood kit reagent (Ambion, Applied Biosystems, Foster City, USA) according to the manufacturer’s instructions including a DNAse treatment to destroy contaminating genomic DNA and minimize the effect of pseudogenes. The RNA concentration was determined spectrophotometrically by the NANOdrop 1000 Isogen Life Science, IJsselstein, The Netherlands). Bio-Rad iScript, containing both oligodT and random hexamer primers, was used to synthesize cDNA from 1 μg of total RNA according to the manufacturer’s instructions (iSCRIPT, Bio-Rad, Veenendaal, The Netherlands).
Primer design and testing
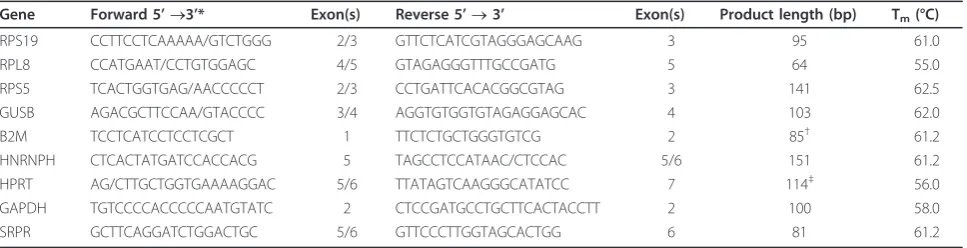
only (http://www.genelink.com/tools/gl-downloads.asp). All primer pairs, except for GAPDH, were intron span-ning. The PCR reaction was optimized for the primers. Optimal Tm values ranged from 55°C for RPL8 to 62.5°C for RPS5 (Table 2). Amplification efficiency cal-culations from all standard curves were between 93.9 and 106.7%. All no template controls were negative.
Quantitative PCR
Q-PCR was done with the DNA-binding SYBR green using the BioRad iCycler MyiQ Real-Time PCR Detec-tion System (BioRad, Hertfordshire, United Kingdom) according to the manufacturer’s instructions. Primers (Eurogentec, Maastricht, The Netherlands) had a final concentration of 400 nM each. One microliter of cDNA was used per Q-PCR reaction. OptimalTm was deter-mined previously [41,42]. Reactions with aTmless than 58°C started with 5 min at 95°C, followed by 40 cycles of 20 s at 95°C, 30 s at Tm, and 30 s at 72°C. This reac-tion was continued by a melting curve, stepwise increas-ing temperature each 15 s by 0.5°C, rangincreas-ing from 60 to 95°C. In case the Tmwas 58°C or higher, the elongation step at 72°C was omitted andTmremained 30 s. Analy-sis of Q-PCR results were performed with iQ™5
software (Biorad, Veenendaal, The Netherlands) based on the mean Cq obtained from the duplo of each Q-PCR reaction.
Analysis gene expression
Firstly, the influence of experimental condition such as disease category and duration, sex, leukocyte count on potential reference gene expression were determined. For each potential reference gene a comparison of the mean Cq values obtained at the first sampling for the disease groups A, B, C, and D, and sex was performed using the ANOVA. To determine if the differences in Cq’s for the nine potential reference genes were due to changes in expression levels over time an ANOVA was used. Using a forward selection process, two explanatory variables,“dog”and“sample number”, were introduced as factors in the ANOVA. The result variable was the observed Cq value. The resulting models were compared using the likelihood ratio test.
[image:3.595.59.538.111.235.2]The mean Cq values for dogs with a leukocyte count within the reference range (4.5 - 14.6 *109/l) were com-pared to mean Cq’s of dogs with a leukocyte count above 30 *109/l, which can be considered a clinically relevant leukocytosis. If a significant difference was Table 1 Abbreviations, GenBank Accession numbers, names, and chromosomal location of canine candidate reference genes evaluated
Gene GenBank Accession No. Name Chromosomal location inCanis familiaris
RPS19 XM_533657 Ribosomal protein S19 Chromosome 1
RPL8 XM_532360 Ribosomal protein L8 Chromosome 13
RPS5 XM_533568 Ribosomal protein S5 Chromosome 1
GUSB NM_001003191 Beta-Glucuronidase Chromosome 6
B2M XM_535458 Beta-2-microglobulin Chromosome 30
HNRNPH XM_538576 Heterogeneous nuclear ribonucleoprotein H Chromosome 11
HPRT AY283372 Hypoxanthine phosphoribosyltransferase 1 Chromosome X
GAPDH NM_001003142 Glyceraldehyde-3-phosphate dehydrogenase Chromosome X
SRPR X03184 Signal recognition particle receptor Chromosome 5
Table 2 Primer sequences, exon locations, amplicon size, and optimal melting temperature of canine candidate reference genes
Gene Forward 5’®3’* Exon(s) Reverse 5’®3’ Exon(s) Product length (bp) Tm(°C)
RPS19 CCTTCCTCAAAAA/GTCTGGG 2/3 GTTCTCATCGTAGGGAGCAAG 3 95 61.0
RPL8 CCATGAAT/CCTGTGGAGC 4/5 GTAGAGGGTTTGCCGATG 5 64 55.0
RPS5 TCACTGGTGAG/AACCCCCT 2/3 CCTGATTCACACGGCGTAG 3 141 62.5
GUSB AGACGCTTCCAA/GTACCCC 3/4 AGGTGTGGTGTAGAGGAGCAC 4 103 62.0
B2M TCCTCATCCTCCTCGCT 1 TTCTCTGCTGGGTGTCG 2 85† 61.2
HNRNPH CTCACTATGATCCACCACG 5 TAGCCTCCATAAC/CTCCAC 5/6 151 61.2
HPRT AG/CTTGCTGGTGAAAAGGAC 5/6 TTATAGTCAAGGGCATATCC 7 114‡ 56.0
GAPDH TGTCCCCACCCCCAATGTATC 2 CTCCGATGCCTGCTTCACTACCTT 2 100 58.0
SRPR GCTTCAGGATCTGGACTGC 5/6 GTTCCCTTGGTAGCACTGG 6 81 61.2
* If a primer is located on two exons, the junctions are shown with a dividing forward slash (/).
†Genomic product size would be approximately 3.6 kb.
[image:3.595.57.541.578.702.2]observed, a pair wise comparison was made using the T-test with Holmes correction for multiple comparisons. Secondly, a linear mixed effects model was used to assess the significance as well as the magnitude of the effect of leukocyte count on Cq per dog, with the mean Cq as response variable, the natural logarithm of the
“leukocyte count” as explanatory variable, and the“dog” as random effect. Similarly, a linear mixed effects model was used to determine if the leukocytes count changed over time per dog. An ANOVA was used to compare the leukocyte counts in the disease groups A, B, C and D. A linear model was used to examine the relationship of the Cq with the variables“disease category” and the natural logarithm of the“leukocyte count”.
All statistical analyses were performed in R (http:// www.r-project.org). P below 0.05 was considered signifi-cant in all analyses.
To determine the ranking of best performing reference genes in whole blood the stability of expression of the candidate reference genes was calculated using the GeN-orm [27] and NGeN-ormfinder [43] algorithm software. The gene expression stability calculations in this study were performed on the first sample that was taken when the dog entered the study.
In Genorm the expression ratio for each pair of candi-date reference genes is calculated for the data array of all samples and log2-transformed.“M”is the arithmetic
mean of the pair wise variation measured as the standard deviation of thus obtained values. A low “M” indicates little variation in expression of the two genes. Then the optimal number of control genes for normali-sation is determined. Firstly, the normalinormali-sation factor is calculated based on the two reference genes with the lowest “M"-values. Secondly, the contribution of an additional candidate reference gene to the variance of the normalisation factor ratios is calculated by the step-wise introduction of the reference genes following the earlier established ranking order of their“M"-values.
Shortly, Normfinder makes use of a mathematical model to describe the expression values measured by RT-PCR, separate analysis of the sample subgroups, and estimation of both the intra- and the intergroup expres-sion variation, and finally calculates a candidate gene
“Stability Value.”
Results
Expression of candidate reference genes
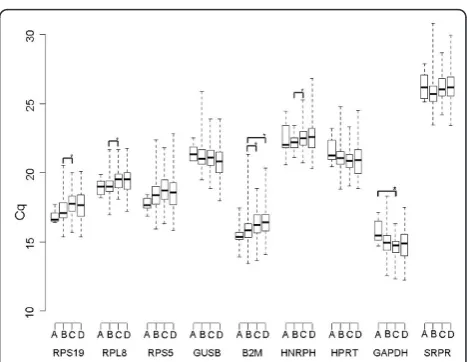
The range and median Cq values of the first sample that was taken in the dogs in the disease groups A, B, C and D (described above) are depicted in Figure 1. There was a significant difference between the mean Cq’s measured in groups B and C for RPL8, RPS19, B2M and HNRNPH, the differences being 0.35, 0.39, 0.44, and 0.35 Cq, respectively. The difference between groups B
and D for B2M was 0.51 Cq, and between A and C for GAPDH it was 1.1 Cq (Figure 1). “Sample number” did not significantly determine the Cq, except for SRPR (p = 0.013), nor did“sex”and “breed”.
Next the leukocyte count was examined. The leuko-cyte counts of disease group A was within the reference range (median 8.6, range 6.6 - 12.5*109/l). The leukocyte counts of disease groups B (median 15.9, range 3.8 -107.8*109/l) and C (median 16.8, range 2.1 - 44.6*109/l) were statistically significant from group D (median 22.6, range 4.8 - 175.9*109/l) (P = 1.9*10-7 and 7.8*10-6 respectively). The linear mixed effects model revealed that “leukocyte count” did not significantly change between sequential samples taken during the course of the disease.
The linear mixed effects model that included only
[image:4.595.305.539.85.266.2]“leukocyte count” as explanatory variable for the Cq was not significant for SRPR, HNRNPH, and GUSB. The other 6 potential reference genes (B2M, RPL8, RPS19, RPS5, GAPDH, and HPRT) had significant changes in Cq, ranging from -0.87 to 1.28 for an a ten fold increase in leukocyte count. A significant difference between the Cq’s of dogs with a leukocyte count within the reference range and dogs with a leukocyte count above 30 *109/l was found for RPS19, RPL8, RPS5, B2M, and HPRT. Additionally, in this analysis, GAPDH, was identified as the fourth of the nine reference genes that was not sig-nificantly influenced by leukocyte count (Table 3).
The linear model that included both“leukocyte count” and the “disease category” as explanatory variables for the Cq was statistically significant for both RPS5 and B2M. “Disease category”was the statistically significant factor determining Cq in the case of SRPR, HNRNPH, GUSB and GAPDH and“leukocyte count”in the case of RPS19, RPL8, and HPRT.
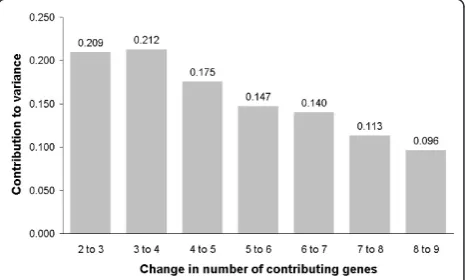
In order to identify the genes that had the least vari-able expression, expression stability was evaluated using GeNorm and Normfinder software analysis. The pair wise variation between the normalisation factors calcu-lated by GeNorm steadily decreased after inclusion of the fourth additional reference gene and falls below the cut-off of 0.15 that is suggested by the GeNorm pro-gramme after adding the fifth gene [27] (Figure 2). The ranking of the potential reference genes by GeNorm and Normfinder is given in Table 4.
Discussion
Studying gene expression by the sensitive, specific, and accurate technique of quantitative RT-PCR has become increasingly important in biomedical research. The goal of this study was to select reference genes that can be used as a normaliser when studying gene transcription in canine blood cells. Nine genes that are either conven-tionally used as reference genes or were shown to have a stable expression in hematopoietic cells or whole blood were chosen as potential candidate reference genes in this study [36,41,42,44,45] (Table 1). Even genes that regulate basic cellular tasks have been shown to be regulated [29-35,46]. To exclude that the expres-sion of the potential reference genes was influenced by the experimental conditions in our study we investigated the effect of several parameters such as disease category, disease duration, and leukocyte count. Additionally, two software algorithms, respectively, Normfinder [43] and
GeNorm [27], were used to calculate gene expression stability and help select the combination of reference genes that provides the most stable normalizer for a specific experimental situation.
[image:5.595.306.539.494.634.2]Whole blood RNA originating from all cells present in the peripheral blood, as opposed to RNA derived from a cell sorting procedure, was used for the reverse tran-scriptase reaction in this study. To correct for the leuko-cyte count reaction was performed on a fixed amount of starting RNA. The influence of a disproportionate increase of a subset of the leukocytes on reference gene expression is not countered by this. This disadvantage has to be weighed against the advantage of being able to investigate simultaneously the expression of multiple Table 3 Relation of Cq and white blood cell count
Gene Cq change for 10 fold increase in WBC count p WBC within reference range WBC > 30*109/l Difference p
Mean Cq SD Mean Cq SD
RPS19 0.92 0 17.35 0.82 17.90 1.31 0.56 0.002
RPL8 0.52 0.006 19.20 0.67 19.52 1.14 0.32 0.026
RPS5 1.06 0 18.30 0.86 19.01 1.61 0.71 0.0009
GUSB - 0.07 0.75 21.09 0.97 21.08 1.47 -0.01 0.93
B2M 1.28 0 15.85 0.86 16.58 1.74 0.73 0.0006
HNRNPH - 0.09 0.68 22.40 0.86 22.20 1.02 -0.20 0.19
HPRT - 0.87 0 21.14 0.93 20.71 1.03 -0.43 0.01
GAPDH - 0.51 0.023 14.87 0.97 14.80 0.96 -0.07 0.38
SRPR 0.10 0.70 18.30 1.09 19.01 1.51 0.03 0.91
•WBC = White Blood Cell Count.
Change in Cq is given for a ten fold increase in WBC count, mean Cq and SD for dogs with WBC count in the reference range and for dogs with a leukocytosis with a WBC > 30*109
/l.
genes originating from distinct cell types. And, addition-ally, against the fact that cell sorting procedures have been shown to affect gene expression. Five to nine fold up regulation of cytokine expressions were seen after density gradient separation of leukocytes [47].
Several conditions that might effect gene expression were examined in this study. Figure 1 reveals significant increases in Cq between the disease groups for RPS19, RPL8, B2M, HNRNPH, and GAPDH, The maximum increase is seen in case of B2M between groups B and D (0.51 Cq). These differences between the disease groups can be contributed mainly to the disease condi-tion as opposed to disease duracondi-tion since the Cq was not significantly different between the sequential sam-ples taken during the disease period in a subset of the dogs. The leukocyte count gradually increases compar-ing the disease groups, revealcompar-ing a significant difference between group B (median leukocyte count 15.9*109/l) versus C (median leukocyte count 16.8*109/l) and D (median leukocyte count 22.6*109/l), respectively. The changes in Cq associated with leukocyte count had a similar direction as the Cq changes in the disease cate-gories (Figure 1). This suggested that“leukocyte count” might a major factor explaining the directional change in Cq. The linear model examining the influence of“ dis-ease category” and “leukocyte count” revealed that this was the case for RPS19 and RPL8. RPS5 and B2M were best explained by the linear model containing both para-meters, however. The reference genes that were not sig-nificantly influenced by the WBC count were GUSB, HNRNPH and SRPR (Table 3).
B2M has shown a highly variable expression in several tissues other than whole blood [41,42,44,48] but had a stable expression in one study where human leukocytes from 13 healthy donors were examined [27]. B2M also had stable expression in a large study where 526 human whole blood samples representing healthy individuals and 6 disease groups [49]. The influence of leukocyte count on B2M expression was not examined in both
these studies. B2M encodes for beta-2-microglobulin which is part of the canine MHC I molecule and abun-dantly expressed on hematopoietic cells. The decrease in B2M expression associated with increases in leukocyte count in this study might reflect both a decrease in induced expression, or a shift in leukocyte subsets dis-playing different MHC class I receptor densities.
The selection of one, or a set of, potential reference genes for a future experiment depends besides practical points such as available sample sizes and costs mainly on stability of expression in the experimental samples. In this study we evaluated the expression stability with Normfinder and GeNorm. Both software algorithms are frequently used and freely available but have a different working rationale. Normfinder selects out of a set of potential reference genes one single, or the pair of, best performing reference genes that show the least variation between and within experimental groups. The focus on the detection of directional changes in reference gene expression due to differences between the experimental groups is the major difference with GeNorm that focuses on pair wise comparisons of reference gene expression in the experimental samples and is therefore less apt to identify coregulated genes [50]. Since WBC count and disease category had a statistically significant effect on potential reference gene expression, it is not surprising that the ranking provided by Normfinder and GeNorm differed. Among the genes ranked highest by Normfinder were the genes that were not significantly influenced by the WBC count (GUSB, HNRNPH and SRPR, Table 3).
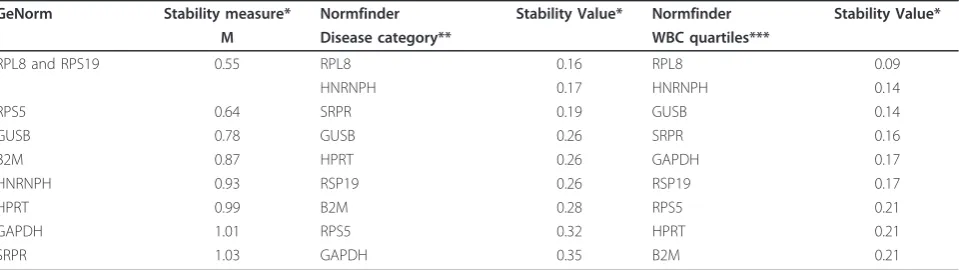
[image:6.595.59.539.100.235.2]Contrastingly, GeNorm ranked RPS8, RPS19, and RPS5 highest. Similarly, RPL8 had the best Stability Value in Normfinder, but both RSP19 and RSP5 were ranked at the low end of the list (Table 4). An explana-tion might be that these three genes are all coding for ribosomal proteins which are likely to be coregulated. Despite the fact that they have less variation in expres-sion as pointed out by GeNorm, the directional Table 4 Ranking of potential reference genes according to their expression stability by GeNorm and Normfinder
GeNorm Stability measure* Normfinder Stability Value* Normfinder Stability Value*
M Disease category** WBC quartiles***
RPL8 and RPS19 0.55 RPL8 0.16 RPL8 0.09
HNRNPH 0.17 HNRNPH 0.14
RPS5 0.64 SRPR 0.19 GUSB 0.14
GUSB 0.78 GUSB 0.26 SRPR 0.16
B2M 0.87 HPRT 0.26 GAPDH 0.17
HNRNPH 0.93 RSP19 0.26 RSP19 0.17
HPRT 0.99 B2M 0.28 RPS5 0.21
GAPDH 1.01 RPS5 0.32 HPRT 0.21
SRPR 1.03 GAPDH 0.35 B2M 0.21
difference in expression of these coregulated reference genes, will potentially decrease the sensitivity of detect-ing changes in expression of the genes of interest in an experiment [51].
The discrepancy between the ranking of reference genes in this study by Normfinder and Genorm can be explained by differences between the experimental groups such as “disease category” and “WBC count”. These results reveal that experimental conditions can result in unforeseen group wise up regulation or down regulation of reference genes that otherwise may have a stable expression when the whole dataset is considered. Minor group specific directional changes in reference gene expression might obscure changes in candidate gene expression between groups. The results of this study emphasize that it is prudent to assess each new data set specifically for changes in reference gene expression due to the experimental conditions even when reference genes are chosen that were previously shown to have a stable expression.
List of abbreviations
B2M: beta-2-Microglobulin; GAPDH: Glyceraldehyde-3-phosphate
dehydrogenase; GUSB: beta-Glucuronidase; HNRNPH: Heterogeneous nuclear ribonucleoprotein H; HPRT: Hypoxanthine phosphoribosyltransferase; RPL8: Ribosomal protein L8; RPS5: Ribosomal protein S5; RPS19: Ribosomal protein S19; SRPR: Signal recognition particle receptor.
Author details
1Department of Clinical Sciences of Companion Animals, Utrecht, Utrecht University, PO Box 80154, 3508 TD Utrecht, The Netherlands.2Central Institute for Animal Disease Control, P.O. Box 2004, 8203 AA Lelystad, The Netherlands.
Authors’contributions
CJP participated in the experimental design, collected blood samples and drafted the manuscript. BB carried out the molecular analysis. JR was involved in the experimental design and sample collection. AD carried out the statistical analysis. LCP participated in the experimental design and coordination and drafted the manuscript.
All authors read and approved the final manuscript.
Competing interests
The authors declare that they have no competing interests.
Received: 18 August 2010 Accepted: 9 February 2011 Published: 9 February 2011
References
1. Starkey MP, Scase TJ, Mellersh CS, Murphy S:Dogs really are man’s best friend–canine genomics has applications in veterinary and human medicine!Brief Funct Genomic Proteomic2005,4:112-128.
2. McCormack WM Jr, Seiler MP, Bertin TK, Ubhayakar K, Palmer DJ, Ng P, Nichols TC, Lee B:Helper-dependent adenoviral gene therapy mediates long-term correction of the clotting defect in the canine hemophilia A model.J Thromb Haemost2006,4:1218-1225.
3. Niemeyer GP, Herzog RW, Mount J, Arruda VR, Tillson DM, Hathcock J, van Ginkel FW, High KA, Lothrop CD Jr:Long term correction of inhibitor prone hemophilia B dogs treated with liver-directed AAV2 mediated factor IX gene therapy.Blood2009,113:797-806.
4. Arruda VR, Stedman HH, Nichols TC, Haskins ME, Nicholson M, Herzog RW, Couto LB, High KA:Regional intravascular delivery of AAV-2-F.IX to
skeletal muscle achieves long-term correction of hemophilia B in a large animal model.Blood2005,105:3458-3464.
5. Bauer TR Jr, Allen JM, Hai M, Tuschong LM, Khan IF, Olson EM, Adler RL, Burkholder TH, Gu YC, Russell DW, Hickstein DD:Successful treatment of canine leukocyte adhesion deficiency by foamy virus vectors.Nat Med
2008,14:93-97.
6. Bauer TR Jr, Gu YC, Creevy KE, Tuschong LM, Embree L, Holland SM, Sokolic RA, Hickstein DD:Leukocyte adhesion deficiency in children and Irish setter dogs.Pediatr Res2004,55:363-367.
7. Choi EW, Koo HC, Shin IS, Chae YJ, Lee JH, Han SM, Lee SJ, Bhang DH, Park YH, Lee CW, Youn HY:Preventive and therapeutic effects of gene therapy using silica nanoparticles-binding of GM-CSF gene on white blood cell production in dogs with leukopenia.Exp Hematol2008,
36:1091-1097.
8. Creevy KE, Bauer TR Jr, Tuschong LM, Embree LJ, Colenda L, Cogan K, Starost MF, Haskins ME, Hickstein DD:Canine leukocyte adhesion deficiency colony for investigation of novel hematopoietic therapies.Vet Immunol Immunopathol2003,94:11-22.
9. Ladiges WC, Storb R, Thomas ED:Canine models of bone marrow transplantation.Lab Anim Sci1990,40:11-15.
10. Lange S, Altmann S, Brandt B, Adam C, Riebau F, Vogel H, Weirich V, Hilgendorf I, Storb R, Freund M, Junghanss C:Investigation of immunological approaches to enhance engraftment in a 1 Gy TBI canine hematopoietic stem cell transplantation model.Exp Hematol2009,
37:143-150.
11. Wakefield TW, Lindblad B, Whitehouse WM Jr, Hantler CB, Stanley JC:
Attenuation of hemodynamic and hematologic effects of heparin-protamine sulfate interaction after aortic reconstruction in a canine model.Surgery1986,100:45-51.
12. Terrell MR, Walenga JM, Koza MJ, Pifarre R:Efficacy of aprotinin with various anticoagulant agents in cardiopulmonary bypass.Ann Thorac Surg1996,62:506-511.
13. Wigton DH, Kociba GJ, Hoover EA:Infectious canine hepatitis: animal model for viral-induced disseminated intravascular coagulation.Blood
1976,47:287-296.
14. Comer MB, Cackett KS, Gladwell S, Wood LM, Dawson KM:Thrombolytic activity of BB-10153, a thrombin-activatable plasminogen.J Thromb Haemost2005,3:146-153.
15. Hong TT, Huang J, Barrett TD, Lucchesi BR:Effects of cyclooxygenase inhibition on canine coronary artery blood flow and thrombosis.Am J Physiol Heart Circ Physiol2008,294:H145-155.
16. Raife T, Friedman KD, Fenwick B:Lepirudin prevents lethal effects of Shiga toxin in a canine model.Thromb Haemost2004,92:387-393. 17. Zola H, Swart B, Banham A, Barry S, Beare A, Bensussan A, Boumsell L, C DB,
Buhring HJ, Clark G,et al:CD molecules 2006–human cell differentiation molecules.J Immunol Methods2007,319:1-5.
18. Zola H, Swart B:The human leucocyte differentiation antigens (HLDA) workshops: the evolving role of antibodies in research, diagnosis and therapy.Cell Res2005,15:691-694.
19. Cobbold S, Metcalfe S:Monoclonal antibodies that define canine homologues of human CD antigens: summary of the First International Canine Leukocyte Antigen Workshop (CLAW).Tissue Antigens1994,
43:137-154.
20. Schuberth HJ, Kucinskiene G, Chu RM, Faldyna M:Reactivity of cross-reacting monoclonal antibodies with canine leukocytes, platelets and erythrocytes.Vet Immunol Immunopathol2007,119:47-55.
21. Lindblad-Toh K, Wade CM, Mikkelsen TS, Karlsson EK, Jaffe DB, Kamal M, Clamp M, Chang JL, Kulbokas EJ, Zody MC,et al:Genome sequence, comparative analysis and haplotype structure of the domestic dog.
Nature2005,438:803-819.
22. Wong ML, Medrano JF:Real-time PCR for mRNA quantitation.
BioTechniques2005,39:75-85.
23. Bustin SA, Mueller R:Real-time reverse transcription PCR (qRT-PCR) and its potential use in clinical diagnosis.Clin Sci (Lond)2005,109:365-379. 24. Pallisgaard N, Clausen N, Schroder H, Hokland P:Rapid and sensitive
minimal residual disease detection in acute leukemia by quantitative real-time RT-PCR exemplified by t(12;21) TEL-AML1 fusion transcript.
Genes Chromosomes Cancer1999,26:355-365.
efficiencies between patient DNA samples in quantitative real-time PCR.
J Mol Diagn2001,3:55-61.
26. Usher SG, Radford AD, Villiers EJ, Blackwood L:RAS, FLT3, and C-KIT mutations in immunophenotyped canine leukemias.Exp Hematol2009,
37:65-77.
27. Vandesompele J, De Preter K, Pattyn F, Poppe B, Van Roy N, De Paepe A, Speleman F:Accurate normalization of real-time quantitative RT-PCR data by geometric averaging of multiple internal control genes.Genome Biol2002,3:RESEARCH 0034.0031-0034.0011.
28. Bustin SA:Quantification of mRNA using real-time reverse transcription PCR (RT-PCR): trends and problems.J Mol Endocrinol2002,29:23-39. 29. Bereta J, Bereta M:Stimulation of glyceraldehyde-3-phosphate
dehydrogenase mRNA levels by endogenous nitric oxide in cytokine-activated endothelium.Biochem Biophys Res Commun1995,217:363-369. 30. Zhu G, Chang Y, Zuo J, Dong X, Zhang M, Hu G, Fang F:Fudenine, a
C-terminal truncated rat homologue of mouse prominin, is blood glucose-regulated and can up-regulate the expression of GAPDH.Biochem Biophys Res Commun2001,281:951-956.
31. Zhang J, Snyder SH:Nitric oxide stimulates auto-ADP-ribosylation of glyceraldehyde-3-phosphate dehydrogenase.Proc Natl Acad Sci USA1992,
89:9382-9385.
32. Chang TJ, Juan CC, Yin PH, Chi CW, Tsay HJ:Up-regulation of beta-actin, cyclophilin and GAPDH in N1S1 rat hepatoma.Oncol Rep1998,5:469-471. 33. Bhatia P, Taylor WR, Greenberg AH, Wright JA:Comparison of
glyceraldehyde-3-phosphate dehydrogenase and 28S-ribosomal RNA gene expression as RNA loading controls for northern blot analysis of cell lines of varying malignant potential.Anal Biochem1994,216:223-226. 34. Goidin D, Mamessier A, Staquet MJ, Schmitt D, Berthier-Vergnes O:
Ribosomal 18S RNA prevails over glyceraldehyde-3-phosphate dehydrogenase and beta-actin genes as internal standard for quantitative comparison of mRNA levels in invasive and noninvasive human melanoma cell subpopulations.Anal Biochem2001,295:17-21. 35. Schmittgen TD, Zakrajsek BA:Effect of experimental treatment on
housekeeping gene expression: validation by real-time, quantitative RT-PCR.J Biochem Biophys Methods2000,46:69-81.
36. Huggett J, Dheda K, Bustin S, Zumla A:Real-time RT-PCR normalisation; strategies and considerations.Genes Immun2005,6:279-284.
37. Dheda K, Huggett JF, Bustin SA, Johnson MA, Rook G, Zumla A:Validation of housekeeping genes for normalizing RNA expression in real-time PCR.
BioTechniques2004,37:112-114, 116, 118-119.
38. Nolan T, Hands RE, Bustin SA:Quantification of mRNA using real-time RT-PCR.Nat Protoc2006,1:1559-1582.
39. Bustin SA, Benes V, Garson JA, Hellemans J, Huggett J, Kubista M, Mueller R, Nolan T, Pfaffl MW, Shipley GL,et al:The MIQE guidelines: minimum information for publication of quantitative real-time PCR experiments.
Clin Chem2009,55:611-622.
40. Derveaux S, Vandesompele J, Hellemans J:How to do successful gene expression analysis using real-time PCR.Methods50:227-230.
41. Brinkhof B, Spee B, Rothuizen J, Penning LC:Development and evaluation of canine reference genes for accurate quantification of gene expression.Anal Biochem2006,356:36-43.
42. Schlotter YM, Veenhof EZ, Brinkhof B, Rutten VP, Spee B, Willemse T, Penning LC:A GeNorm algorithm-based selection of reference genes for quantitative real-time PCR in skin biopsies of healthy dogs and dogs with atopic dermatitis.Vet Immunol Immunopathol2009,129:115-118. 43. Andersen CL, Jensen JL, Orntoft TF:Normalization of real-time
quantitative reverse transcription-PCR data: a model-based variance estimation approach to identify genes suited for normalization, applied to bladder and colon cancer data sets.Cancer Res2004,64:5245-5250. 44. Peters IR, Peeters D, Helps CR, Day MJ:Development and application of
multiple internal reference (housekeeper) gene assays for accurate normalisation of canine gene expression studies.Vet Immunol Immunopathol2007,117:55-66.
45. Raaijmakers MH, van Emst L, de Witte T, Mensink E, Raymakers RA:
Quantitative assessment of gene expression in highly purified hematopoietic cells using real-time reverse transcriptase polymerase chain reaction.Exp Hematol2002,30:481-487.
46. Thorrez L, Van Deun K, Tranchevent LC, Van Lommel L, Engelen K, Marchal K, Moreau Y, Van Mechelen I, Schuit F:Using ribosomal protein genes as reference: a tale of caution.PLoS One2008,3:e1854.
47. Hartel C, Bein G, Muller-Steinhardt M, Kluter H:Ex vivo induction of cytokine mRNA expression in human blood samples.J Immunol Methods
2001,249:63-71.
48. Etschmann B, Wilcken B, Stoevesand K, von der Schulenburg A, Sterner-Kock A:Selection of reference genes for quantitative real-time PCR analysis in canine mammary tumors using the GeNorm algorithm.Vet Pathol2006,43:934-942.
49. Stamova BS, Apperson M, Walker WL, Tian Y, Xu H, Adamczy P, Zhan X, Liu DZ, Ander BP, Liao IH,et al:Identification and validation of suitable endogenous reference genes for gene expression studies in human peripheral blood.BMC Med Genomics2009,2:49.
50. DeRisi JL, Iyer VR, Brown PO:Exploring the metabolic and genetic control of gene expression on a genomic scale.Science1997,278:680-686. 51. Tanaka S, Furukawa T, Plotkin SA:Human cytomegalovirus stimulates host
cell RNA synthesis.J Virol1975,15:297-304. doi:10.1186/1756-0500-4-36
Cite this article as:Pieket al.:Leukocyte count affects expression of
reference genes in canine whole blood samples.BMC Research Notes
20114:36.
Submit your next manuscript to BioMed Central and take full advantage of:
• Convenient online submission
• Thorough peer review
• No space constraints or color figure charges
• Immediate publication on acceptance
• Inclusion in PubMed, CAS, Scopus and Google Scholar
• Research which is freely available for redistribution