Skin Stem Cell Hypotheses and Long
Term Clone Survival – Explored Using
Agent-based Modelling
X. Li1*, A. K. Upadhyay2*, A. J. Bullock3, T. Dicolandrea2, J. Xu2, R. L. Binder2, M. K. Robinson2, D. R. Finlay2, K. J. Mills2, C. C. Bascom2, C. K. Kelling2, R. J. Isfort2, J. W. Haycock3, S. MacNeil3 & R. H. Smallwood1
1Department of Computer Science, University of Sheffield, Sheffield, United Kingdom,2The Procter & Gamble Company, Cincinnati,
Ohio, United States of America,3Department of Materials Science & Engineering, University of Sheffield, Sheffield, United Kingdom.
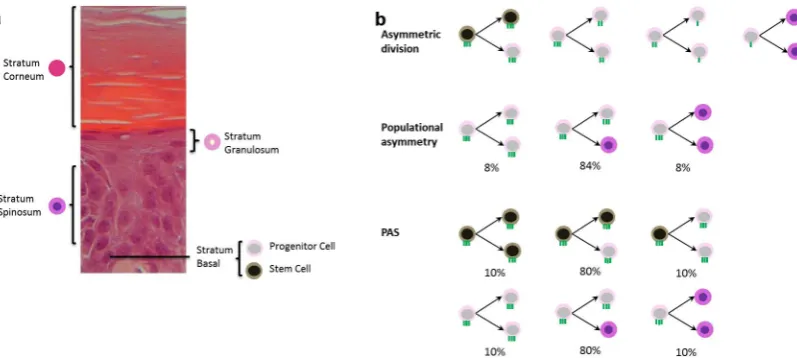
Epithelial renewal in skin is achieved by the constant turnover and differentiation of keratinocytes. Three popular hypotheses have been proposed to explain basal keratinocyte regeneration and epidermal homeostasis: 1) asymmetric division (stem-transit amplifying cell); 2) populational asymmetry (progenitor cell with stochastic fate); and 3) populational asymmetry with stem cells. In this study, we investigated lineage dynamics using these hypotheses with a 3D agent-based model of the epidermis. The model simulated the growth and maintenance of the epidermis over three years. The offspring of each proliferative cell was traced. While all lineages were preserved in asymmetric division, the vast majority were lost when assuming populational asymmetry. The third hypothesis provided the most reliable mechanism for self-renewal by preserving genetic heterogeneity in quiescent stem cells, and also inherent mechanisms for skin ageing and the accumulation of genetic mutation.
S
kin is the body’s first line of defense against environmental hazards, forming a protective barrier for the surface of the body. It consists of an epidermis and a dermis separated by a basement membrane. Keratinocytes are the main building blocks of the epidermis. Under normal conditions, cells on the skin surface are continuously replaced by new cells generated in the basal layer. Cells leave the basal layer and differentiate upwards to comprise the stratum spinosum, stratum granulosum and stratum corneum. These upper layers mediate skin barrier function. The lifespan of keratinocytes and their differentiation into a barrier to prevent water loss and infection are precisely regulated in order to achieve coordinated self-renewal by a process called homeostasis.Due to the dynamic nature of skin and the importance of its structural integrity, it is difficult to study the development of the tissuein vivo, as any disturbance in the epidermis (such as tape stripping or sodium dodecyl sulphate treatment) compromises the barrier function immediately and many of the experimental techniques used to study cell biology cannot ethically be carried out in man. Therefore, animal models andin vitrotissue engineered skin are commonly used as alternatives. Although these experiments provide a good representation of the humanin vivoequivalent, the results are usually qualitative and difficult to interpret on a continuum basis, which hinders integrating new discoveries with previous research. Computer models on the other hand, are ideal tools for investigating individual cell behaviour by combining laboratory data and the existing literature. Agent-based models have been frequently used for studying a group of entities (or agents)1–3, such as keratinocytes, each
with their unique properties4,5. The behaviour of each agent is defined using a set of rules based on the
experi-mental literature. Previous models of epithelial cells have been used in studying a wide range of applications, such as cell culture morphogenesis6, hierarchy of cells within the intestinal crypts7,8, activation of hematopoietic stem
cells9, the behaviour of sperm in the oviduct10, and modelling metabolic process in liver cells11. In particular,
epithelial cells in the intestinal crypts are famous for their monoclonality, where a single stem cell lineage is thought to sustain the entire population in each crypt7,8. This has been shown by Loeffleret al. (1997) through
their 2D models by applying a stochastic symmetric division pattern to stem cells7. The model was later extended
by Van Leeuwenet al.(1997) to investigate the process of mitosis and clonal expansion in the crypt8. In addition,
agent-based models have also been used extensively to simulate tissue regeneration under pathological condi-tions, such as the remodelling of airway epithelium in asthma12, the acute inflammatory response13, elucidating
SUBJECT AREAS: COMPUTATIONAL MODELS
SKIN STEM CELLS
COMPUTER MODELLING
SELF-RENEWAL
Received 21 February 2013 Accepted 7 May 2013 Published 28 May 2013
Correspondence and requests for materials should be addressed to X.L. (xinshan.li@ sheffield.ac.uk) or A.K.U. (upadhyay. [email protected])
amplifying (TA) cell population leading to the generation of an epi-thelial proliferation unit (EPU), which in turn sustains the renewal process in the tissue. By employing genetic labelling techniques, these studies followed colonies of regenerative cells over one year, and suggested an alternative hypothesis of division in the basal layer (see Figure 1). This hypothesis, described in Claytonet al.(2007)18,
is in favour of a single proliferative progenitor cell population that sustains epithelial renewal by producing post mitotic basal cells in a stochastic process. The experiments however, provided insufficient evidence for slow-cycling stem cells as had previously been sug-gested. However, recent evidence20suggests the existence of a
hier-archical organisation consisting of both fast-cycling progenitor cells and slow-cycling stem cells in an attempt to consolidate the tra-ditional stem-TA hypothesis with stochastic fate decision (hereon referred to as the ‘‘PAS’’ hypothesis, short for populational asym-metry with stem cells). All three hypotheses have been derived based on the observation of the dynamics of biological tissues over a steady state period of typically one year. Individually, each provides a sound mechanism that ensures the continuous regeneration during home-ostasis. However, these hypotheses are derived from a collection of static snap-shots of tissues at regular intervals and hence provide a limited window of information within the lifespan of the tissue. A similar problem lies with thein vitroexperiments, from which data can only be obtained over a few weeks. In contrast, these hypotheses can be used to generate rule sets which can run inexpensively using computer models, which can: (1) monitor the entire population over any numerical period; and (2) trace the development of individual lineages over years within the equivalent of days in computational time.
In this study, we employed agent-based modelling to investigate how three different hypotheses of clonal dynamics affected epithelial homeostasis. The modelling framework has been developed in the
following a modified version of the method of Chakrabartyet al.
(1999)24. This model has been tested extensively and used in a wide
range of research and clinical applications21,25–27. The H&E
micro-graph helps provide additional information for the computational model, such as the thickness and appearance of each layer (reported in a separate study). A large nucleus was plotted in basal cells, and thereafter nuclei size decreased gradually throughout the spinosum and granulosum layers. No nucleus was drawn in the stratum cor-neum to represent dead cells.
Results
Three different division scenarios were investigated: (1) asymmetric division (traditional stem-TA cell approach); (2) populational asym-metry published in Claytonet al.(2007)18; and (3) PAS hypothesis
proposed by Mascreet al.(2012)20. An initial number of 38 stem cells
were randomly seeded onto a 100mm3100mm basement mem-brane in scenarios (1) and (3). Each initial cell was assigned a unique label with its offspring carrying the same ‘‘genetic information’’. In the context of this study, a ‘‘colony’’ refers to the community of clones and their mother. Simulations were carried out for the equi-valent of three years (or 52560 iterations) and clonal fate was ana-lysed. In scenario (2), when 38 progenitor cells were used in the initial seeding, the resulting epidermis was very thin with poorly populated layers, indicating an insufficient number of regenerative cells. However, it was of interest to carry out the clonal analysis with only one proliferative population and compare the results with the hierarchical organisation suggested in the PAS hypothesis20.
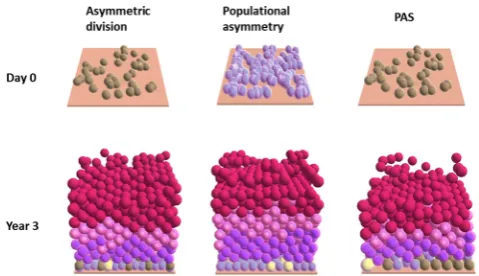
[image:2.595.99.498.524.703.2]Accordingly, the initial seeding population was increased to 120 progenitor cells (e.g. 120 lineages), corresponding to the approximate number of progenitor cells in the other two scenarios at homeostasis. Figure 2 provides an overview of the initial seeding and the mature epidermis at three years for each scenario. Although different
division hypotheses were used, the cellular organisation of the mature epidermis appeared similar across three scenarios. This is however, not the case when an individual colony was examined. Figure 3 illustrates the evolution of a particular stem cell lineage over three years in scenarios (1) and (3). The colony shape was relatively regular with asymmetric division compared to the PAS hypothesis. The asymmetric division assumption gave rise to colonies with sim-ilar appearance as the EPUs28,29, where a stem cell was surrounded by
its progeny in a columnar fashion as they migrate upwards. In con-trast, the PAS hypothesis showed rapid and irregular colony expan-sion and contraction (both upwards and laterally) over time. The colony took on no particular shape or pattern. Although scenario (2) was not included in this direct comparison due to a different initial seeding population, similar marked variation in colony size was observed, which was likely to be the result of stochastic fate decision during division.
In order to investigate the different behaviours of individual col-onies, a close examination was conducted on all lineages over three years. In the asymmetric division scenario (1), all of the 38 lineages remained at the end of three years. Figure 4a shows the evolution of the four largest colonies by year three with the total number of cells plotted in the secondary y-axis. The size of each colony was relatively uniform with moderate variations over time. This is further illu-strated in Figures 4b and 4c, where the mean colony size and the standard deviation are plotted. Figure 4b illustrates the average col-ony size during the first three months, showing an initial rise within the first four weeks. This corresponds to the initial peak in the total number of cells illustrated in Figure 4a at the beginning of the simu-lation when rapid growth was observed in the cell popusimu-lation. The colony size settled after two months, and remained relatively con-stant in the following two years as shown in Figure 4c. On average, approximately 28 cells can be found in each colony during the steady state. These results suggested a relatively stable organisation within the epidermis consisting of a regular number of colonies over time. There was no indication of rapid changes in colony size that lead to loss of lineages (assuming asymmetric division), in contrast to results reported in recent genetic labelling experiments18,20.
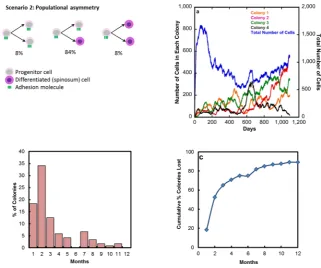
For the populational asymmetry scenario (2), when 120 progen-itor cells were seeded, only four survived at the end of three years (see Figure 5a). There were more substantial stochastic variations in indi-vidual colony over time compared to that predicted with asymmetric division. The majority of colonies (107 in total) were lost during the first year especially during the initial growth phase (repeating simu-lations showed similar trend of loss). Figures 5b and 5c illustrate the loss of these colonies during the first year. In Figure 5b, there is a distinctive peak in the number of colonies lost within the first two
months when activities in the basal layer were considerably high. As the epidermis reached a steady state, the trend of colony loss gradu-ally eased after three months. Figure 5c is a cumulative percentage plot of the colonies lost during the first year. Approximately 90% of colonies was lost by the end of year one, indicating a rapid and marked loss of lineages from the original population. In the following two years, there was a further colony loss of 7% (data not shown), indicating the possibility that more would disappear in the longer term. When only a few colonies were left to sustain tissue renewal during the second and third year, the total number of cells in the epidermis appeared to be very sensitive to fluctuations in the dom-inating lineages (e.g. similar peaks and troughs between the total number of cells and colony 2 in Figure 5a after 1,000 days). Furthermore, if this trend of colony loss continued, it could lead to a monoclonal epidermis. Although monoclonality is a widely recog-nised feature for the intestinal crypt (single layered)7,8, it has not been
proposed in multi-layered epidermis.
When a population of slow-cycling stem cells was added to the populational asymmetry scenario as suggested in Mascre et al.
(2012)20, an interesting pattern emerged for the PAS hypothesis.
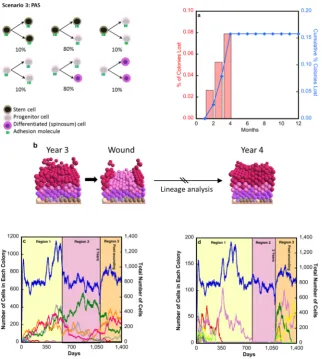
[image:3.595.46.286.50.188.2]As shown in Figure 6a, approximately 16% of lineages were lost in the first four months with no further loss up to one year. During the second and third year, one lineage was lost in each of the twelve-month periods (data not shown). Eight (approximately 20%) of the initial 38 lineages were actively dividing by the end of three years. Figure 6c (Regions 1–2) shows the evolution of these lineages. These colonies gradually grew in size over the first half of the three-year period (Region 1). In the second half of this period (Region 2), the green colony increased steadily and became dominating by year three, contributing to nearly half of the entire population. In contrast, all other lineages reduced in size during the same period. It is inter-esting to note that although the renewal process was sustained by these active colonies making up the entire supra-basal population, these lineages only accounted for three-quarters of the basal cells. The rest (22 lineages) of the basal population consisted of quiescent stem cells, making up approximately 60% of the initial lineages. Figure 6d (Regions 1–2) shows the evolution of these quiescent lineages over three years. These stem cells were active during the initial growth phase and gradually ceased division when normal barrier function had been established (e.g. formation of the stratum corneum). The result was a steady decline in colony size after the initial growth period as differentiated daughters continued to shed at the apical surface (Region 1). When all differentiated daughters were lost (Region 2), each lineage consisted only of the stem cells in a ‘‘sleep mode’’. Together, these quiescent stem cells carried a large Figure 2|Agent based model of the epidermis. The initial seeding
[image:3.595.306.548.51.172.2](day zero) and the mature epidermis (three years) are shown above. Cells shown in yellow are preparing for mitosis. The mature epidermis has similar appearance across the three scenarios with individual corneocytes shedding on top.
amount of genetic information but they rarely divided. It was sug-gested that quiescent stem cells only became reactivated when nor-mal barrier function was impaired, for example in response to wounding20. This was simulated in the model by removing a strip
[image:4.595.123.474.49.333.2]of the stratum corneum (60mm3100mm) in the mature epidermis at three years and allowing the simulation to run for another year. Changes in individual colonies in response to wounding are plotted in Region 3 in Figures 6c and 6d. The disruption in the normal barrier Figure 4|Asymmetric division colony dynamics.(a) The evolution of four largest colonies at the end of year three with the total number of cells (blue) plotted along the secondary y-axis. (b) The mean colony size (n538 colonies) during the first three months of development. (c) Colony size over three years. Error bars show standard deviation.
[image:4.595.136.458.444.712.2]function led to increased division in the basal layer (in the form of increased division probability in response to greater water loss after barrier disruption). As shown in Figure 6d (Region 3), several qui-escent lineages were re-activated, among which two (pink and yel-low) remained active one year post-wounding, one (green) was permanently lost and the rest reverted to a quiescent state when barrier function was restored. Figure 6c (Region 3) illustrates changes in the active colonies showing similar burst of activities immediately after wounding, among which three lineages (pink, red and brown) entered quiescent state and one was lost at the end. This fluctuation in colony dynamics gradually eased after homeostasis was re-estab-lished around 3.5 years (or approximately 1,300 days). It is interest-ing to note that within several months post-woundinterest-ing, the green lineage in Figure 6c lost its dominating position to the orange and magenta lineages, both of which expanded rapidly after barrier dis-ruption. The common switch in dominating colonies over time sug-gested a trend of competition among individual lineages as some grew while others were reduced in size. The observed large random variations in colony size in this scenario is similar to that of the populational asymmetry, which is expected as both hypotheses used stochastic fate assumption.
Discussion
These results successfully demonstrated the ability of a computer model to predict the long-term behaviour of colony dynamics
comparing different hypotheses of stem cell generation of epithe-lium. In particular, this enables for the first time information to be gained on every single cell and its offspring. This is information which is currently technically impossible to achieve in the laboratory. To our knowledge, this is the first study on modelling long term colony dynamics in the epidermis, and goes beyond the existing literature using alternative methods such as genetic labelling. When consolidated with existing knowledge of skin biology, we sug-gest the PAS hypothesis proposed by Mascreet al.(2012)20provides
the best mechanism for sustained tissue regeneration and homeosta-sis. The experimental work of Mascreet al.(2012)20provided strong
suggestive evidence supporting the PAS hypothesis, but even with the genetic labelling methods they used, stem and progenitor cells could not be distinguished with certainty. The research presented here provides anin silicoapproach to test the alternative hypotheses of epidermal homeostasis and complements experimental studies. These results, including the long-term tracking of individual cell lineages suggested that quiescent stem cells help preserve genetic heterogeneity in the system by preventing irreversible loss of cells due to stochastic symmetric division. This provides strong evidence to support the importance of slow-cycling stem cells contributing to long-term tissue regeneration20. Our simulation results based on this
[image:5.595.138.461.50.410.2]hypothesis indicate a tendency for very gradual loss of stem cells over the years, particularly during barrier repair. This may help explain the slow decline of healing and regenerative capacity as we age30.
experiments and from previous interfollicular epidermis studies. The asymmetric division hypothesis showed some competition among colonies (as small fluctuation in colony size), but lacked the mech-anism to explain rapid colonial expansion and loss over time. On the other hand, the populational asymmetry hypothesis provided the additional stochastic fate during division. However, the lack of a slow-cycling stem cell population means that colonies disappear very rapidly, with only 3% of initial colonies surviving after three years in the model and with the possibility for further loss, leaving the epidermis extremely vulnerable to any subsequent mutations. A mutated progenitor cell in a dominating colony could potentially give rise to cancerous growth affecting a very large area of the skin (field cancerization), rarely reported in BCC or SCC.
Throughout the simulation, variation was noted in the total num-ber of cells in all three cases over the three year period. This is partly due to the stochastic division pattern in scenarios (2) and (3), but also indicates the need to improve the desquamation algorithm to include additional feedback mechanisms, such as an ion gradient for more rapid responses. The physical model employed here used trans-epi-dermal water loss (TEWL) as a simple and robust measure of normal barrier function for this purpose.
Findings from this study will provide preliminary data to direct future experimental research in proliferative cells and their progeny. Various genetic labelling studies have followed cell lineages during healing of full thickness wounds20. Our modelling results suggest that
such experimental lineage tracking after more superficial damage to the epidermis will be useful to understand better clonal evolution and epidermal homeostasis. Similar experiments can also be applied to aging skin, where the recovery process is believed to occur more slowly36–39. The aging process can be simulated in the agent-based
model by flagging or transiently damaging proliferative cells to reduce their replication efficiency.
With the advancement in image processing tools such as ImageJ, more detailed and rapid quantitative analysis could be conducted on a range of biological images in the future, such as H&E micrographs, OCT, and confocal Ramen Spectroscopy. These imaging modalities provide the flexibility of visualising tissue-engineered skin in various states. The static images can be processed to derive information such as the thickness and number of cells in each epidermal layer, the state of the dermal-epidermal junction (e.g. waviness), as well as molecular information such as cellular adhesion and bonding. With a collection of data at multiple time points, this unique information will be valu-able during the construction and validation of the agent-based model. In conclusion, using an agent-based model we have compared the colony dynamics for three different hypotheses of epidermal home-ostasis over a three-year period (a long period that is difficult to conduct in the laboratory and not previously reported) and demon-strated the importance of a quiescent, slow-cycling population of stem cells in long-term skin epithelium regeneration and homeosta-sis. This approach can be applied to study stem cell dynamics in other epithelial tissues (e.g. cornea and intestine) looking at the dynamics of how these tissues not only form but respond to damage with regeneration. Further modifications could also be readily made to model mutations in specific lineages that lead to BCC and SCC.
Methods
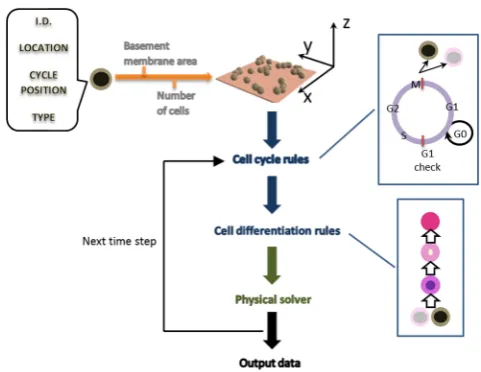
FLAME (http://www.flame.ac.uk/) was used to model the emergent behaviour of keratinocytes and Figure 7 provides a brief illustration of the modelling algorithm employed. At the beginning of the simulation, the user specified the number and type of cells to seed, their location and the number of iterations to perform. The information was stored collectively in a list of agent variables. Each iteration repre-sented 30 minutes in real time. Each keratinocyte went through the cell cycle and differentiation algorithms and their physical interactions were resolved at the end. The updated agent variables were output to an XML file before the next iteration. A periodic boundary constraint was applied at the edges of the basement membrane.
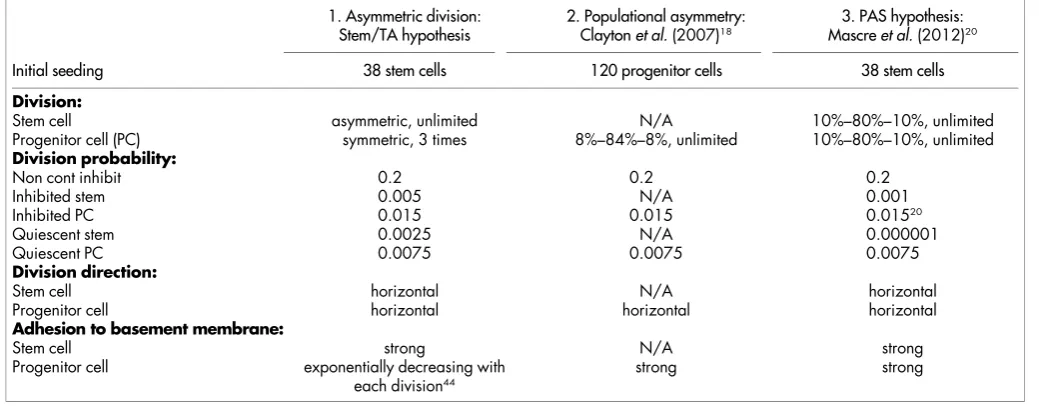
Biological rules.The cell cycle lengths for stem and progenitor cells were assumed to be 30 hr and 15 hr, respectively40. Table 1 illustrates the parameters used in the three division hypotheses. Both the first and the third scenarios started from 38 randomly introduced stem cells (corresponding to the approximate seeding density used for the in vitro3D tissue engineered skin model in our laboratory). As stem cells did not play an active role in the second scenario, an initial seeding population of 38 progenitor cells was tested. However, the resulting epidermis was very thin and poorly populated. Therefore, the initial seeding number was increased to 120 to correlate with the approximate amount of progenitor cells in the other two scenarios at homeostasis. This was able to generate a more stable epidermis, which enabled a comparison with the behaviour of lineages with (PAS hypothesis) and without a slow-cycling stem cell population.
A G1 checkpoint was performed half way through the cell cycle, where a random number was drawn and compared with the probability of division (see Table 1). After each cell passed the G1 checkpoint, the cell volume increased two-fold during the S-G2 phase prior to the next cycle of division. Before reaching confluence, basal cells had a 20% probability of passing the G1 checkpoint (e.g. non-contact inhibited). Confluent cells (those with more than three neighbours) had a reduced probability to reflect growth restriction imposed by cell-to-cell mechanical contact (e.g. inhibited)40. The probability was further halved when normal barrier function was established (e.g. quiescent). This was achieved through a feedback loop by monitoring the level of transepidermal water loss (TEWL) using a formula proposed by Schwindtet al. (1998), which relates TEWL to the thickness of the stratum corneum41,42. This enabled TEWL to be used as an indirect measure of the differentiation process. A threshold value of 40 g
m2hwas used in this study
41,42. TEWL values lower than the threshold
value indicated the presence of a mature stratum corneum. This would lead to reduced proliferation and stem cells entering the quiescent state. Due to the unique mechanism proposed for regeneration in each scenario, the division probability for progenitor cells was kept constant for each scenario, whereas the probability for stem cells differed. A very small probability of division was imposed for quiescent stem cells in the third scenario according to the low division rate of four to six per year observed in Mascreet al.(2012)20. The same probability for the asymmetric division scenario was set to a higher level (0.25%) to ensure an on-going gradual supply of progenitor cells at the steady state for self-renewal. No stem cell division probability was defined in scenario (2) due to an absence of this population in the hypothesis.
[image:6.595.307.548.49.235.2]For the asymmetric division scenario, an additional cellular mechanism was introduced to differentiate ‘‘old’’ progenitor cells from ‘‘new’’ ones by progressively
decreasing the adhesive force by 10-fold after three divisions. Although this idea of history dependent TA cell behaviour has been proposed by several groups in the past43–45, to the authors’ knowledge, this is the first time it has been used in a math-ematical model. The gradual decrease in adhesive force represented the degradation ofb1 integrin as TA cells lose their capacity of self-renewal, and transform towards displaying a more post-mitotic phenotype44.
Keratinocyte cells differentiate as they move from the basal to the apical surface. The differentiation process may be interrupted by many changes, such as the adhe-sion mechanism (b1 integrin), ion gradients (calcium) or intercellular signalling (Notch-Delta). The onset of differentiation was determined by mechanical interac-tions in a way that cells that experienced a net upward force (from neighbours and basement membrane) would be pushed into the second layer (details in the next section), which initiated the differentiation process. Because the focus of this study was to compare the effect of various division hypotheses that have particular effects on the basal population, a simplified approach was employed to regulate differenti-ation after the initial onset. By assuming all factors behaved normally in the local environment, the differentiation process was considered to be an intrinsic property of the cells, controlled by a timer that started as soon as a cell left the basal layer. Based on the literature46, it was assumed that cells spent seven days in the spinosum layer and a further seven days in the granulosum layer before entering the stratum corneum. Shedding of corneocytes was induced by an external abrasive force and regulated by mechanical interactions among the upper layer corneocytes.
Physical forces.A detailed description of the physical solver can be found in Salem et al.(2010)47. This section provides a brief overview of the algorithm. The motion of the keratinocyte cell was described using Newton’s second law:
mid 2u
i dt2zci
dui dt~
Xn
j~1
FrijzFaij ð1Þ
Assuming a unit density for each cell, massmi5riVi, whereuiis the displacement for each celliin three directions. The damping constantci50.1mi47. The right hand side term is the sum of all forces celliexperiences from its neighbours (indexj), with a total number ofnkeratinocytes in the model. Two types of physical force were considered here: a contact or repulsive force (Frij), and the finite range adhesive force (Faij) resulting from intercellular or cell to membrane bonding.
A frictionless contact environment was assumed to mimic the intercellular space that is filled with phosphate-buffered saline (PBS). For simplicity, tangential frictional forces were not explicitly modelled. The penalty method was used to resolve the contact forces48. This could be seen as having a network of springs between two adjacent cells. When there is an overlap, the spring repels to separate the cells. The magnitude of the force is proportional to the overlapgijbetween them. The repulsive force is zero (at equilibrium) when two cells are just touching (gij50). The force increases linearly when cells overlap (gij,0):
Frij~ egij
r 0
(
gijv0
gij§0 ð2Þ
The contact stiffnessedefines the stiffness of the spring, with estimated values of 3mN and 10mN for cell-cell and cell-membrane interactions, respectively. These values were estimated by starting from a small value (0.1mN), which was insufficient to penalise the overlap and then incremented until no visible overlaps were detected. A small amount of perturbation in these values (10–50%) did not affect model predictions. The radius of each keratinocyte was represented byr.
If the separation distancegijbetween two cells was positive and within 5mm apart, cells were assumed to form a stable bond according to estimates from time-lapse images of human urothelial cells in Walkeret al.(2010)49. The value was estimated as the length of maximum lamellapodia extension that was required for cells to form stable bonds. A small perturbation in the adhesive range (by 10–50%) did not affect the dynamics of the epidermis model. The basic form of the adhesive force was adapted from Palsson (2008) and modified for centre-based spherical agents50. In the x direction, this becomes:
Fa
ij(x)~{a (bij(x)zc1)e{l(bij(x)zc1) 2
{c2e{lb2ij(x)
ð3Þ
Fa ij(x)~Faij(x)
gij(x)
gij(x)
,0ƒg
ij(x)v5mm ð4Þ
bij(x)~
gij(x)
r ,c1~
ffiffiffiffiffi
1 2l
r
,c2~c1e{lc2
1 ð5Þ
The value ofaaffects the magnitude of the peak force, whilel57 can be modified to vary the interval of this function. Theavalues used for cell-cell and cell-membrane adhesion was 0.2mN (peak force of 5 nN)51,52and 500mN (representing very strong interactions for stem-like cells), respectively.
The increase in cell-cell adhesion from the basal to the granulosum layer was estimated from Skerrowet al.(1989) by applying a scale factor to the adhesive force equation (3), assuming the adhesive force in each layer was linearly proportional to the number of desmosomes53,54. The scale factor value increased from the lower spinosum towards the upper surface on a layer-by-layer basis and peaked in the granulosum layer (at 2.7), where cells were most tightly bound. The transition from lower stratum corneum to the upper surface lead to a decrease in desmosomes in preparation for desquamation54–56. The subsequent reduction in vertical adhesion was modelled using an exponential decay adapted from Schaller and Meyer-Hermann (2007)57, where the adhesive force in the vertical direction would reduce to nearly zero over five days by applying a degradation factor (DF) in front ofFa
ij(z):
DFij~ (1{c)
ti{t(1{c)tj{t
1
(
ti,tjwt
otherwise ð6Þ
wheretis the differentiation timer for neighbouring cellsiandj, respectively,c5 0.018 controls the rate of decay of the adhesive force57, andt5720 iterations (or fifteen days, note that it took 14 days for a spinosum cell to travel to the stratum corneum). This gave rise to a steady decline of the adhesive force from the lower stratum corneum towards the outer surface58. Desquamation then took place by applying an upward abrasive force (4.0mN/cell) on every cell in the top layer to mimic the daily wearing forces exhibited at the skin surface59. Detached corneocytes (those with a gap of more than 20mm from the layer below) were eliminated from the algorithm.
1. Deisboeck, T. S., Wang, Z., Macklin, P. & Cristini, V. Multiscale cancer modeling. Annu. Rev. Biomed. Eng.13, 127–55 (2011).
[image:7.595.40.560.71.274.2]2. Hogeweg, P. Evolving mechanisms of morphogenesis: on the interplay between differential adhesion and cell differentiation.J. Theor. Biol.203, 317–33 (2000). Table 1 | Parameters used in the model for the three division hypotheses
1. Asymmetric division: Stem/TA hypothesis
2. Populational asymmetry: Claytonet al.(2007)18
3. PAS hypothesis: Mascreet al.(2012)20
Initial seeding 38 stem cells 120 progenitor cells 38 stem cells
Division:
Stem cell asymmetric, unlimited N/A 10%–80%–10%, unlimited
Progenitor cell (PC) symmetric, 3 times 8%–84%–8%, unlimited 10%–80%–10%, unlimited
Division probability:
Non cont inhibit 0.2 0.2 0.2
Inhibited stem 0.005 N/A 0.001
Inhibited PC 0.015 0.015 0.01520
Quiescent stem 0.0025 N/A 0.000001
Quiescent PC 0.0075 0.0075 0.0075
Division direction:
Stem cell horizontal N/A horizontal
Progenitor cell horizontal horizontal horizontal
Adhesion to basement membrane:
Stem cell strong N/A strong
Progenitor cell exponentially decreasing with each division44
[image:7.595.354.552.356.436.2]tissue renewal.Cell Proliferat.42, 617–36 (2009).
9. Glauche, I.et al. Stem cell proliferation and quiescence--two sides of the same coin.PLoS Comput. Biol.5, e1000447 (2009).
10. Burkitt, M., Walker, D., Romano, D. M. & Fazeli, A. Modelling Sperm Behaviour in a 3D Environment.The 9th Conference on Computational Methods in Systems Biology141–9 (2011).
11. Holzhu¨tter, H.-G., Drasdo, D., Preusser, T., Lippert, J. & Henney, A. M. The virtual liver: a multidisciplinary, multilevel challenge for systems biology.Wiley Interdiscip. Rev. Sys. Biol. Med.(2012).
12. Burrowes, K. S.et al. Multi-scale computational models of the airways to unravel the pathophysiological mechanisms in asthma and chronic obstructive pulmonary disease (AirPROM).J. R. Soc. Interface3, 20120057 (2013). 13. Vodovotz, Y., Clermont, G., Chow, C. & An, G. Mathematical models of the acute
inflammatory response.Curr. Opin. Crit. Care10, 383–390 (2004).
14. Grabe, N. & Neuber, K. Simulating psoriasis by altering transit amplifying cells. Bioinformatics23, 1309–12 (2007).
15. Anderson, A. R. A. A hybrid mathematical model of solid tumour invasion: the importance of cell adhesion.Math. Med. Biol.22, 163–86 (2005).
16. Sun, T., Haycock, J. & Macneil, S. In situ image analysis of interactions between normal human keratinocytes and fibroblasts cultured in three-dimensional fibrin gels.Biomaterials27, 3459–65 (2006).
17. Sun, T., Adra, S., Smallwood, R., Holcombe, M. & MacNeil, S. Exploring hypotheses of the actions of TGF-beta1 in epidermal wound healing using a 3D computational multiscale model of the human epidermis.PloS One4, e8515 (2009).
18. Clayton, E.et al. A single type of progenitor cell maintains normal epidermis. Nature446, 185–9 (2007).
19. Jones, P. H., Simons, B. D. & Watt, F. M. Sic transit gloria: farewell to the epidermal transit amplifying cell?Cell Stem Cell1, 371–81 (2007).
20. Mascre´, G.et al. Distinct contribution of stem and progenitor cells to epidermal maintenance.Nature489, 257–62 (2012).
21. Harrison, C. A.et al. Transglutaminase inhibitors induce hyperproliferation and parakeratosis in tissue-engineered skin.Brit. J. Dermatol.156, 247–57 (2007). 22. Harrison, N. M.et al. Heterogeneous linear elastic trabecular bone modelling using micro-CT attenuation data and experimentally measured heterogeneous tissue properties.J. Biomech.41, 2589–96 (2008).
23. Koehler, M. J.et al. Keratinocyte morphology of human skin evaluated by in vivo multiphoton laser tomography.Skin Res. Technol.17, 479–486 (2011). 24. Chakrabarty, K. H.et al. Development of autologous human dermal-epidermal
composites based on sterilized human allodermis for clinical use.Brit. J. Dermatol. 141, 811–23 (1999).
25. MacNeil, S. Progress and opportunities for tissue-engineered skin.Nature445, 874–80 (2007).
26. Bullock, A. J., Barker, A. T., Coulton, L. & MacNeil, S. The effect of induced biphasic pulsed currents on re-epithelialization of a novel wound healing model. Bioelectromagnetics28, 31–41 (2007).
27. Harrison, C. A., Dalley, A. J. & MacNeil, S. A simple in vitro model for investigating epithelial/mesenchymal interactions: keratinocyte inhibition of fibroblast proliferation and fibronectin synthesis.Wound Repair Regen.13, 543–550 (2005).
28. Potten, C. S. The epidermal proliferative unit: the possible role of the central basal cell.Cell Proliferat.7, 77–88 (1974).
29. Ghazizadeh, S. & Taichman, B. L. Organization of stem cells and their progeny in human epidermis.J. Invest. Dermatol.124, 367–372 (2005).
30. Leyden, J. J. Clinical features of ageing skin.Brit. J. Dermatol.122 Suppl, 1–3 (1990).
31. Youssef, K. K.et al. Identification of the cell lineage at the origin of basal cell carcinoma.Nat. Cell Biol.12, 299–305 (2010).
32. Driessens, G., Beck, B., Caauwe, A., Simons, B. D. & Blanpain, C. Defining the mode of tumour growth by clonal analysis.Nature488, 527–30 (2012). 33. Watt, F. M. Role of integrins in regulating epidermal adhesion, growth and
differentiation.EMBO J.21(2002).
34. Arwert, E. N., Hoste, E. & Watt, F. M. Epithelial stem cells, wound healing and cancer.Nat. Rev. Cancer12, 170–180 (2012).
35. Gilbertson, R. J. & Graham, T. A. Cancer: Resolving the stem-cell debate.Nature 488, 462–63 (2012).
human stratum corneum at different anatomical sites in vivo.J. Invest. Dermatol. 111, 385–9 (1998).
42. Pinto, P. C. & Rodrigues, L. M. Influence of the time of occlusion on the quantitative parameters obtained by modelling trans-epidermal water loss curves to describe the human cutaneous barrier function in vivo.Med. Biol. Eng. Comput. 43, 771–775 (2005).
43. Kaur, P. & Potten, C. S. The interfollicular epidermal stem cell saga: sensationalism versus reality check.Exp. Dermatol.20, 697–702 (2011). 44. Webb, A., Li, A. & Kaur, P. Location and phenotype of human adult keratinocyte
stem cells of the skin.Differentiation72, 387–95 (2004).
45. Zhu, A. J., Haase, I. & Watt, F. M. Signaling via beta1 integrins and mitogen-activated protein kinase determines human epidermal stem cell fate in vitro.Proc Natl Acad Sci (USA)96, 6728–33 (1999).
46. Blanpain, C. & Fuchs, E. Epidermal homeostasis: a balancing act of stem cells in the skin.Nat. Rev. Mol. Cell Bio.10, 207–17 (2009).
47. Adra, S., Sun, T., MacNeil, S., Holcombe, M. & Smallwood, R. Development of a three dimensional multiscale computational model of the human epidermis.PloS One5, e8511 (2010).
48. Wriggers, P.Computational contact mechanics.185, (Springer Berlin/Heidelberg: 2006).
49. Walker, D. C., Georgopoulos, N. T. & Southgate, J. Anti-social cells: predicting the influence of E-cadherin loss on the growth of epithelial cell populations.J. Theor. Biol.262, 425–40 (2010).
50. Palsson, E. A 3-D model used to explore how cell adhesion and stiffness affect cell sorting and movement in multicellular systems.J. Theor. Biol.254, 1–13 (2008).
51. Chu, Y.et al. Force measurements in E-cadherin-mediated cell doublets reveal rapid adhesion strengthened by actin cytoskeleton remodeling through Rac and Cdc42.J. Cell Biol.167, 1183–94 (2004).
52. Baumgartner, W.et al. Cadherin interaction probed by atomic force microscopy. Proc Natl Acad Sci (USA)97, 4005–10 (2000).
53. Foty, R. A. & Steinberg, M. S. The differential adhesion hypothesis: a direct evaluation.Dev. Biol.278, 255–63 (2005).
54. Skerrow, C. J., Clelland, D. G. & Skerrow, D. Changes to desmosomal antigens and lectin-binding sites during differentiation in normal human epidermis: a quantitative ultrastructural study.J. Cell Sci.92, 667–77 (1989).
55. Ishida-Yamamoto, A., Igawa, S. & Kishibe, M. Order and disorder in corneocyte adhesion.J. Dermatol.38, 645–54 (2011).
56. Naoe, Y., Hata, T., Tanigawa, K., Kimura, H. & Masunaga, T. Bidimensional analysis of desmoglein 1 distribution on the outermost corneocytes provides the structural and functional information of the stratum corneum.J. Dermatol. Sci. 57, 192–8 (2010).
57. Schaller, G. & Meyer-Hermann, M. A modelling approach towards epidermal homoeostasis control.J. Theor. Biol.247, 554–73 (2007).
58. Chapman, S. J. & Walsh, A. Desmosomes, corneosomes and desquamation. An ultrastructural study of adult pig epidermis.Arch. Dermatol. Res.282, 304–310 (1990).
59. Chapman, S. J., Walsh, A., Jackson, S. M. & Friedmann, P. S. Lipids, proteins and corneocyte adhesion.Arch. Dermatol. Res.283, 167–73 (1991).
Acknowledgements
The work was supported by The Procter & Gamble Company, Cincinnati, Ohio, USA.
Author contributions
X.L. and A.K.U. developed the computational algorithm, performed simulation and data analysis. A.J.B. performed thein vitrotissue-engineered skin experiments. T.D., J.X., R.L.B., M.K.R., D.R.F., K.J.M., C.C.B., C.K.K., R.J.I., J.W.H., S.M. and R.H.S. contributed to the creation of biological and physical rules in the model, and the correction of the manuscript. X.L. wrote the manuscript. A.K.U. and A.J.B. contributed to writing of the manuscript.
Additional information
License:This work is licensed under a Creative Commons
Attribution-NonCommercial-NoDerivs 3.0 Unported License. To view a copy of this license, visit http://creativecommons.org/licenses/by-nc-nd/3.0/