477
Tan and Yang are with the Tianjin Institute of Physical Education, Tianjin, China. Wang is with the Dept. of Biological and Physical Sciences, Centre for Systems Biology, University of Southern Queensland, Toowoomba, Queensland 4350, Australia.
Physical Training of 9- to
10-Year-Old Children With Obesity
to Lactate Threshold Intensity
Sijie Tan and Chunhua Yang Tianjin Institute of Physical Education
Jianxiong Wang
University of Southern Queensland
The purpose of this study was to apply the lactate threshold concept to develop a more evidence-informed exercise program for obese children. 60 obese children (26 girls and 34 boys, age: 9–10 years, BMI: 25.4 ± 2.2kg/m2) were recruited and
half of them were randomly selected to be trained for eight weeks with a controlled exercise intensity at lactate threshold. The trained children achieved significant improvements on their body composition and functional capacity compared with the control group. The findings suggested that the training program with intensity at lactate threshold is effective and safe for 9–10 year old children with obesity.
The worldwide prevalence of childhood obesity has been increasing dra-matically (10,23). Physical inactivity, as one of the risk factors, has been directly linked to this current epidemic (13). Based on the first law of thermodynamics (basically states that energy can neither be created nor destroyed, only transformed or transferred), an increase in physical activity (i.e., expending more energy) has been recognized as an effective option to prevent and treat childhood obesity (8). Many studies have demonstrated the beneficial effects of physical activity on body composition (1,15), cardiovascular fitness (5,7,15), lipid profile (12), and plasma leptin (4) in children with obesity.
oxygen uptake (6). The problem with this method was that not every subject of the 13–16 year old group could achieve peak oxygen uptake in a maximal exercise test. The younger children are likely to have had the same problem in the testings. Therefore, precisely determining exercise intensity, the core item of exercise pre-scription, in training obese children still requires considerable elucidation.
To design an exercise program based on a solid theoretical background and to provide an evidence-based training intensity (target HR) to children with obesity, we applied the lactate threshold (LT), a basic concept of exercise physiology (16), in determining exercise intensity when we treated a group of 9–10 years old obese children. LT is defined as an exercise intensity above which blood lactate concentra-tion increases nonlinearly as exercise intensity increases and exercise energy supply increases reliance on anaerobic metabolism (i.e., glycolysis; 16, 21). Human cells use more carbohydrate but less fat as energy during anaerobic metabolism. However, exercise with the intensity controlled at or lower than LT would use more body fat as energy through aerobic metabolism (2). In the current study, we measured LT in a group of 9–10 years old obese children, recorded the HR at the LT level, and then controlled the exercise intensity in the following physical training program at this particular heart rate. The purposes of this study were to evaluate the effect of eight weeks of physical training with controlled exercise intensity at the HR at LT, and to investigate the energy expenditure of such a training program in this group of obese children.
Methods
Subjects
In this study, obesity was defined as having a body mass greater than 20% above the standard body mass-for-height of Chinese children (3). Twenty-six girls and 34 boys who matched this criterion were recruited from a local primary school between March 2006 and July 2006. The school is located in an inner suburb of Tianjin, one of the largest cities in China, with a population of nine million. The details of the entire study were explained to the children and parents before the baseline test. This study was approved by the Institutional Ethics Committee of Tianjin Institute of Physical Education and the written informed consent was obtained from the parents of each subject.
Study Design
waist girth, cardiovascular fitness, 5-min run-walk test, and standing long jump were measured at baseline and week eight to evaluate the effect of the program. The energy expenditure rates of the various physical activities were also measured to investigate the energy expenditure in each training session.
Anthropometric Measures
Body mass was assessed with a balance scale (with underwear and no shoes) and height with a stadiometer (without shoes). Body mass index (BMI) was calculated as body mass (kg) divided by height in meters squared (m2). Three standard skinfolds
(triceps, subscapular, and abdominal) were measured using a calibrated skinfold caliper. Waist girth was measured at the horizontal plane at the level of the umbi-licus (without clothing). All measurements were run three times and the average was reported. All skinfolds and waist girth were measured by the same researcher.
Cardiovascular Fitness
The heart rate response to a certain exercise workload was used as the index of cardiovascular fitness. The subject rested for 10 min before the resting HR was measured. Following this, a modified constant-load exercise test was conducted; 30 squats in 30 s (17). HR at the end of exercise and 1 min after exercise were mea-sured. The HR index was calculated as (resting HR + end exercise HR + recovery HR at 1 min—200) ÷ 10. HR was monitored using a PE-4000 HR monitor (Polar Electro, Finland).
Energy Intake and Expenditure
After an introduction session, the parents were asked to record five weekdays of diet recalls for their child. The weight of food and the percentages of carbohydrate, fat, and protein in the food were estimated from the parents’ records. According to the Atwater general factor, dietary carbohydrate provides 4kCal/g of energy, dietary fat 9kCal/g, and dietary protein 4kCal/g (11). Daily energy intake was then calculated by multiplying the weight of carbohydrate, fat, and protein consumed with their energy values. Following removal of the highest and the lowest data, the average of other three days was reported as the daily energy intake. The parents also recorded the 24-hr free-living physical activity of their child for two weekdays. This record was based on the recall of school physical activities by the child and the observation of physical activities at home by the parents. The energy expenditure was calculated according to the time spent on physical activities with different intensities (i.e., light, moderate, or high), and sleep. The metabolic constant of various activities were obtained from the Annex 7: calculation of BMR and total energy expenditure of the Report of a Joint FAO/WHO/UNU Expert Consultation (18). The average data of these two days was reported as the daily energy expenditure.
Lactate Threshold
The duration of the test was 12 min (i.e., six stages of exercise). In a pilot study, we found that the LT of 9–10 year old children occurred within six stages of this kind of exercise. Blood samples (25μl) were collected at rest and at the end of each exercise stage from the fingertips and the blood lactate concentration was measured using an Accusport lactate analyzer (Boehringer Mannheim, Germany). The HR at LT was recorded and applied later in prescribing the training program.
Physical Activity Program
Without dietary modification, children of the training group participated in an 8-week supervised physical activity program with five sessions per week, 50 min per ses-sion, for a total of 40 sessions. There was a 5-min warm-up at the beginning of each session, which included walking, jogging, and gentle stretching activities. Physi-cal activities included in the program were running, jumping, squatting, crawling, and aerobic dance. These activities were organized into five to six minute bouts of exercise. There were two minutes of rest between exercise bouts. Physical training time was summed up to 40 min per session. At the end of each session, there was a 5-min cool-down with light activities which relaxed subjects to their resting condi-tion. All training sessions were carried out in a group of 6–8 children at the school’s gym and sports field. Physical education teachers and researchers supervised the training. Children were asked to exercise up to and to try to maintain their HR at LT during the bouts. HR was monitored during the training sessions for all children.
Energy expenditure rates in various physical activities employed in this train-ing program were estimated. O2 uptake and CO2 production were measured using a portable gas analyzer (Metamax II, Cortex, Germany), and then the respiratory quotient (RQ) was calculated as the CO2 production divided by the O2 consumption. Energetic equivalent of oxygen was assigned based on the RQ. Energy expenditure rate, how much energy expended per minute (kCal/min), was obtained by multiply-ing O2 uptake during the physical activity with the energetic equivalent of oxygen (11). The following physical activities were measured: 3 min of running at 6.5km/h on a treadmill, 1 min of squatting (60 times/min), 1 min of oblique push-up (60 times/min), 1 min of rope skipping (60 times/min), 3 min of crawling, 1 min of marching on the spot (60 steps/min), and 3 min of aerobic dance.
Statistical Analyses
A paired t test was used to determine any change in the measured variables before and after the experimental period (either physical training or control). One-way analysis of variance (ANOVA) was performed to compare the changes between the two groups. Statistical significant difference was set at p < .05. All statistical analyses were performed with the SPSS Version 11.5 for Windows (SPSS Inc. Chicago. IL. USA).
Results
prescribed exercise program and no subjects in either group engaged in any dietary plan during the experimental period.
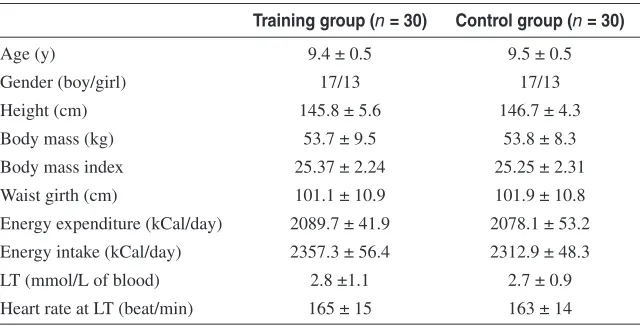
At baseline, there were no significant differences in age, BMI, skinfolds, and waist girth between the groups. The average daily energy intake of these subjects was about 200–300 kCal higher than their free-living energy expenditure, and there was no significant difference in the energy intake and expenditure between the groups. Tested in a submaximal graded exercise protocol, LT occurred at a blood lactate concentration of 2.8mmol/L in the training group and 2.7mmol/L in the control group; once again, there was not significantly different between the groups. The average HR at LT was 165beat/min in the training group, which was used as the target HR of training intensity (Table 1).
Table 1 Characteristics of the Subjects at Baseline
Training group (n = 30) Control group (n = 30)
Age (y) 9.4 ± 0.5 9.5 ± 0.5
Gender (boy/girl) 17/13 17/13
Height (cm) 145.8 ± 5.6 146.7 ± 4.3
Body mass (kg) 53.7 ± 9.5 53.8 ± 8.3
Body mass index 25.37 ± 2.24 25.25 ± 2.31
Waist girth (cm) 101.1 ± 10.9 101.9 ± 10.8
Energy expenditure (kCal/day) 2089.7 ± 41.9 2078.1 ± 53.2 Energy intake (kCal/day) 2357.3 ± 56.4 2312.9 ± 48.3
LT (mmol/L of blood) 2.8 ±1.1 2.7 ± 0.9
Heart rate at LT (beat/min) 165 ± 15 163 ± 14
Note. All data are presented in mean ± SD. LT: lactate threshold.
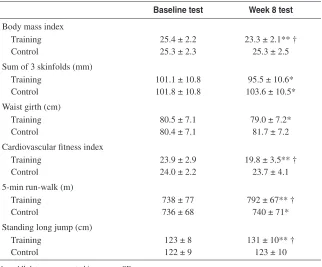
Based on energy expenditures of various physical activities, the training pro-gram was prescribed with the purpose of expending at least 200 kCal during each session (Table 2). At the completion of eight weeks of intervention, BMI, skinfold estimates, waist girth measure, cardiovascular fitness, running and jumping ability showed significant improvements in the training group, while the control group had significant increases in the sum of skinfolds and 5-min run-walk distance. Furthermore the training group showed a significantly lower BMI and significantly better performances of cardiovascular fitness and running and jumping ability than to those of the control group (Table 3).
Discussion
[image:5.486.86.408.250.413.2]482
Table 3 Variables at Baseline and Week 8 of the Training Group and the Control Group
Baseline test Week 8 test Body mass index
Training 25.4 ± 2.2 23.3 ± 2.1** †
Control 25.3 ± 2.3 25.3 ± 2.5
Sum of 3 skinfolds (mm)
Training 101.1 ± 10.8 95.5 ± 10.6*
Control 101.8 ± 10.8 103.6 ± 10.5*
Waist girth (cm)
Training 80.5 ± 7.1 79.0 ± 7.2*
Control 80.4 ± 7.1 81.7 ± 7.2
Cardiovascular fitness index
Training 23.9 ± 2.9 19.8 ± 3.5** †
Control 24.0 ± 2.2 23.7 ± 4.1
5-min run-walk (m)
Training 738 ± 77 792 ± 67** †
Control 736 ± 68 740 ± 71*
Standing long jump (cm)
Training 123 ± 8 131 ± 10** †
Control 122 ± 9 123 ± 10
Note. All data are presented in mean ± SD.
*p < 0.05; **p < 0.01 between the baseline and week 8 tests within the group
†p < 0.05 between the training group and the control group after eight weeks of interventions
Duration
(min) Repetition (times) time (min)Exercise
Energy expenditure rate (kCal/min)
Running (6.5km/h) 5 2 10 7.26 ± 1.22
Oblique push up (60times/
min) 1 4 4 4.08 ± 0.35
Squat (60times/min) 1 4 4 3.28 ± 0.31
Rope skipping (60times/min) 1 4 4 4.20 ± 0.17
Crawling 3 2 6 7.98 ± 0.32
Marching on the spot lifting
knee high (60times/min) 2 3 6 3.52 ± 1.02
Aerobic dancing 6 1 6 7.33 ± 0.28
[image:6.486.83.405.131.276.2] [image:6.486.84.406.335.602.2]of the training group decreased their BMI and skinfolds significantly after eight weeks of physical training. The control group, in contrast, had a significant increase in the sum of three skinfolds. The beneficial changes in BMI and skinfold following physical activity supported the outcomes of previous studies (9,12,19). In addition, the waist girth of our training subjects also had a significant decrease, which might indicate a decrease in the subcutaneous, as well as the visceral abdominal adipose tissues (6,15). The heart rate response to a certain workload exercise was also less following training. The calculation of HR index used in this study evaluated all resting, exercise, and recovery HR. This decrease in the index demonstrated an improvement in cardiovascular fitness, which meant the heart handled the workload as a relatively lighter physiological demand. A similar outcome has been reported in previous studies (5,6). We also found increases in running and jumping ability of the trained obese children. However the significant increase in the 5-min run-walk distance shown in the control subjects was indicative of the large measurement variation in such an endurance test. Despite this, the trained subjects obtained a much higher increase in the distance than that of the control subjects. Basically, our result suggested that controlling exercise intensity at the HR at LT is an effective option of training this group of children with obesity. The outcomes also supported the previous exercise training studies in which increased physical activities without any dietary intervention benefited obese children in their body composition and functional capacities (1,5,6,15).
There are many advantages in the training program of our study. The HR at LT gave a benchmark for the intensity of exercise training. The energy to perform exercise at or below this intensity comes mainly from aerobic metabolism (20). Therefore a large amount of energy might obtain through burning body fat in such exercise (2), which was one of the primary aims of exercise intervention for obese children. The measurements of energy expenditure in various physical activities showed that our subjects expended at least 200 kCal of energy in each session. In regard to the energy intake and expenditure measured at baseline, the subjects had achieved an energy balance five days per week for these eight weeks. In addition, exercise at this intensity was safe for obese children at 9–10 years old because no sport injuries occurred during the experimental period. Therefore, we can say that the training program used in this study had a safe training intensity and expended enough energy to produce benefits for the subjects.
We understand that the most important achievement of training, as well as preventing childhood obesity, is to teach children how to undertake effective physi-cal activities and gradually develop a long-term physiphysi-cally active lifestyle. Higher intensity exercise (say above the LT) may have led to a faster and larger amount of energy loss which, however, may not have engendered long term compliance. All activities involved in this study were performed at a submaximal intensity and did not cause severe physical fatigue, so the training sessions could be organized within the daily school timetable and not affect other educational processes. Furthermore as these activities were very easy to do, with minor supervision from their parents, children could continue the training by themselves in the future.
intensities. The HR at LT of this study (165beat/min) should be used as the exercise intensity only for obese children at 9–10 years old. The current results cannot be used to determine the LT of other age groups, though the lactate concentration at LT (2.8mmol/L) in this study was similar to those reported in the literature for boys of 11–12 years old (14). It may be difficult to apply the HR at LT in a large-scale prevention study because of the time and personnel needed to perform the testings; however this protocol should be recommended in the individualized treatment of childhood obesity. A lactate analyzer is commonly available and used in many human physiological laboratories. The physical training of this study only lasted eight weeks; a longer experimental period may produce further benefits. However, with simple physical activities, we recognize that children and their parents would continue training easily, which would help the children to develop a long-term physically active lifestyle.
Conclusion
The present study demonstrated that the physical program with exercise intensity determined by the HR at LT produced significant benefits on body composition and functional capacities of obese children at 9–10 years old. The outcome pro-vided the first-hand evidence to determine exercise intensity of physical training for children with obesity.
References
1. Barbeau, P., B. Gutin, M. Litaker, S. Owens, S. Riggs, and T. Okuyama. Correlations of individual differences in body-composition changes resulting from physical training in obese children. Am. J. Clin. Nutr. 69:705–711, 1999.
2. Brooks, G., and J. Mercier. Balance of carbohydrate and lipid utilization during exercise: the “crossover” concept. J. Appl. Physiol. 76:2253–2261, 1994.
3. Committee of Students’ Health and Fitness of Tianjin. China. Handbook of Standard
of Students’ Physical Fitness. Tianjin: Dalian Press, 2003.
4. Gutin, B., L. Ramsey, P. Barbeau, et al. Plasma leptin concentrations in obese children: changes during 4-mo periods with and without physical training. Am. J. Clin. Nutr. 69:388–394, 1999.
5. Gutin. B., P. Barbeau, M. Litaker, M. Ferguson, and S. Owens. Heart rate variability in obese children: relations to total body and visceral adiposity, and changes with physical training and detraining. Obes. Res. 8:12–19, 2000.
6. Gutin, B., P. Barbeau, S. Owens, et al. Effects of exercise intensity on cardiovascular fitness, total body composition, and visceral adiposity of obese adolescents. Am. J.
Clin. Nutr. 75:818–826, 2002.
7. Gutin, B., S. Riggs, S. Moorehead, M. Ferguson, and S. Owens. Description and pro-cess evaluation of a physical training program for obese children. Res. Q. Exerc. Sport. 60:1023–1027, 1999.
8. Hill, J.O., and H.R. Wyatt. Role of physical activity in preventing and treating obesity.
J. Appl. Physiol. 99:765–770, 2005.
9. Hills, A., and A. Parker. Obesity management via diet and exercise intervention. Child
Care Health Dev. 14:409–416, 1988.
11. McArdle, W.D., F.I. Katch, and V.L. Katch. Exercise Physiology: Energy, Nutrition,
and Human Performance. Philadelphia: Lippincott Williams & Wilkins, 2007. 12. Meyer, A., G. Kundt, U. Lenschow, P. Schuff-Werner, and W. Kienast. Improvement
of early vascular changes and cardiovascular risk factors in obese children after a six-month exercise program. J. Am. Coll. Cardiol. 48:1865–1870, 2006.
13. Miller, J., A. Rosenbloom, and J. Silverstein. Childhood obesity. J. Clin. Endocrinol.
Metab. 89:4211–4218, 2004.
14. Mocellin, R., M. Heusgen, and H.P. Gildein. Anaerobic threshold and maximal steady state blood lactate in prepubertal boys. Eur. J. Appl. Physiol. 62:56–60, 1991. 15. Owens, S., B. Gutin, J. Allison, et al. Effect of physical training on total and visceral
fat in obese children. Med. Sci. Sports Exerc. 31:143–148, 1999.
16. Pfitzinger, P., and P. Freedson. Blood lactate responses to exercise in children: Part 2. Lactate threshold. Pediatr. Exerc. Sci. 9:299–307, 1997.
17. Poderys, J., A. Buliuolis, K. Poderyte, and R. Sadzeciviene. Mobilization of cardiovas-cular function during the constant-load and all-out exercise tests. Medicina (Kaunas). 41:1048–1053.
18. Report of a Joint FAO/WHO/UNU Expert Consultation. Energy and protein
require-ments: World Health Organization Technical Report Series 724. World Health Orga-nization, Geneva 1985.
19. Savage, M., M. Petratis, W. Thomson, K. Berg, J. Smith, and S. Sady. Exercise training effects on serum lipids of prepubescent boys and adult men. Med. Sci. Sports Exerc. 18:197–204, 1986.
20. Svedahl, K., and B.R. MacIntosh. Anaerobic threshold: the concept and methods of measurement. Can. J. Appl. Physiol. 28: 299-323, 2003.2005.
21. Wasserman, K., W. Beaver, and B. Whipp. Mechanisms and pattern of blood lactate increase during exercise in man. Med. Sci. Sports Exerc. 18:344–352, 1986. 22. Watts, K., P. Beye, A. Siafarikas, et al. Effects of exercise training on vascular function
in obese children. J. Pediatr. 144:620–625, 2004.