Reducing teacher
workload
Southwark Teaching School Alliance
Research Report
March 2018
Contents
Table of figures 4
1. Research topic 5
1.1. Approaches to reducing workload 5
What influenced this intervention? 5
What was the nature of the intervention? 6
What support were schools given? 7
2. Evaluation methodology 8
2.1. Methodology 8
2.2. Participants 9
3. Findings 11
3.1. Perceptions of practice pre-intervention 11
3.2. Implementation 12
Practice across maths 12
Practice across writing 13
Types of marking practice 14
3.3. Progress in writing 15
3.4. Progress in maths 17
3.5. Teacher perceptions of impact on pupils 18
Overall impact on pupils 18
Impact on pupil progress 19
Evidence of impact 20
Overall effectiveness of marking methods 21
Effectiveness of methods across different types of learner 21
Pupil understanding of feedback 22
Pupil use of feedback 22
3.6. Impact on Teacher workload 24
Time spent on marking 24
Teacher perception of impact on workload 25
Time spent on marking as a proportion of overall workload 25
Time-effectiveness of current marking practice 26
Time-effectiveness of written marking 26
Flexibility of current marking practice 27
3.6 Future marking practice 28
Improvements to practice 28
4. School Culture 30
What cultural barriers may exist to prevent take up of new initiatives to reduce
workload? 30
Lesson structure and time. 30
Inability to use verbal methods to replace all written methods 30
5. Conclusion 31
Further areas of study 31
Appendix 1: Self- and peer-assessment models 32
Self and Peer Assessment in Maths 32
Self and Peer Assessment in Writing 32
Appendix 2 – Baseline survey 34
Table of figures
Chart 1: Levels of written feedback for maths ... 12
Chart 2: Levels of verbal feedback for maths ... 13
Chart 3: Levels of written feedback for writing ... 14
Chart 4: Levels of verbal feedback for writing ... 14
Chart 5: Progress in writing ... 16
Chart 6: Progress in maths ... 17
Chart 7: Impact on pupils: perceptions of intervention group ... 19
Chart 8: Intervention group: current practice enables student progress ... 19
Chart 9: I feel that my current marking practice is effective ... 21
Chart 10: Intervention group: current marking practices are effective across different types of learner ... 21
Chart 11: Intervention group: current marking practices motivate pupils ... 22
Chart 12: Intervention group: I am confident that pupils understand my feedback ... 22
Chart 13: Intervention group: I feel confident that pupils use my feedback to make improvements to their work ... 23
Chart 14: Control group: I feel confident that pupils use my feedback to make improvements to their work ... 23
Chart 15: If you have made a partial or significant change, how has this affected your workload? ... 25
Chart 16: Intervention group: I feel that the time I spend on marking/providing feedback to individual pupils is proportionate to my overall workload ... 26
Chart 17: Intervention group: I feel that my current marking practice is time-effective ... 26
Chart 18: Intervention group: I feel confident that the time spent on written marking is worthwhile in terms of impact on pupil outcomes ... 27
Chart 19: Intervention group: I feel that my current marking practice is flexible ... 27
Chart 20: Intervention group: I would like to continue with my current marking practice .. 28
1. Research topic
In 2014, the government published the results of the teacher Workload Challenge survey, which revealed that excessive and in-depth marking was a key professional burden for many teachers. In September 2016, the National College of Teaching and Leadership invited schools and groups of schools to apply for funding to conduct research into effective marking practices. Southwark Teaching School Alliance was successful in its application and from January to June 2017, the Alliance (TSA) spent one full school term trialling an intervention that focused on verbal, as opposed to written, feedback in order to evaluate the impact of the method on overall teacher workload and student learning outcomes. This trial was evaluated in collaboration with UCL Institute of Education (IoE).
1.1.
Approaches to reducing workload
What influenced this intervention?
The intervention was designed and administered by Jemima Rhys-Evans from Charles Dickens Primary School and Sarah Field from John Donne Primary School, in response to the Teacher Workload Review Group report1, the EEF review2 and as a result of visits and conversations with ‘no-marking’ schools.
The reports chimed with their experience that teachers’ time was better spent planning meaningful next steps for children – either re-teaching, consolidating or extending their learning – and not working through piles of books giving feedback that children often either ignored, could not read or did not understand. A reduction in teacher workload was the starting point but the alliance also wanted to look at making teacher workload
purposeful.
Although the alliance believed that there was still a place for written marking, they wanted to think hard about which form of feedback was appropriate for which piece of work
and/or which child. It was felt that moving from one end of the spectrum (everything marked in detail) to another (nothing marked by the teacher at all) would help to clarify in teachers’ minds the purposes of their feedback: Is this the most effective way of moving the children’s learning on? If not, what is the purpose of continuing with it? Is the marking and feedback meaningful to pupils?
The alliance also wanted to help children to become more active participants in their learning by giving them the skills to assess their own work and to determine what they needed to do next, rather than being passive recipients of teacher wisdom. Teachers
1 Eliminating unnecessary workload around planning and teaching resources, Report of the Independent
Teacher Workload Review Group. DFE, London, 2016
wanted feedback to be motivating and in order to achieve this; they wanted to involve children more actively.
What was the nature of the intervention?
The intervention spanned four full months, starting at the end of February 2017 and ending in late June 2017. This gave teachers six weeks between a training day and the commencement of the intervention to develop their classroom cultures, and teach the `
o Meaningful: If pupils were able to spot and iron out minor slips and errors in advance of the teachers seeing their work, teacher feedback could be more tightly focused on how to improve their work (in writing) or addressing genuine misconceptions (in maths).
o Motivating: Peer and self-marking within a lesson enabled children to receive immediate feedback on how they had done and was therefore more motivating than delayed marking.
o Manageable: The marking burden on teachers would be reduced if more of pupils’ work was self- or peer-assessed and/or teachers marked during lessons.
• To this end, teachers would conference with the groups identified by an analysis of
the previous day’s learning outcomes and use the next day’s lesson to go over the feedback points and provide children with the time to put this feedback into effect. The expectation was for each child to be conferenced with at least once a week. Alongside this, teachers developed children’s abilities to peer and self-assess their work. The aim of this was to reduce time required for teacher marking, to develop children’s metacognitive skills, and to provide more immediate feedback. Although most schools in the project already used peer and self-marking strategies,
Southwark TSA3 report that none were confident that it was either meaningful or motivating. Therefore, in their initial training and launch day, they looked at developing strategies to improve children’s abilities to assess and establishing a culture of using error in the classroom to the benefit of learning. Further
information on the nature of peer and self-assessment used in this intervention can be found in appendix 1.
• Step 4: Support the process through efficient record keeping. The expectation was
for teachers to keep records of what each child needed to do next and when they had been conferenced with, to ensure that all children were receiving the support that they needed. No prescribed method for this was dictated but teachers tended to record feedback conversations between teachers and children, or between
children and their peers, using stickers in their books. There were three different stickers to record these conversations:
o I spoke to my teacher and I need to …
o I spoke to my friend and I need to…
o I have checked my own work and I think I need to…
These were designed to remind both children and adults what the feedback points were and to monitor peer and self-assessment.
What support were schools given?
2. Evaluation methodology
The evaluation was based on a small-scale trial that compared the outcomes for pupils and teachers who took part in the intervention against those who did not (a control group).
2.1.
Methodology
The study looked at impact in terms of maths and writing assessment results, as well as teacher reported practice and self-evaluation. It consisted of:
• a start-point and end-point survey of teachers from both the intervention and
control groups to record their marking practice prior to and during the intervention and their views of their own practices
• comparison of results from GL Assessment’s Progress Tests in Maths in both
December 2016 and June 2017 to review student progress in maths across the term
• comparison of school-collected writing assessment data in both December 2016 and June 2017 to review student progress in writing across the term.
Student background data was also collected in order to make comparisons by characteristics such as ethnicity, Special Educational Needs and Disability (SEND), English as an Additional Language (EAL) and eligibility for Pupil Premium funding. However, given that fewer schools participated than was originally planned, analysis of the assessment data by pupil characteristic was not statistically viable.
The GL assessment end-point data was returned with a progress measure which assigned pupils to categories demarking their level of progress in respect to expected levels (‘much higher than expected’, ‘higher than expected’, ‘as expected’, ‘lower than expected’ and ‘much lower than expected’). The literacy data was recorded as a categorical ’score’ which assigned a ‘status’ to each pupil (e.g. ‘towards expected’, ‘at expected’ and so on) at the start and end of the intervention. Since these were not
common across schools, the categories were mapped against one another in agreement with the participating schools. In addition, teachers spent time moderating writing across schools to create some common understanding of ‘Expected’, ‘Exceeding’ and ‘Working Towards’ or whichever terminology was being used by participating schools.
Key points
• The was a small scale quantitative study which collected maths and writing data
2.2.
Participants
[image:9.595.48.536.524.681.2]The project involved four primary schools across Southwark Teaching School Alliance. Nine schools (seven primaries and two secondaries) were initially recruited and attended the launch and training day. However, two primaries dropped out before the intervention began, both due to external factors associated with the timing of the project. A further school dropped out during the intervention; anecdotal evidence from Southwark TSA suggests that their lack of engagement was related to the administrative burden of participating in a study (e.g. returning data4) and an absence of ‘buy-in’ which came about through missing the initial launch day. The secondary schools decided not to take part as they felt that it would be hard to implement just for one or two teachers in their settings and would need to be part of a wider department, key stage or whole school initiative.
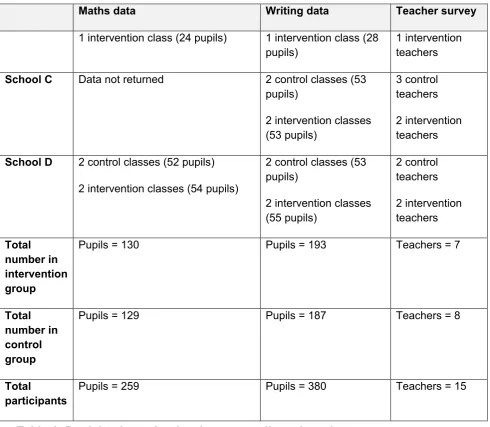
Table 1 below shows the number of intervention and control classes that took part in each of the four schools as well as the number of participating pupils and teachers.
Maths data Writing data Teacher survey
School A 2 control classes (51 pupils)
2 intervention classes (52 pupils)
2 control classes (52 pupils)
2 intervention classes (57 pupils)
2 control teachers
2 intervention teachers
School B 1 control class (26 pupils) 1 control class (29
pupils) 1 control teachers
4 Southwark TSA report that all teachers found the maths data collection onerous owing to the complexity of the online upload system and the amount of electronic data required to set up the basic templates. Data from the fourth school was unfortunately misplaced by GL assessment and thus not included in the analysis.
Key points
• Four primary schools took part in the study; three returned maths data and all
returned writing data.
• Each school had at least one intervention class and one control class take part, and in total, 15 classes took part in the study.
• Data from 259 pupils were returned for maths and 380 pupils for writing.
Maths data Writing data Teacher survey
1 intervention class (24 pupils) 1 intervention class (28
pupils) 1 intervention teachers
School C Data not returned 2 control classes (53 pupils)
2 intervention classes (53 pupils)
3 control teachers
2 intervention teachers
School D 2 control classes (52 pupils)
2 intervention classes (54 pupils)
2 control classes (53 pupils)
2 intervention classes (55 pupils)
2 control teachers
2 intervention teachers
Total number in intervention group
Pupils = 130 Pupils = 193 Teachers = 7
Total number in control group
Pupils = 129 Pupils = 187 Teachers = 8
Total
[image:10.595.43.534.53.480.2]participants Pupils = 259 Pupils = 380 Teachers = 15
Table 1: Participating schools, classes, pupils and teachers.
3. Findings
Prior to reporting the outcomes of this intervention, it is important to describe a little more about how the teachers implemented the changes in reality as this provides the true context for the findings.
3.1.
Perceptions of practice pre-intervention
Teachers in the intervention group:
• were less likely than those in the control group to have taught for more than ten years (true of one teacher in the intervention group compared to half the control group)
• were less likely than those in the control group to agree that their marking practice was effective and that it enables pupils to progress
• were slightly less likely than the control group to agree that they wanted to
continue with their current marking practice (however, only two in the control group agreed with this)
• agreed more strongly than those in the control group that their practice needed
improvement.
The majority in both groups disagreed that their current marking practice was time effective and that it was effective across all types of learners. Few wanted to continue with their current marking practice (just two in the control group agreed that they did).
The profile of those in the intervention group is important as it suggests that there was some level of self-selection for the intervention. This can be a risk in control trials as those organising the study within schools can rely to some extent on good will to recruit teachers to the intervention; those who see their practice as less effective and/or have more years ahead of them in the teaching profession may be more open to change and more likely to agree to take part.
Key points
• The teachers in the intervention group were less satisfied with their current
3.2.
Implementation
In terms of perceptions, all in the intervention group felt they had made a ‘significant’ change to their practice over the term. However, it is also important to note that some in the control group felt they made a ‘partial’ change to their practice. This is described in more detail below.
Practice across maths
Chart 1 below shows how those in the intervention group were providing written feedback for maths in all or most pieces of work pre-intervention (note that on the charts in this section of the report the y-axis is the number of teachers while the x-axis indicates the proportion of pieces of work). Throughout the intervention, they were providing it in few or no pieces of work. However, we also see a slight reduction in the levels of written
feedback given by the control group teachers.
Chart 1: Levels of written feedback for maths
Chart 2 below shows that both control and intervention groups enhanced the level of verbal feedback given for pieces of work in maths, which suggests there may have been some contamination with those in the control group picking up on the practice of the
0 2 4 6
Missing All Most
Pre-intervention written feedback: maths
Control group Intervention
0 2 4 6
Throughout intervention written feedback: maths
Control group Intervention
Key points
• All teachers in the intervention group felt they had made a ‘significant’ change to
their practice over the term, reducing written methods to zero and providing verbal feedback on all or most pieces of work.
• Some in the control group felt they made a ‘partial’ change to their practice; half reported that they had increased levels of verbal feedback throughout the study (although this may have been fairly insubstantial compared to that of the
intervention group) which suggests a small amount of ‘contamination’ of the study.
intervention group. For example, four of the eight control group teachers went from providing verbal feedback in maths on some or few pieces of work to most pieces of work. This pattern was across schools. All four admitted they had made a ‘partial’ change to their practice (with three specifying that they had introduced more verbal marking methods). However, this increase may have been insubstantial given that reported hours spent on verbal marking did not show an increase for the control group in the post
intervention survey.
It’s also important to note that two teachers from the intervention group (from school D) maintained previous lower levels of verbal feedback while reducing written feedback.This is discussed in more detail later in the report.
Chart 2: Levels of verbal feedback for maths
Practice across writing
Chart 3 below shows how those in the intervention group were providing written feedback for writing in all or most pieces of work pre-intervention. Throughout the intervention, they were providing it in few or no pieces of work. However, we also see a slight reduction in the level of written marking for those in the control group (but not to the same levels as were seen for maths).
0 2 4 6
Missing Some Few
Pre-intervention verbal feedback: maths
Control group Intervention
0 2 4 6
All Most Some Missing
Throughout intervention verbal feedback: maths
Chart 3: Levels of written feedback for writing
Chart 4 below shows that the intervention group enhanced the level of verbal feedback given for pieces of work in writing, while the control group reduced it slightly.
Chart 4: Levels of verbal feedback for writing
Types of marking practice
The intervention group much reduced the degree to which they used the following written methods:
• correcting or indicating mistakes on pupils’ work,
• modelling improvements,
• writing praise on work,
• writing a qualitative/descriptive phrase on work (e.g. 'excellent'),
• giving time in class for pupils to respond to written comments,
• writing targets for future work,
• referring to success criteria.
Instead, many of these were now done verbally.
Verbal methods also appeared to give greater opportunity to comment on the way the work was planned and completed and offered opportunity for pupils to assess each other’s own work. The control group continued to employ most of these written methods but also stated that the regularly employed many of the verbal methods too.
0 2 4 6
Missing All Most
Pre-intervention written feedback: writing
Control group Intervention
0 2 4 6
Most Some Few None Missing
Throughout intervention written feedback: writing
Control group Intervention
0 1 2 3 4 5
Most Some Few Missing
Pre-intervention verbal feedback: writing
Control group Intervention
0 1 2 3 4 5
All Most Some
Throughout intervention verbal feedback: writing
3.3.
Progress in writing
Pupil progress in marking was calculated by using data provided by their teachers about their level in December and then again in July. Figure 1 below shows the categories used by one of the schools to ‘score’ the current status of each pupil5. The researchers
[image:15.595.84.505.492.722.2]assigned a progress score to each pupil based on how many category ‘improvements’ they had made from the start of the term to the end. The proportions of pupils assigned to each progress category was found to be similar prior to the intervention taking place, which showed that the two groups were fairly evenly matched.
Figure 1: Writing progress categories used in school D
Chart 5 below shows the proportion of pupils who made each number of ‘category
improvements’ in both the intervention and the control groups. Note that for this chart the y-axis is the proportion of pupils while the x-axis indicates the number of ‘category’ improvements that the pupils made.
5 Each school used a different set of categories so these were mapped to combine the data (see appendix 3 for further information)
Below expected expectedTowards At expected Exceeding expected
6%
21%
57%
15%
1% 4%
22%
63%
7%
2% 2%
0% 10% 20% 30% 40% 50% 60% 70%
0 1 2 3 4 5
Control Intervention
Key points
Chart 5: Progress in writing
While slight variances can be seen in chart 5 above, there was no real contrast in the data for the control and intervention groups once tested for significance. More
specifically, largely similar proportions of pupils in the intervention and control groups:
• maintained their current level of progress (denoted by 0 in the chart); 4% in the intervention group and 6% in the control group
• made marginal or good progress (denoted by 1 and 2 progress categories in the chart); 85% in the intervention group and 78% in the control group.
• made exceptional progress (denoted by 3, 4 and 5 progress categories in the chart); 11% in the intervention group and 16% in the control group.
Progress in maths
For maths, assessments were undertaken and the data returned to GL assessment who provided a standard age-related score for each pupil and a measure of progress between the two tests. The categories are shown in chart 6 below. Note that for this chart the y-axis is the proportion of pupils while the x-y-axis indicates the progress score.
Chart 6: Progress in maths
While slight variances can be seen in chart 2 above, there was no real contrast in the data for the control and intervention groups once tested for significance. Similar
proportions of pupils in the intervention and control groups exist in each progress category. There was, of course, variance between classes within and between schools but this was not linked to the intervention. Again, it is important to note the relatively short duration of this intervention and the limitations this may have imposed on making and measuring impact.
It is important to remind ourselves that this intervention took place over one school term and it therefore had a relatively short length of time to make an impact. However, we can conclude that over a school term this method has not had a measurable detrimental impact on student progress.
5%
16%
53%
18%
9% 8%
18%
52%
12%
9%
0% 10% 20% 30% 40% 50% 60%
Much lower than
expected Lower than expected Expected Higher than expected Much higher thanexpected
Control Intervention
Key points
• Across the term, overall, the intervention had no measurable positive or negative
3.4.
Teacher perceptions of impact on pupils
Overall impact on pupils
Chart 7 below shows that five of the teachers in the intervention group felt that their change in practice had had a positive impact on pupils. Note that on the charts in this section the y-axis is the number of teachers while the x-axis indicates their response. Two felt it had a negative impact and said that their pupils had made lower than expected progress during the term.
Of those in the control group, two of the three that had introduced more verbal methods thought it had made a small positive difference to pupils. The third said it made no difference.
Key points
• Five of the seven teachers in the intervention group were more likely to agree
post-intervention than pre-intervention that:
o the change in marking practice had a positive impact on their pupils and their levels of progress
o their current marking practice is more effective post-intervention than it was pre-intervention
o their current marking methods were more effective across different types of learner than they were pre-intervention
o their current marking practices motivate pupils
o they were confident that pupils understand their feedback.
Chart 7: Impact on pupils: perceptions of intervention group
Impact on pupil progress
Those who took part in the intervention were more likely to agree, post-intervention, that their practice had a positive impact on student progress (as shown in chart 8 below). Two teachers from school D disagreed.
Chart 8: Intervention group: current practice enables student progress
The two teachers who perceived the impact on pupils to be negative were from the same school (school D) and had not implemented verbal methods as extensively as the other teachers in the group, although their perception was that they had made a ‘significant’ change to their practice. While they had reduced written methods to the same extent as other teachers in the group, they had only started to deliver verbal methods on ‘some’ pieces of work in both maths and writing (while most others had delivered them in ‘most’ or ‘all’ pieces of work). One suggested that this was due to time and the capacity of pupils to take on board verbal feedback about multiple areas of the work. This does suggest that their pupils may have been in receipt of less feedback overall than before the intervention.
When we review the writing data for these two classes we find that a good proportion of the pupils made expected levels of progress in writing and a fair proportion (compared to the average for the whole group) made exceptional progress. However, a higher
0 1 2 3 4
Made a significant
positive difference
Made a small positive difference
Made no
difference Made a smallnegative difference
Made a large negative difference
0 1 2 3 4 5
Strongly agree Agree Disagree Neutral
proportion of pupils in the control group in this school than in the intervention group did indeed make exceptional progress.
In terms of the maths data for these classes, we find that one intervention class had in fact made the most progress of all the classes in the intervention group (with 34% making higher or much higher progress than expected compared to 21% of all in the intervention group), whilst the other intervention class had made progress on a par with the rest of the group and with the control classes within the same school.
The data suggests that the two teachers behaved differently to the other teachers in intervention classes, which may have affected the outcomes for writing; it would seem that volume of feedback is still a key factor and this is particularly relevant to writing. One of these teachers explained the limitations of reducing the volume of feedback:
Now, I only manage to verbally feedback one target at a time, being as they cannot process too many things at once. This never includes detailed spelling corrections and technical errors to slowly improve the quality of their work.
Evidence of impact
When asked for evidence of impact on pupil learning, respondents provided examples of how the behaviour and competencies of pupils or themselves had changed.
Evidence of
impact on
Children will ask for
feedback more
Some children have begun to edit/self-correct
writing
Progress is higher in this
academic year than it was last year As I was more
aware of how children were progressing, I could group them in the appropriate guided groups
Children's comments relating to their
understanding of the feedback
given.
Children are making
progress Assessment is
easier for me as I am able to discuss the learning with the
children to clearly understand where they need support or
extra challenge. The children are
now independent evaluators and
Figure 2: Teacher evidence of impact
Overall effectiveness of marking methods
Those in the intervention group were more likely to agree that their current marking practice is effective post-intervention than they were pre-intervention (see chart 9 below). All but two (from school D) agreed that their practice was now effective.
Interestingly, those in the control group showed less satisfaction with their marking methods post intervention. It is possible that involvement in the study and even discussions with teachers in the intervention group had led to further reflection.
Chart 9: I feel that my current marking practice is effective
Effectiveness of methods across different types of learner
Post intervention, teachers who took part were more likely to agree (thanpre-intervention) that their current marking methods were effective across different types of learner (see chart 10 below). The two teachers who disagreed were from school D.
Chart 10: Intervention group: current marking practices are effective across different types of learner
0 1 2 3 4
Strongly
agree Agree Neutral Disagree Missingresponse
Control group
Pre-intervention Post-intervention
0 1 2 3 4
Strongly
agree Agree Neutral Disagree
Intervention group
Pre-intervention Post-intervention
0 1 2 3 4 5
Motivating pupils
Teachers in the intervention group were more likely to agree post-intervention that their current marking practices motivate pupils (see chart 11 below). The two teachers who disagreed were from school D.
Chart 11: Intervention group: current marking practices motivate pupils
Pupil understanding of feedback
Teachers were more confident post-intervention that pupils understand their feedback (see chart 12 below).
Chart 12: Intervention group: I am confident that pupils understand my feedback
Pupil use of feedback
Those in the intervention group responded in relatively the same way when asked about their confidence in pupils using their feedback pre- and post-intervention (see chart 13 below).
0 0.51 1.52 2.53 3.54 4.55
Strongly
agree Agree Neutral Disagree disagreeStrongly Pre-intervention Post-intervention
0 1 2 3 4
Strongly
agree Agree Neutral Disagree disagreeStrongly
Chart 13: Intervention group: I feel confident that pupils use my feedback to make improvements to their work
Interestingly, those in the control group displayed slightly less confidence in this aspect of their marking, providing further suggestion that they had reviewed their practice as a side-effect of the study (see chart 14 below).
Chart 14: Control group: I feel confident that pupils use my feedback to make improvements to their work
0 1 2 3 4
Strongly
agree Agree Neutral Disagree Stronglydisagree Missing
Pre-intervention Post-intervention
0 1 2 3 4
Strongly
agree Agree Neutral Disagree Stronglydisagree Missing
3.5.
Impact on Teacher workload
Time spent on marking
[image:24.595.56.533.518.670.2]As noted earlier in the section on implementation we know that some in the control group increased levels of verbal feedback alongside those in the intervention group. They also reported higher levels of verbal feedback pre-intervention than the intervention group. Both patterns can be seen in tables 2 and 3 below, which demonstrate the average number of hours used across an average week for written and verbal feedback.
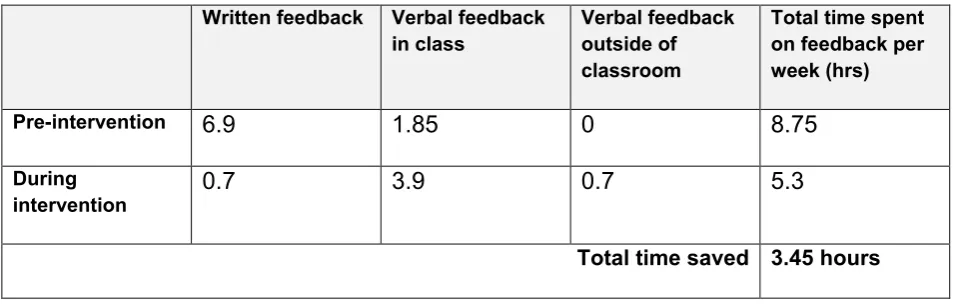
Table 2 below shows that the intervention group decreased levels of written feedback and increased levels of verbal feedback. This saved them on average 3.45 hours a week (around half a day’s work).
Written feedback Verbal feedback
in class Verbal feedback outside of classroom
Total time spent on feedback per week (hrs) Pre-intervention 6.9 1.85 0 8.75 During
intervention 0.7 3.9 0.7 5.3
Total time saved 3.45 hours
Table 2: Average number of hours spent on marking by teachers in the intervention group
The control group slightly reduced levels of written feedback and largely maintained levels of verbal feedback. Therefore, there was a slight net difference in time spent, with their workload reduced by 1.8 hours (see table 3 below). It is interesting that the control group report a higher average number of hours spent on verbal marking pre-intervention. Given that this does not tally with other data about the level of verbal marking methods
Key points
• Teachers in the intervention group saved an average of 3.45 hours a week by replacing written methods with verbal ones.
• Four of the seven teachers in the intervention group said the change of methods had made a significant positive difference to their workload, and three felt it made a small positive difference.
• All were more likely to agree post-intervention (than pre-intervention) that: o the time spent on marking was proportionate to their overall workload
o their marking practice was time effective
used (see section on implementation) it could be that those in the control groups over-estimated the number of hours applied to this method and is skewed somewhat by one teacher reporting that they use 15 hours per week on verbal feedback pre-intervention.
Written feedback Verbal feedback
in class Verbal feedback outside of classroom
Total time spent on feedback per week (hrs) Pre-intervention 6.5 3 0.8 10.3 During
intervention 5.2 3 0.3 8.5
[image:25.595.131.457.449.628.2]Total time saved 1.8 hours
Table 3: Average number of hours spent on marking by teachers in the control group
Teacher perception of impact on workload
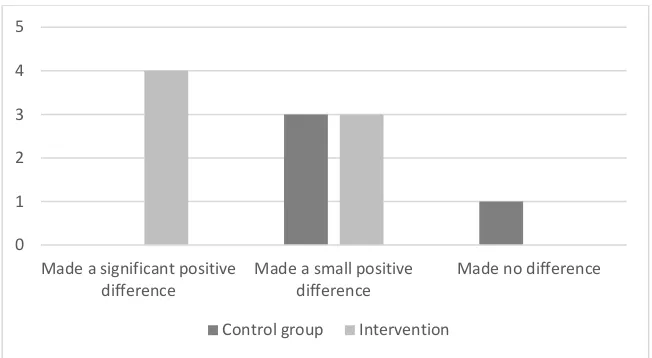
All in the intervention group told us that they had made a significant change to their practice; four of whom said it made a significant positive difference to their workload, and three felt it made a small positive difference (see chart 15 below).
Four teachers in the control group said that they had made a partial difference to their practice. Of those, three had increased verbal marking, two of which thought it had made a small positive difference to their workload, one felt it made no difference.
Chart 15: If you have made a partial or significant change, how has this affected your workload?
Time spent on marking as a proportion of overall workload
Post intervention those in the intervention group were more likely to agree (than they were pre-intervention) that the time spent on marking is proportionate to their overall workload (see chart 16 below). The views of those in the control group remained largely unchanged throughout the intervention.
0 1 2 3 4 5
Made a significant positive
difference Made a small positivedifference Made no difference
Chart 16: Intervention group: I feel that the time I spend on marking/providing feedback to individual pupils is proportionate to my overall workload
Time-effectiveness of current marking practice
Teachers in the intervention group were more likely to agree, post-intervention, that their marking practice was time-effective (see chart 17 below). The views of those in the control group remained largely unchanged throughout the intervention.
Chart 17: Intervention group: I feel that my current marking practice is time-effective
Time-effectiveness of written marking
Post-intervention those in the intervention group had more confidence that the time spent on written marking is worthwhile in terms of impact on pupil outcomes (see chart 18 below). Two in the control group who had introduced more verbal methods also now agreed with this statement but the remainder remained negative.
0 1 2 3 4 5
Strongly
agree Agree Neutral Disagree disagreeStrongly
Pre-intervention Post-intervention
0 1 2 3 4 5
Strongly
agree Agree Neutral Disagree disagreeStrongly
Chart 18: Intervention group: I feel confident that the time spent on written marking is worthwhile in terms of impact on pupil outcomes
The majority of teachers in the intervention group explained that the majority of marking was now done in class time and that this freed-up time outside of the classroom to review where each pupil is at in terms of their learning and to prepare for future classes.
Flexibility of current marking practice
Teachers in the intervention group were more likely to agree that their marking practice is flexible post intervention (see chart 19 below). The views of those in the control group remained largely unchanged throughout the intervention.
Chart 19: Intervention group: I feel that my current marking practice is flexible
0 2 4 6
Strongly
agree Agree Neutral Disagree Stronglydisagree
Pre-intervention Post-intervention
0 1 2 3 4
Strongly
agree Agree Neutral Disagree disagreeStrongly
3.6 Future marking practice
Teachers who took part in the intervention were more likely to agree post-intervention (than they were pre-intervention) that they would like to continue with their current
marking practice (see chart 20 below). The two teachers who disagreed were from school D. The views of those in the control group remained largely unchanged throughout the intervention and overall, they were likely to disagree with the statement.
Chart 20: Intervention group: I would like to continue with my current marking practice
Improvements to practice
Following the intervention, those who took part agreed less strongly that their marking practice required improvement. Given their positive outlook on the impact their revised methods have had on both pupil progress and their own workload it is interesting to see that they still see further room for improvement (see chart 21 below).
0 1 2 3 4 5
Strongly
agree Agree Neutral Disagree disagreeStrongly
Pre-intervention Post-intervention
Key points
• Teachers who took part in the intervention were more likely to agree post-intervention (than they were pre-post-intervention) that they would like to continue with their current marking practice. They also agreed less strongly than before that their marking practice required improvement.
• Teachers in the intervention group would like to see a combination of written and
Chart 21: Intervention group: I feel that my current marking practice could be improved
When those in the intervention group were asked how they would like to improve their future practice:
• Four said they would like to combine written and verbal methods and that more thought should be given to which is most appropriate for different tasks
• Four would like to introduce new methods for supporting verbal methods such as assessment books, better integration of self and peer assessment, using TAs to free up teacher time for verbal feedback, or allocating one lesson a week to conferencing/verbal feedback.
In terms of support from their school, teachers would like:
• training on ‘growth mindset’ and effective peer and self-assessment
• time allocated within the school day to conferencing or allocation of additional staff to support this.
• modelling of the change in practice
• the use of stickers across the school as a self/peer assessment feedback tool
• of those in the control group, two asked for further training on how to implement verbal methods while three asked for less scrutiny of teachers’ marking.
0 1 2 3 4 5 6 7
Strongly
agree Agree Neutral Disagree Stronglydisagree responsesMissing
4. School Culture
What cultural barriers may exist to prevent take up of new
initiatives to reduce workload?
Lesson structure and time.
Staff at Southwark TSA report that one of the greatest challenges in the project was for teachers to find time in the day to conference with pupils. This was particularly difficult for those teachers without any support staff. Some teachers used the ‘soft-start’ from 8:45 – 9:05 as children arrived for the day, but before lessons. Some used a slot at the end of the day during which a teaching assistant could read a story to some children whilst the teacher conferenced with others.
How could this be overcome?
Southwark TSA report that the most successful and sustainable way to find time for this conferencing and verbal feedback was to change the structure and length of each lesson, moving away from the traditional 3-parter. Instead, the lesson would start with whole class or small group feedback, move into new learning and application and then mid-lesson or end-of-mid-lesson review points to address any common misconceptions. Additionally, the teacher would circulate throughout the lesson giving constant verbal feedback. Teachers themselves suggest allocating one lesson per week to conferencing and verbal feedback.
Inability to use verbal methods to replace all written methods
Staff at Southwark TSA said that teachers reported feeling frustrated by not being able to write in books. Teachers wanted to be able to correct a child’s work within the lesson, either by giving a written model or by simply correcting a spelling error. However, none reported subverting the intervention nor was any evidence seen of this at book-sharing sessions.
How could this be overcome?
5. Conclusion
The data suggests that reducing written feedback methods and replacing some with verbal methods will not have an adverse effect on pupil progress in maths and writing at the primary level. It would also appear to save teacher time and, therefore reduce their workload.
The new approach to marking was very popular amongst the intervention group but they recognised that it may not be appropriate to replace all written methods with verbal ones, with a particular focus on the value of in-class written feedback. Indeed, teacher
feedback suggests that careful consideration needs to be given to the combination, volume and nature of the marking methods so that pupils receive the correct level and type of feedback.
Agreeing the correct combination and approach at a school level may help to promote a shared understanding of their usage and perhaps facilitate less need to evidence their use (since this may present more of a challenge for verbal methods).
Furthermore, it is clear that the training and a period of transition supported the successful implementation of this new method and it is recommended that schools seeking to mirror the intervention ensure they adhere to this introductory stage. Schools will also need support to ensure that teachers have the time or capacity to cover both lesson content and verbal feedback within the structure of the school day.
It would appear that many teachers would support a change to current marking methods and that more evidence collated on the verbal approach to feedback would be invaluable in promoting a method which would appear to save teachers substantial time.
Further areas of study
It would be interesting to see how pupils perceive the verbal method and to explore and measure, not just the impact on student assessment outcomes, but also the impact on pupils’ self-reported efficacy, motivation, and understanding. This may help to better test, measure and understand the ‘mechanism’ at play beneath the outcomes.
Furthermore, in order to increase confidence in the findings, the same study would ideally be tested over a longer period of time and with a larger sample of pupils. A larger sample would make it possible to identify any contrasts in the data associated with pupil
characteristics (e.g. SEN or FSM) and thus determine who, if anyone, benefits most from verbal feedback methods.
Appendix 1: Self- and peer-assessment models
Southwark TSA provided the following descriptionsSelf and Peer Assessment in Maths
In maths, children were given the answers to problems towards the end of the lesson, either as sheets on a table, at a marking station elsewhere in the classroom or displayed on a board. Most children, especially the younger ones, needed to be taught or at least reminded how to tick neatly in their own and others’ books and whether a cross or a dot should be used to indicate an error. Some used the answer sheets earlier on in the lesson to check that they were on the right lines before continuing. Where they had not grasped the concept being taught, they were able to receive adult or peer support
immediately. If they had made minor slips in calculations, they could correct these. If they had got the majority of the work correct, they could continue and then move on to an extension activity. Self and peer-marking of more open-ended problem solving presented more of a challenge as there was often no one correct answer. Different teachers found different ways of resolving this: by building in time at the end of a lesson for children and groups of children to compare their answers and pick apart differences or by asking children to give a short presentation at the end of the lesson on their findings and the teacher and other children to give spoken feedback.
Self and peer marking in maths within the lesson meant that at the end of the day it was the work of a matter of minutes for a teacher to see exactly what each child in the class needed to do next.
Self and Peer Assessment in Writing
The above method was also possible for writing where the task was fairly closed: teaching a specific writing skill, for example. For more open writing tasks, individual targets and scaffolded success criteria enabled children to self and peer-assess their own work.
In the six weeks before the intervention began, children were taught explicitly how to use these to assess the effectiveness of a piece of writing and this required a lot of modelling.
Some children also struggled to generate meaningful feedback for themselves and their peers, even with reference to the success criteria. To help them with this, they were initially given a choice of three options. For example, in a Year 1 class these might be:
• Next time, I will remember finger spaces. • Next time, I will use capital letters for names. • Next time, I will use a noun phrase.
Appendix 2 – Baseline survey
Southwark TSA: Marking and feedback project
Welcome to our survey
Southwark Teaching School Alliance (TSA) is undertaking a project to research the impact of revised marking methods. To assist with this, UCL Institute of Education (IoE) is carrying out an independent evaluation. Twelve teachers from six schools will take part in the study using revised techniques and the results will be compared to a control group of 12 teachers using existing methods.
This survey is designed to collect information about the marking methods you and your school currently employ. All of the information you provide will be completely confidential and all reporting of the survey data will be anonymised.
Thank you for agreeing to take part. This survey will take about 10 minutes to complete. We will ask you to complete a similar survey at the end of the project and so it is important that you include your name and school so we can compare your responses.
Please note: Where this survey asks about marking, this refers to marking of written work completed by individual students in class, as homework or formal assessments
About you
1. Full name (for tracking purposes only)
2. School name
3. As part of this study:
o I have been asked to change my marking practice (I am part of the ‘intervention’ group)
o I have been asked to make NO changes to my marking practice (I am part of the ‘control’ group)
o I’m not sure if either statement applies to me.
5. Years spent teaching:
o 1-4
o 5-9
o 10-14
o 15-19
o 20 or more
Marking methods employed
6. For maths, how much do you:
All pieces of
work Most pieces of work Some pieces of work Few pieces of work No pieces of work Provide written
feedback to individual students?
□ □ □ □ □
Provide verbal feedback to individual students?
□ □ □ □ □
7. For literacy, how much do you:
All pieces of
work Most pieces of work Some pieces of work Few pieces of work No pieces of work Provide written
feedback to individual students?
□ □ □ □ □
Provide verbal feedback to individual students?
□ □ □ □ □
8. Over the last week, please add up how much time was spent either in school or at home marking maths and literacy work using WRITTEN methods?
9. Was this:
o More than an average week
o Less than an average week
o The same as an average week?
10. Based on this, please indicate the number of hours for an average week
(NB: please specify in hours, e.g. 1.25 for 1 hour 15 mins., 2.5 for 2 hours 30 mins. etc)
11. Over the last week, please add up how much time was spent in class providing VERBAL feedback to individual students or small groups?
(NB: please specify in hours, e.g. 1.25 for 1 hour 15 mins., 2.5 for 2 hours 30 mins. etc)
12. Was this:
o More than an average week
o Less than an average week
o The same as an average week?
13. Based on this, please indicate the numbers of hours for an average week
(NB: please specify in hours, e.g. 1.25 for 1 hour 15 mins., 2.5 for 2 hours 30 mins. etc)
14. Over the last week, please add up how much time was spent outside of class providing VERBAL feedback to individual students or small groups?
15. Was this:
o More than an average week
o Less than an average week
o The same as an average week?
16. Based on this, please indicate the numbers of hours for an average week
(NB: please specify in hours, e.g. 1.25 for 1 hour 15 mins., 2.5 for 2 hours 30 mins. etc)
Type of feedback employed
17. How much, if at all, do you use the following WRITTEN marking practices in relation to work produced by individual students?
Regularly Sometimes Never
Putting a mark or grade on work (e.g.
A, 7/10) □ □ □
Correcting mistakes on student’s work
□ □ □
Indicating mistakes on students’ work but not correcting them
Modelling improvements for a section of the work but not the whole piece of
work □ □ □
Writing praise on a student’s work
□ □ □
Writing a qualitative/descriptive comment about the work e.g.
‘Excellent’ □ □ □
Giving students time in class to respond to or address previous
written marking comments □ □ □
Writing a response to the students’ response on teachers’ feedback (e.g.
Dialogic or Triple Impact Marking) □ □ □
Writing targets for future work
□ □ □
Referring to success or assessment
criteria in your written comments □ □ □
Ticking or indicating in some other way whether success or assessment
Regularly Sometimes Never Referring to the way the work was
planned and completed (as opposed to the end product) in your written comments
□ □ □
Supporting students to assess their own work using given rubrics and
scaffolds □ □ □
Supporting students to assess each other’s own work using rubrics and
scaffolds □ □ □
Other (please specify)
18. How much, if at all, do you use the following VERBAL marking practices in relation to work produced by individual students?
Regularly Sometimes Never
Verbally providing a mark or grade on
work (e.g. A, 7/10) □ □ □
Verbally highlighting mistakes but not
correcting them □ □ □
Verbally highlighting mistakes and explaining/modelling how to correct them
Verbally praising students’ work
□ □ □
Writing a qualitative/descriptive comment about the work e.g.
‘Excellent’ □ □ □
Giving students time in class to respond to or address verbal marking
comments □ □ □
Verbally responding to students’ response on teachers’ feedback (e.g.
Dialogic or Triple Impact Marking) □ □ □
Verbally providing targets for future
work □ □ □
Referring to success or assessment
criteria in your verbal comments □ □ □
Referring to the way the work was planned and completed (as opposed to the end product) in your verbal comments
□ □ □
Other (please specify)
Perceived effectiveness and evaluation of marking methods
Strongly
agree Agree Neutral Disagree disagree Strongly
I feel my current marking practice is
effective □ □ □ □ □
I feel that the time I spend on marking/providing feedback to individual students is proportionate to my overall workload
□ □ □ □ □
I feel that my current marking practice is flexible (e.g., I am able to adapt it depending on the students involved or the piece of work).
I feel that my current marking practice
enables students to progress □ □ □ □ □
I feel that my current marking practice
could be improved □ □ □ □ □
I feel I have a variety of ideas for marking strategies that I can adapt to
different learning situations. □ □ □ □ □
I feel that my current marking practice
is time effective. □ □ □
I feel that my current marking practice
motivates students. □ □ □ □ □
I would like to continue with my current marking practice.
My current marking practice is effective across all types of learner.
□ □ □ □ □
I am confident that my students
understand my feedback. □ □ □ □ □
I feel confident that students use my feedback to make improvements to
their work. □ □ □ □ □
I feel confident that the time spent on written marking is worthwhile in terms
of impact on student outcomes. □ □ □ □ □
20. What do you think are the main benefits, if any, of your current marking practice? (please type below)
22. How do you think your current marking practice (or that of your school) could be improved, if at all?
Appendix 3 – Impact survey (additional items only)
17. Do you feel you have made any deliberate changes to your marking practices over the last two terms?
o Yes a significant change
o Yes a partial change
o No not at all
18. Please describe any change you have made
19. If you have made a partial or significant change, how has this affected pupils' learning?
o Made a significant positive difference
o Made a small positive difference
o Made no difference
o Made a small negative difference
o Made a large negative difference
20. Please explain what evidence you have for the difference any change has made to pupil learning
21. If you have made a partial or significant change, how has this affected your workload
o Made a significant positive difference
o Made no difference
o Made a small negative difference
o Made a large negative difference
22. Please explain what evidence you have for the difference any change has made to your workload
The future of marking
23. How do you think your current marking practice (or that of your school) could be improved, if at all?
© Crown copyright 2018
This publication (not including logos) is licensed under the terms of the Open
Government Licence v3.0 except where otherwise stated. Where we have identified any third party copyright information you will need to obtain permission from the copyright holders concerned.
To view this licence:
visit www.nationalarchives.gov.uk/doc/open-government-licence/version/3
email [email protected]
write to Information Policy Team, The National Archives, Kew, London, TW9 4DU About this publication: