Int. J. Electrochem. Sci., 6 (2011) 3966 - 3981
International Journal of
ELECTROCHEMICAL
SCIENCE
www.electrochemsci.org
Application of Response Surface Methodology (RSM) to
Evaluate the Influence of Deposition Parameters on the
Electrolytic Cu-Zn Alloy Powder
Gökhan Orhan1,*, Gökçe Hapçı1, Özgül Keleş2 1
Istanbul University, Faculty of Engineering, Metallurgical and Materials Engineering Department, 34320 Istanbul, Turkey
2
Istanbul Technical University Metallurgical and Materials Engineering Department 34469 Maslak, Istanbul, Turkey
*
E-mail: [email protected]
Received: 29 June 2011 / Accepted: 12 August 2011 / Published: 1 September 2011
In this paper, the electrodeposition process of Cu-Zn alloy powders from pyrophosphate-based electrolytes was investigated as a function of deposition parameters under direct current. The effects of deposition parameters such as current density, electrolyte composition (Cu/Zn mole ratio), mechanical stirring speed, and temperature on the Cu content of alloy powder and cathodic current efficiency were evaluated using the response surface methodology. The empirical models developed in terms of deposition parameters have been found statistically adequate to describe the process responses. The study revealed that as far as the copper content was concerned in the alloyed powders; all parameters selected have positive correlations. However, high stirring speed and low current density lead a greater current efficiency. The morphology and chemical composition of the electrodeposited Cu-Zn alloy powders were investigated using SEM, EDS, and ICP analysis. SEM analysis showed that the powder morphology is considerably affected by the cathodic current density and stirring speed.
Keywords: Electrolytic Copper-Zinc alloy powder, Response Surface Methodology.
1. INTRODUCTION
morphology within a broad range by adjusting only the deposition parameters [4,5]. Electrodeposition of alloys on a cathode surface can only be obtained when the reduction potentials of metal ions are similar. Their reduction potentials depend on the correspondent standard potential, the overpotential and their respective activities in the solution. Thus, the reduction potentials of metal ions with different standard potentials can be approximated by varying their activities in solution [11]. In order to produce electrodeposited metal alloys, it is necessary to add a complexing agent into a solution. The agent helps to decrease the activity of the noble ions and allow simultaneous deposition [11-14]. Cyanide has been conventionally used complexing agent in Cu-Zn electrolytes [15-19]. On the other hand, due to its high toxicity and rigorous maintenance control, alternative Cu-Zn electrolytes have been proposed [11-13,15,20-27]. Among them, pyrophosphate electrolytes are the most promising due to their high stability. Also, the final treatment, maintenance and control of these electrolytes are much easier than the cyanide ones. However, work of these investigations [11,12,15,21-24,26] concerning the electrodeposition of Cu–Zn alloy from pyrophosphate electrolyte, have been employed for producing high-quality coatings, and not powder.
Although, there has been a significant amount of work accomplished on the electrodeposition of copper-zinc alloys from various electrolytes, no study has been found in the literature on the production of Cu-Zn alloy powders. In this study, the response surface methodology (RSM) has also been used in order to understand the effect of electrodeposition parameters on both the current efficiency and the copper content of the Cu-Zn powders. The results were analyzed using analysis of variance (ANOVA) and regression analysis, and models were developed in order to obtain alloy powders with desired composition. Also, a comprehensive study has been made on the morphology of the powders. Finally, a series of electrochemical tests were carried out so as conducted to explain the results obtained from the experiments.
2. EXPERIMENTAL
2.1. Experimental design
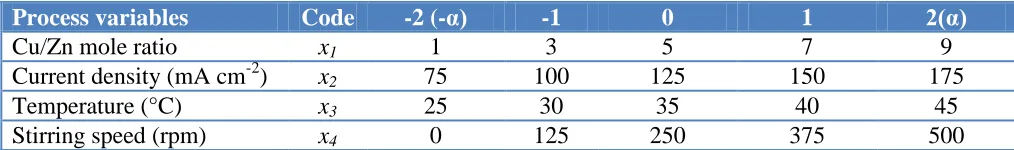
[image:2.596.44.551.681.756.2]RSM is an efficient statistical tool for optimization of multiple variables [28]. In order to describe the response surfaces, a five-level, four-variable central composite design (CCD) was adopted in this study. The four independent variables and their levels for the 27 experiments in the CCD study are shown in Table 1.
Table 1. Processing parameters involved in central composite design
Process variables Code -2 (-α) -1 0 1 2(α)
Cu/Zn mole ratio x1 1 3 5 7 9
Current density (mA cm-2) x2 75 100 125 150 175
Temperature (°C) x3 25 30 35 40 45
In this work, the objective was obtain Cu-Zn alloy powders containing 80-95%wt. Cu, and the process parameters were chosen accordingly. The STATISTICA 8.0 software (StatSoft Inc., USA) was used to conduct regression and the analysis of variance. The statistical significance of the model equation was evaluated by ANOVA, which shows that the regression is statistically significant at a 95% confidence level (P < 0.05). The ANOVA was also performed to test the effect of linear, quadratic and interaction terms on the predicted responses. A Stepwise regression procedure was performed using the backward elimination method in order to exclude non-significant interaction terms from the initial response surface model. The fit quality of model was expressed by the multiple correlation coefficients (R2). The statistical significance of each parameter was determined via P-values. According to Myers and Montgomery [28], smaller P-values identify the effective parameters. The response surface and contour plots can be used to show the individual and cumulative effect of the variables on the responses. These graphical representations for models are plotted as a function of two variables, while keeping other variables at central level.
2.2. Materials and equipments
In all experiments, a mixture of copper and zinc sulphates and potassium pyrophosphate (K4P2O7) was used as electrolyte. Potassium pyrophosphate of 0.5 M (K4P2O7) was the main ligand. The electrolyte was prepared using, distilled water and high quality pure chemicals (Merck and Aldrich) in a constant volume of 250 mL. In the experiments, the total ion concentration of (Zn2+) and (Cu2+) was 0.22 ± 0.005 M and pH was controlled in a range of 8.7–9.1 ± 0.05. The experiments were carried out in a cylindrical glass laboratory type electrolytic cell with three electrodes. The cap of the cell was circular with guidance holes allowing the symmetrical arrangement of the electrodes. The cell was equipped with a thermostatic water jacket connected to a thermostatic bath. Stirring was provided by a magnetic stirrer. The cathodes were square plates of stainless steel with an area of 4 cm2. Platinum plate was used as anode. The reference electrode was a saturated calomel electrode (SCE) which was connected to the cathode by a Luggin capillary positioned at the distance of 0.2 cm from the cathode surface. The surface of the cathodes was grinded and polished prior to each experiment. In all experiments, the deposition time was constant at 60 min. The cell voltage varied between 3.00 and 3.75 V due to the electrolysis parameters. The deposited powders were washed, first with large amounts of distilled water and then with ethanol until the powders were free from traces of electrolyte. The powder was dried under vacuum at 80 °C before the analysis.
the polarization curves, the potential was scanned from -0.25 to -1.7 V at a scan rate of 2 mV s− 1 and from -0.5 to -2.5 V at a scan rate of 300 mV s−1.
In order to characterize the as-deposited surfaces and to determine the alloy composition, a scanning electron microscope (JEOL JSM 5600) with EDS attachment was used. The chemical analysis of the alloy powder was made by using an ICP-OES (Spectro Ciros Vision) spectrometer.
3. RESULT AND DISCUSSION
[image:4.596.57.545.287.761.2]3.1. Effects on copper content of brass powder
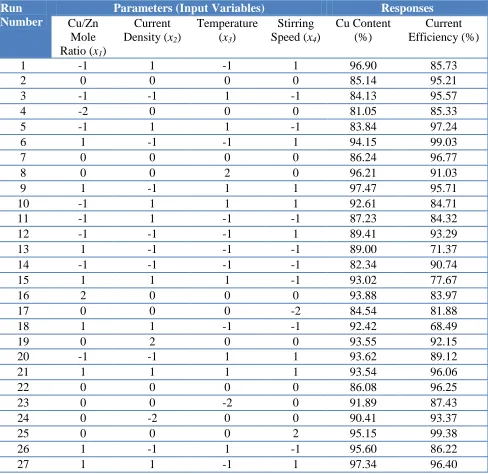
Table 2. Design layout and experimental results
Run Number
Parameters (Input Variables) Responses
Cu/Zn Mole Ratio (x1)
Current Density (x2) Temperature (x3) Stirring Speed (x4) Cu Content (%) Current Efficiency (%)
1 -1 1 -1 1 96.90 85.73
2 0 0 0 0 85.14 95.21
3 -1 -1 1 -1 84.13 95.57
4 -2 0 0 0 81.05 85.33
5 -1 1 1 -1 83.84 97.24
6 1 -1 -1 1 94.15 99.03
7 0 0 0 0 86.24 96.77
8 0 0 2 0 96.21 91.03
9 1 -1 1 1 97.47 95.71
10 -1 1 1 1 92.61 84.71
11 -1 1 -1 -1 87.23 84.32
12 -1 -1 -1 1 89.41 93.29
13 1 -1 -1 -1 89.00 71.37
14 -1 -1 -1 -1 82.34 90.74
15 1 1 1 -1 93.02 77.67
16 2 0 0 0 93.88 83.97
17 0 0 0 -2 84.54 81.88
18 1 1 -1 -1 92.42 68.49
19 0 2 0 0 93.55 92.15
20 -1 -1 1 1 93.62 89.12
21 1 1 1 1 93.54 96.06
22 0 0 0 0 86.08 96.25
23 0 0 -2 0 91.89 87.43
24 0 -2 0 0 90.41 93.37
25 0 0 0 2 95.15 99.38
26 1 -1 1 -1 95.60 86.22
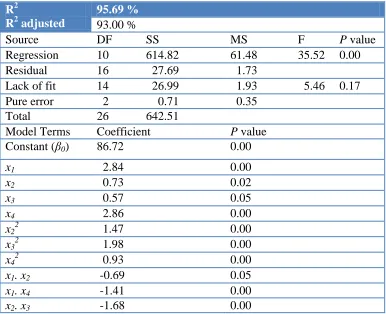
Table 3. Regression and ANOVA analysis on the Cu content (%)
R2
R2 adjusted
95.69 %
93.00 %
Source DF SS MS F P value
Regression 10 614.82 61.48 35.52 0.00
Residual 16 27.69 1.73
Lack of fit 14 26.99 1.93 5.46 0.17
Pure error 2 0.71 0.35
Total 26 642.51
Model Terms Coefficient P value
Constant (β0) 86.72 0.00
x1 2.84 0.00
x2 0.73 0.02
x3 0.57 0.05
x4 2.86 0.00
x22 1.47 0.00
x32 1.98 0.00
x42 0.93 0.00
x1. x2 -0.69 0.05
x1. x4 -1.41 0.00
x2. x3 -1.68 0.00
The CCD experimental design the results gathered from the experiments are shown in Table 2. Table 3 shows the ANOVA and regression analysis’ results for the Cu content of brass powder. The terms without statistical significance were eliminated from the full second-order model. The reduced model for Cu content gives R2 and adjusted R2 values of 95.69% and 93.00%, respectively presenting the significance of the model.
The regression model for Cu content (y1), in coded factors, is expressed by the following second-order polynomial equation:
y1 (% Cu content) = 86.72 + 2.84x1 + 0.73x2 + 0.57x3 + 2.86x4 + 1.47x22 + 1.98x32 + 0.93x42 – 0.69x1x2
– 1.41x1x4 – 1.68x2x3 [1]
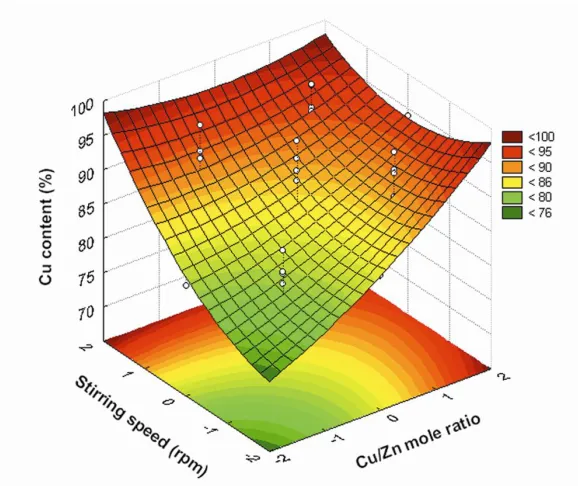
Eq.[1] indicates the main effects of each parameter correlate positively with copper content. The magnitude of coefficients for Cu/Zn mole ratio and stirring speed are larger than the coefficients for current density and temperature, indicating that these parameters have a more significant effect on the copper content. The other parameters (current density, and temperature) seem to have a quadratic effect on the copper content.
[image:5.596.106.492.97.411.2]
Figure 1. Response surface and contour plot of copper content (%) as a function of current density and Cu/Zn mole ratio.
In Figure 1 it is obvious that this influence is positive and quadratic. Additionally, the interaction effect of current density and Cu/Zn mole ratio can be observed. Due to the main effect, the increment of Cu/Zn mole ratio conducts to increasing of the Cu content.
[image:6.596.152.445.71.313.2] [image:6.596.148.427.484.716.2]
The copper ion concentration is higher than zinc ion concentration in the solutions having high Cu/Zn mole ratios i.e., Cu/Zn is 9 (+2 level). In this case, the amount of copper ions, that are ready to be reduced, ions in the region near the cathode are more than zinc. Therefore, it is reasonable to have high copper content in brass powders with increasing Cu/Zn mole ratio. In solution which contains the same amount of copper and zinc (Cu/Zn 1, -2 level), an increase of copper content in the alloy with increasing current density is dependent on the reduction potentials of copper and zinc in alkaline solution as well as the cathodic polarization values.
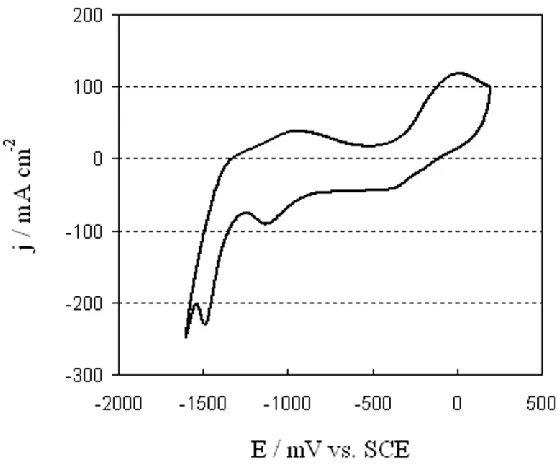
A cyclic voltammogram for brass deposition in pyrophosphate solution is presented in Figure 2. It is observed that two cathodic peaks of copper and zinc are approximately -1150 and -1500 mV, respectively. In addition to this, the values of cathodic polarization in the experiments vary in the range of about 1000-1200±50 mV and depend on the deposition parameters. For this reason, the copper content of alloy powder is high at equal Cu and Zn ion concentration.
Figure 3. Response surface and contour plot of copper content (%) as a function of current density and temperature.
[image:7.596.140.456.301.567.2][image:8.596.153.442.182.425.2]
indicated that the copper content of Cu-Zn alloy coatings decreases with an increase in current density although their study war conducted under different electrodeposition conditions. In our work, this was only observed at high temperature values. On the other hand, there is a linear increase in Cu content with an increase in the current density at lower temperatures, as shown in Figure 3. Also, Table 3 and Eq. [1] reveal that the interaction effect between temperature and current density is very significant.
Figure 4. Response surface and contour plot of copper content (%) as a function of Cu/Zn mole ratio and stirring speed.
3.2. Effects on current efficiency
[image:9.596.98.501.203.523.2]In this part of the study, the effect of selected parameters on the current efficiency of the process is investigated. The current efficiency results gathered were also analyzed by ANOVA and regression analysis as shown in Table 4.
Table 4. Regression and ANOVA analysis on the current efficiency (%)
R2
R2 adjusted
93.20 %
89.59 %
Source DF SS MS F P Value
Regression 9 1566.35 174.04 25.87 0.00
Residual 17 114.35 6.73
Lack of fit 15 113.09 7.54 11.97 0.08
Pure error 2 1.26 0.63
Total 26 1680.70
Model Terms Coefficient P Value
Constant (β0) 94.28 0.00
x1 -1.35 0.02
x2 -1.37 0.02
x3 1.67 0.01
x4 4.31 0.00
x12 -2.70 0.00
x32 -1.56 0.01
x42 -1.20 0.04
x1. x4 6.15 0.00
x3. x4 -3.16 0.00
The values of R2 and adjusted R2 were found to be 93.20% and 89.59%, respectively. After eliminating the non significant terms, the final response equation for current efficiency (y2) is given as follows:
y2 (% current efficiency) = 94.28 – 1.35x1 – 1.37x2 + 1.67x3 + 4.31x4 – 2.70x12 – 1.56x32 –1.20x42 +
6.15x1x4 – 3.16x3x4 [2]
Figure 5. Response surface and contour plot of current efficiency (%) as a function of Cu/Zn mole ratio and stirring speed.
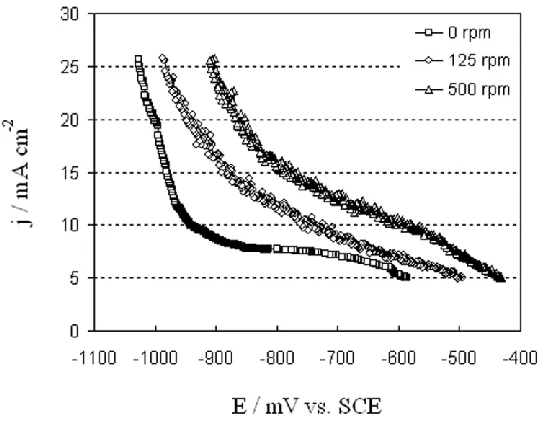
Figure 6. Polarization curves for the electrodeposition of Cu-Zn from the pyrophosphate electrolyte at different stirring speeds with a scan rate of 2 mV s-1.
[image:10.596.153.445.71.313.2] [image:10.596.161.431.395.607.2]
effect of Cu/Zn mole ratio on the current efficiency. By the polarization curves corresponding to Cu-Zn alloys electrodeposition, it now becomes easy to correlate the current efficiency of the powder with the stirring speed. The polarization curves for the electrodeposition of Cu-Zn from pyrophosphate electrolyte with 125, 500 rpm and without stirring are shown in Figure 6. At 125 and 500 rpm, the polarization curves exhibit same slope in different current density, while the slope of polarization curves at 0 rpm is different from the others, especially at lower current density. As seen, the curve plotted at 0 rpm is more polarized than the others at a fixed current density. As mentioned earlier, the increase of the stirring speed leads to an enhancement of ion transfer at the electrode-electrolyte interface, and consequently, results in an increase in limiting diffusion current density. In other words, a limiting current plateau is easily reached at 0 rpm. This indicates that secondary reactions (water decomposition), which take place on the cathode surface along with the primary cathode reaction (alloy reduction), increase at lower stirring speeds, resulting in lower current efficiency.
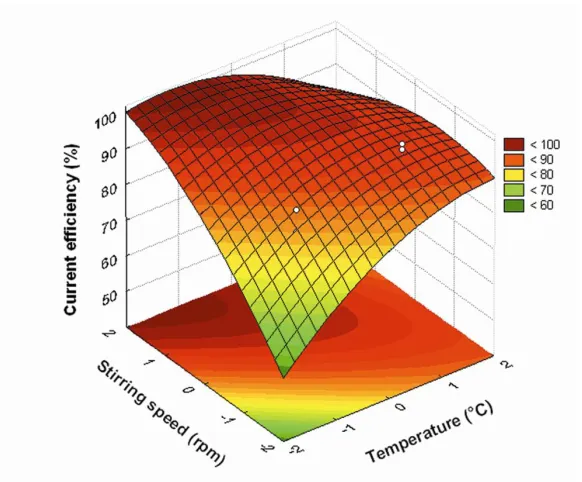
[image:11.596.154.445.334.575.2]The significant interaction effect of stirring speed and temperature, on the current efficiency is shown in Figure 7.
Figure 7. Response surface and contour plot of current efficiency (%) as a function of stirring speed and temperature.
3.3. Morphology of Cu-Zn Alloy Powders
To understand the effect of electrolysis parameters on the electrolytic Cu-Zn alloy powder morphology, alloy deposits were examined by SEM.
[image:12.596.184.415.161.716.2]
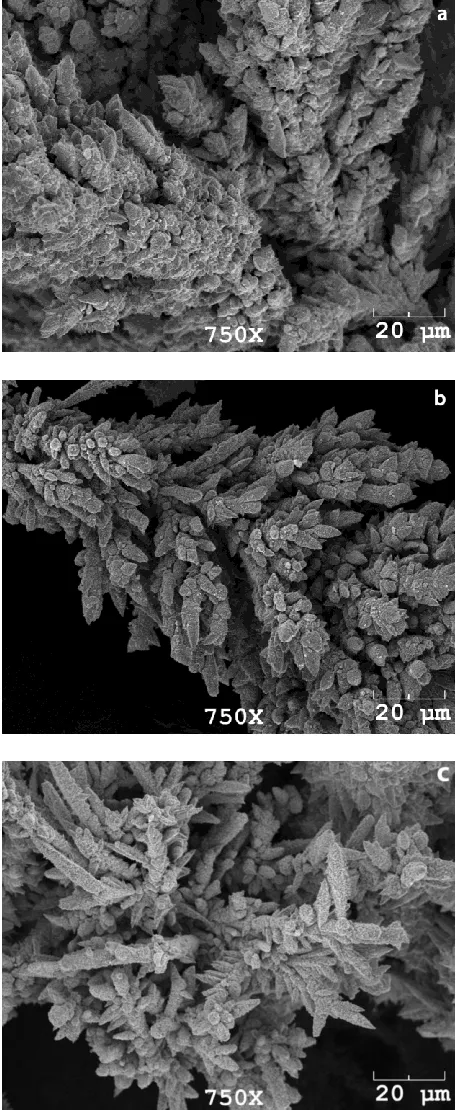
The effect of the current density on the morphology of the Cu-Zn alloy powder was investigated at current densities of 75, 125 and 175 mA cm-2. The SEM results obtained under conditions of runs 24, 22 and 19 are shown in Figure 8.
As seen in Figure 8a, the alloy powder obtained at a value of 75 mA cm-2 is a dense. In this case, the morphology of alloy powder obtained at 75 mA cm-2 is in accordance with the position of this current density in the polarization curve. The polarization curve for the electrodeposition of Cu-Zn alloy from a pyrophosphate electrolyte at a stirring speed of 250 rpm is given in Figure 9.
Figure 9. Polarization curves for the electrodeposition of Cu–Zn from the pyrophosphate electrolyte containing 0.5M K4P2O7 with a scan rate of 300 mV s-1.
It can be seen that the range of over potentials belonging to the plateau of the limiting current density is approximately between 990 and 1150 mV, respectively.
With an increase in current density, outgrowth features can be observed. It can be seen from Figures 8b and 8c that the surface protrusions are corncob-like.
The corncob-like structures forming branches constitute the dendritic character of these particles. Primary and secondary branches of the particles are in the powder deposits obtained at 125 and 175 mA cm-2. Furthermore, at 175 mA cm-2, dendrites have more pronounced secondary branches and high-order branches. The deposits obtained at low current densities consist of a low number of nuclei [30]. However, the number of growth sites increase and the grain size of the deposit decreases by increasing the current density.
[image:13.596.139.452.224.480.2]
17 and 25. In the case of electrodeposition without stirring, spongy-like structures are detected in alloy powder (Figure 10a). The top surface of all particles is practically identical, being characterized by small fern-like dendrites [5,6]. As mentioned earlier, increasing stirring speed to 250 rpm (run 22), branched dendrites are formed (see Figure 8b).
Figure 10. SEM micrographs of Cu-Zn alloy powder electrodeposited at different stirring speeds: a) 0 rpm and b) 500 rpm (Cu/Zn 5, 35°C, 125 mA cm-2).
The alloy powder obtained at 500 rpm is more dense has a cauliflower-like structure (Figure 1b). In addition to this, partially compact deposits are formed at 500 rpm. Sharp edges could be detected on the top of the particles, indicating the crystallinity of deposited powder. It is known that the cathodic polarization as well as the limiting current density increase with increasing stirring speed [31]. In this case the morphology of powders become similar to those obtained at lower current densities before the initiation of dendritic growth, despite working at higher current density than the limiting current density.
[image:14.596.184.414.164.535.2]
4. CONCLUSIONS
Cu-Zn alloy powders were produced by electrochemical deposition in pyrophosphate electrolyte, with different chemical composition, as well as current density, stirring speed and temperature conditions.
The use of a statistical approach allowed us to see individual and/or interaction effects of deposition parameters in order to obtain alloy powders with a desired composition and to determine the optimum experimental conditions that lead to the maximization of current efficiency. In order to gain a better understanding of the effect of the variables on copper content and current efficiency, the predicted models were presented in three-dimensional response surface graphs. Coupled with the response surface method, the analysis of variance gives high R2 values showing that the second-order polynomial equation developed in this study is statistically adequate fit to the experimental results.
SEM analysis showed that current density and stirring speed powder morphology. The alloy powder morphology changes from spongy-like to cauliflower-like structures with increasing stirring speed. With increasing current density, highly branched dendritic particles are formed. These powders are highly branched dendrites, consisting of corncob-like structures.
ACKNOWLEDGEMENTS
The authors would like to thank by the Scientific and Technological Research Council of Turkey (TUBITAK), which supported this work as part of TUBITAK project No: 105M137.
References
1. P.W. Lee, W.B. Eisen, B.L. Ferguson, R.M. German, R. Iacocca, D. Madan, H. Sanderow, Y.T. Hardbound, ASM Metals Handbook Vol. 7, ASM International, Ohio (1998)
2. K. Kondoh, H. Imai, Y. Kosaka, A. Kojima, J. Umeda, J. Metall. 2009, (2009) 1 3. H. Imai, K. Kondoh, G. Katano, Y. Kosaka, A. Kojima, Trans. of JWRI, 37 (2008) 51 4. L.D. Rafailović, W. Artner, G.E. Nauer, D.M. Minić, Thermochim. Acta, 496 (2009) 110 5. V.D. Jović, B.M. Jović, M.G. Pavlović, Electrochim. Acta, 51 (2006) 5468
6. V.D. Jović, B.M. Jović, V. Maksimović, M.G. Pavlović, Electrochim. Acta, 52 (2007) 4254 7. B.M. Jović, V.D. Jović, V.M. Maksimović, M.G. Pavlović, Electrochim. Acta, 53 (2008) 4796 8. U. Lačnjevac, B.M. Jović, Z. Baščarević, V.M. Maksimović, V.D. Jović, Electrochim. Acta, 54
(2009) 3115
9. U. Lačnjevac, B.M. Jović, V.D. Jović, Electrochim. Acta, 55 (2009) 535
10.L. Ribić-Zelenović, M. Spasojević, A. Maričić, Mater. Chem. Phys. 115 (2009) 347 11.L.F. Senna, S.L. Diaz, L. Sathler, J. Appl. Electrochem. 33 (2003) 1155
12.K. Johannseni, Plat. Surf. Finish, 88 (2001) 104
13.F.L.G. Silva, D.C.B. do Lago, E. D’Elia, L.F.Senna, J. Appl. Electrochem. 40 (2010) 2011 14.L.T. Farias, A.S. Luna, D.C.B. Lago, L.F. Senna, Mater. Res. 11 (2008) 1
15.T. Vagramyan, J.S.L. Leach, J.R. Moon, Electrochim. Acta, 24 (1978) 231 16.H. Strow, Met. Finish. 99 (2001) 206
21.Ya.V. Mumladze, V.I. Kharlamov, T.A. Vagramyan, S.S. Kruglikov, A.V. Brigadnov, Sov. Electrochem., 24 (1988) 771
22.D. Page, S. Roy, J.of Phys. IV, 5 (1997) 269
23.K. Johannsen, D. Page, S. Roy, Electrochim. Acta, 45 (2000) 3691 24.S.D. Beattie, J.R. Dahn, J Electrochem. Soc. 150 (2003) 802
25.I.A. Carlos, M.R.H. Almeida, J. Electroanal. Chem. 562 (2004) 153 26.L.F. Senna, S.L. Diaz, L. Sathler, Mater. Res. 8 (2005) 275
27.F.B.A. Ferreira, F.L.G. Silva, A.S. Luna, D.C.B. Lago, L.F. Senna, J. Appl. Electrochem. 37 (2007) 473
28.H.R. Myers, D.C. Montgomery, Response Surface Methodology: Process and Product Optimization Using Design Experiments, John Wiley & Sons, New York (1995) 29.F.L.G. Silva, J.R. Garcia, V.G.M. Cruz, A.S. Luna, , D.C.B. Lago, L.F. Senna, J. Appl.
Electrochem. 38 (2008) 1763
30.K.I. Popov, S.S. Djokić, B.N. Grgur, Fundamental Aspects of Electrometallurgy, Kluwer Academic/Plenum Publishers, New York (2002)
31.B. Kim, T. Ritzdorf, J. Electrochem. Soc. 150 (2003) 53 32.G. Orhan, G. Hapçı, Powder Technol. 201 (2010) 57