0022-538X/10/$12.00
doi:10.1128/JVI.01355-10
Copyright © 2010, American Society for Microbiology. All Rights Reserved.
High-Throughput, Sensitive Quantification of Repopulating
Hematopoietic Stem Cell Clones
䌤
†
Sanggu Kim,
1,6Namshin Kim,
8Angela P. Presson,
3,5,6Dong Sung An,
6,7Si Hua Mao,
1,4,6Aylin C. Bonifacino,
9Robert E. Donahue,
9Samson A. Chow,
2,6and Irvin S. Y. Chen
1,4,6*
Department of Microbiology, Immunology, and Molecular Genetics,
1Department of Molecular and Medical Pharmacology,
2Department of Biostatistics,
3Department of Medicine,
4Department of Pediatrics,
5UCLA AIDS Institute,
6and Division of
Hematology and Oncology,
7University of California—Los Angeles, Los Angeles, California 90095;
Korea Research Institute of Bioscience and Biotechnology, 111 Gwahangno, Yuseong-gu, Daejeon 305-806,
South Korea
8; and Hematology Branch, National Heart, Lung and Blood Institute,
National Institutes of Health, Rockville, Maryland 20850
9Received 25 June 2010/Accepted 1 September 2010
Retroviral vector-mediated gene therapy has been successfully used to correct genetic diseases. However, a
number of studies have shown a subsequent risk of cancer development or aberrant clonal growths due to
vector insertion near or within proto-oncogenes. Recent advances in the sequencing technology enable
high-throughput clonality analysis via vector integration site (VIS) sequencing, which is particularly useful for
studying complex polyclonal hematopoietic progenitor/stem cell (HPSC) repopulation. However, clonal
re-population analysis using the current methods is typically semiquantitative. Here, we present a novel system
and standards for accurate clonality analysis using 454 pyrosequencing. We developed a bidirectional VIS PCR
method to improve VIS detection by concurrently analyzing both the 5
ⴕ
and the 3
ⴕ
vector-host junctions and
optimized the conditions for the quantitative VIS sequencing. The assay was validated by quantifying the
relative frequencies of hundreds of repopulating HPSC clones in a nonhuman primate. The reliability and
sensitivity of the assay were assessed using clone-specific real-time PCR. The majority of tested clones showed
a strong correlation between the two methods. This assay permits high-throughput and sensitive assessment
of clonal populations and hence will be useful for a broad range of gene therapy, stem cell, and cancer research
applications.
Integration of the retroviral DNA provirus into the host
genome is an obligatory step in the retroviral life cycle.
Be-cause of this unique property, retroviruses have been adapted
as vectors (24, 26) and used successfully to correct genetic
diseases, such as X-linked severe combined immunodeficiency
(SCID), adenosine deaminase (ADA)-deficient SCID, and
X-linked adrenoleukodystrophy, by stable genetic modification of
hematopoietic progenitor/stem cells (HPSC) (1, 2, 5, 6, 13, 27,
29). However, the risk of insertional mutagenesis from
thera-peutic vectors has been demonstrated in several cases in which
integration events near or within proto-oncogenes triggered
leukemia (8, 12, 14, 16, 34). Therefore, it is important to
understand the mechanisms for complex hematopoietic
re-population in humans and to study the behaviors of engineered
HPSC clones following transplant.
Since retrovirus vectors uniquely “mark” individual HPSC
by vector integration sites (VIS), clonal repopulation by HPSC
can be analyzed by tracking the VIS. Restriction enzyme-based
assays are commonly used for the clonal tracking, where
genomic DNA is digested with restriction enzymes to generate
VIS DNA fragments of different lengths that can be
de-tected by Southern blotting (9, 17, 18, 22) or nucleotide
sequencing via linker-mediated PCR (LM-PCR) (32),
in-verse PCR (INV-PCR) (33), or linear
amplification-medi-ated PCR (LAM-PCR) (30). These approaches have been
widely used in biological and clinical research to study
com-position of the HPSC pool, stem cell engraftment, regulatory
decisions of individual stem cells, and genotoxicity of retroviral
vectors (17, 22, 23, 25, 29, 31, 35). While mouse HPSC
repopu-lation is typically mono- or oligoclonal (17), the number of
HPSC clones repopulating in humans or nonhuman primates is
much larger, manifesting several hundreds to thousands of
repopulating clones posttransplant (5, 31, 35). Recent
ad-vances in sequencing technology have enabled
high-through-put and parallel clonality analysis through large-scale VIS
se-quencing and enumeration of VIS sequences (5, 15, 35, 36).
However, these methods can detect only VIS that are
prox-imal to restriction enzyme sites, and additional experimental
limitations may exist (10, 15, 36). As a result, current assays
can only roughly estimate clonal frequencies, so the current
standard is to perform clone-specific real-time PCR for
sen-sitive and accurate quantification. Recently, novel clonal
tracking assays that do not require restriction enzyme usage
have been described (10, 11). However, these methods
in-volve experimental steps that are technically challenging,
and they require further optimization to achieve reliable,
high-throughput quantification.
* Corresponding author. Mailing address: Department of
Microbi-ology, Immunology and Molecular Genetics, University of California
David Geffen School of Medicine, 615 Charles E. Young Dr. South,
BSRB 173, Los Angeles, CA 90095. Phone: (310) 825-4793. Fax: (310)
267-1875. E-mail: [email protected].
† Supplemental material for this article may be found at http://jvi
.asm.org/.
䌤
Published ahead of print on 15 September 2010.
11771
on November 8, 2019 by guest
http://jvi.asm.org/
Here, we present a novel VIS detection and quantification
system based on 454 pyrosequencing and accompanying
guidelines for high-throughput quantification of multiple
clonal populations. We used a novel bidirectional PCR method
to concurrently analyze both the 5
⬘
(left) and the 3
⬘
(right)
vector-host junctions in peripheral blood repopulating cells (PBC) in
a rhesus macaque transplanted with autologous HPSC
trans-duced with lentivirus vectors (3). The reproducibility and
con-ditions for reliable quantification were tested by two
indepen-dent experiments conducted on the same PBC collected at four
posttransplant time points. The lengths of VIS PCR amplicons,
the amount of genomic DNA for analysis, and the intensity of
sequencing are important factors influencing the reliability and
the sensitivity of the assay. Of 964 unique vector integrants
analyzed, the relative quantities of a 398-member subset were
determined, demonstrating heterogeneous and dynamic clonal
frequency changes over time. Clonal frequencies were further
confirmed by clone-specific real-time PCR. We show that this
assay detects the majority of VIS that are present in a given
clonal population and accurately measures their relative
fre-quencies.
MATERIALS AND METHODS
Control assays for quantitative sequencing of different lengths of DNA.A total of 15 DNA clones ranging from 125 bp to 1,680 bp in length were prepared by PCR amplification of the pNL4.3 plasmid (see Table S1 in the supplemental material for the 454 fusion primers). The PCR amplicons were mixed in the same molar ratios and subjected to the amplicon sequencing procedure of 454 pyro-sequencing to test the PCR efficiency for different lengths of DNA during the emersion PCR (emPCR) step (Roche). We also examined quantitative VIS sequencing using serially diluted control VIS DNA. Four different lengths of VIS DNA (188, 279, 494, and 1,104 bp) were isolated from the first PCR product of a 5-month PBC sample (see Fig. 2a, experiment 2, and below for details) and cloned into TOPO TA cloning vector (Invitrogen). A mixture of four control DNAs (0.7 ng each) was serially diluted by 2-fold and mixed with 2.5 ng of VIS DNA from an acute infection sample (first PCR product in experiment 2). Serial dilutions were subjected to the first PCR step in experiment 2.
In vitrolentivirus vector transduction.Peripheral blood CD34⫹cells were isolated from the leukapheresis cell product collected after mobilization with granulocyte colony-stimulating factor (G-CSF) and stem cell factor (SCF) as described previously (3, 4). CD34⫹cells were transduced with the vesicular stomatitis virus G protein-pseudotyped lentivirus vector (CS-RhMLV-E) on RetroNectin (Takara Bio Inc., Japan)-coated, non-tissue culture-treated six-well plates (Becton Dickinson Labware, Franklin Lake, NJ) as described previously (3, 4). Briefly, 1.6⫻107
CD34⫹cells were incubated with lentivirus vectors at a multiplicity of infection (MOI) of 3 in medium supplemented with 100 ng/ml SCF, 50 ng/ml interleukin-6, and 2g/ml Polybrene. After 2 h, the culture supernatant was removed and replaced with fresh medium. The genomic DNA of infected cells was isolated 4 days after infection using a DNeasy Blood and Tissue Kit (Qiagen).
Isolation of rhesus peripheral blood cells.Animal (rhesus macaque 95E132) was transplanted with autologous CD34⫹cells transduced with lentivirus vector (CS-RhMLV-E) (3) and maintained in accordance with federal guidelines and the policies of the Veterinary Research Program of the National Institutes of Health. The protocols were approved by the Animal Care and Use Committee of the National Heart, Lung, and Blood Institute. Peripheral blood cells were isolated from EDTA-treated whole blood by ammonium chloride-mediated red blood cell lysis in 2-week to 6-month intervals and cryo-preserved.
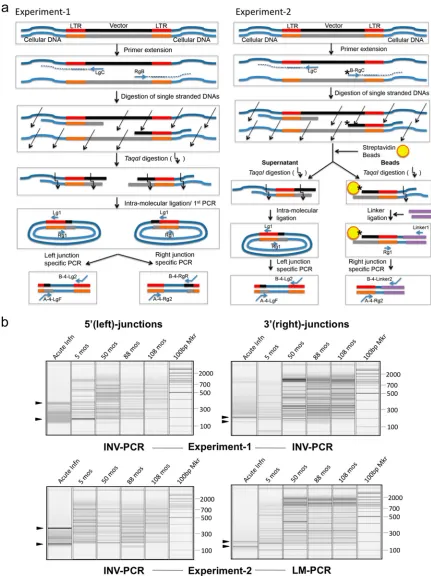
Bidirectional VIS PCR amplification.Two approaches (experiment 1 and experiment 2) were tested for quantitative analysis of both the left and the right vector-host junction DNA (see Fig. 2a for the schematic view of the procedure and Table S2 in the supplemental material for primer sequences).
Experiment 1 (using INV-PCR method).We modified the inverse-PCR (7) to amplify both the left and the right vector-cellular DNA junctions simultaneously. Two primers specific to vector-host DNA junctions, LgC (0.1M) and RgB (0.1
M), were bound and linearly extended in the 500-l reaction solution contain-ing 2.5 to 10g of genomic DNA, 1⫻ThermoPol buffer (New England Biolabs),
0.2 mM deoxynucleoside triphosphates (dNTPs), and 25 units ofTaqDNA polymerase (New England Biolabs) under the following conditions: 94°C for 3 min, followed by incubation at 55°C for 5 min and at 72°C for 5 min. To remove single-stranded DNA, the reaction mixture was mixed with 10 units of T7 endo-nuclease I, 60 units of RecJf, 60 units of exonuclease I, and 1⫻buffer 4 (New
England Biolabs) and incubated at 37°C for 1 h. DNA was purified by phenol and chloroform extractions. Double-stranded vector-host junction DNA was digested with Taq␣I [(T/C)GA]. Taq␣I digestion produces a fixed length of vector DNA (550 bp of vector DNA for the left junction or 812 bp of vector DNA for the right junction) joined by different lengths of cellular DNA for each junction DNA depending on the location of the Taq␣I site within the cellular DNA. Digested DNA was purified and ligated under conditions favoring intramolecular ligation. Circularized DNA was amplified by a two-step PCR. The first PCR was carried out using primer Lg1 and primer Rg1 to amplify both the left and the right vector-cellular DNA junctions in 500l of PCR mixture with a 0.5M concen-tration of each primer, 0.2 mM dNTPs, and 50 units ofTaqDNA polymerase under the following conditions: 2 min of preincubation at 94°C, followed by 20 cycles of 94°C for 25 s, 56°C for 25 s, and 72°C for 2.5 min. Amplified DNA was purified using a QIAquick PCR purification kit (Qiagen). The left and the right DNA junctions were then separately amplified by the junction-specific second PCR. A total of 10 ng of DNA from the first PCR product was used for the second PCR. Primers for the second PCR were designed as described in the amplicon sequencing manual for 454 pyrosequencing (28). For PCR amplifica-tion of the left juncamplifica-tion, reverse primer B-4-Lg2 and forward primer A-4-LgF were used. The second PCR conditions were the same as those of the first PCR except that 24 cycles were used. For the right vector-cellular DNA junction, forward primer A-4-Rg2 and reverse primer B-4-RgR were used for the second PCR with 28 cycles.
Experiment 2 (using both LM-PCR and INV-PCR methods).The left and the right vector-cellular DNA junctions were processed using INV-PCR and LM-PCR, respectively, with modifications. The initial steps for the junction-specific linear extension and single-stranded DNA digestion were performed as de-scribed above, except that 5⬘end-biotinylated primer, B_RgC (5⬘-biotin-GGTA CCTTTAAGACCAATGAC) was used instead of RgB. The right-junction DNAs, which were biotinylated at the 5⬘end of the vector side DNA, were bound to streptavidin-agarose Dynabeads (Dynal magnetic beads; Invitrogen) and arated from the left-junction DNAs (in the supernatant) using a magnetic sep-arator, according to the manufacturer’s instructions. After separation, the right-junction DNAs were processed following the conventional LM-PCR method as described previously (19) with modifications. The bead-bound DNA was digested with Taq␣I. Since the vector DNA does not harbor a Taq␣I site, only cellular DNA was cleaved. Then the Taq␣I cleavage site in cellular DNA was ligated to a linker DNA containing a CG nucleotide 5⬘overhang complementary with the Taq␣I-digested DNA. The linker-ligated DNA was subjected to the two-step PCR. The first PCR was carried out using primers Rg1 and Link1 (5⬘-TAACT GTCACACCTGGAGATA-3⬘) in a final volume of 300l with a 0.5M con-centration of each primer, 0.2 mM dNTPs, and 12 U ofTaqDNA polymerase under the following conditions: 2 min of preincubation at 94°C, followed by 24 cycles at 94°C for 25 s, 58°C for 25 s, and 72°C for 2.5 min. The PCR product was purified using a PCR purification kit (Qiagen) and was used as the template for the second PCR. Ten nanograms of DNA from the first PCR product was used for the second PCR. The conditions were identical to those for the first PCR, except that the second PCR was conducted with 18 cycles using 454 fusion primers, A-5-Rg2 and B-4-Link2. After bead separation, left-junction DNA in the supernatant was cleaned by phenol and chloroform extractions and digested with Taq␣I. Digested DNA was purified and ligated under conditions favoring intramolecular ligation. Circularized VIS DNA was am-plified by a two-step PCR. The first PCR and the second PCR were carried out under the identical conditions described above for the left-junction am-plification in the experiment 1.
454 Pyrosequencing.The VIS PCR products were purified and subjected to 454 pyrosequencing (Roche) using Genome Sequencer FLX and GS FLX stan-dard series kits for amplicon sequencing according to the company manual (28), except that we modified emPCR conditions as follows: 4 min at 94°C followed by 40 cycles of 94°C for 30s, 58°C for 3 min, and 68°C for 2 min; this was followed by an additional 13 cycles of 94°C for 30 s and 58°C for 6 min. Different samples were run and analyzed in parallel using an eight-region gasket and the 4-bp tag (barcode) sequences within the fusion primers.
Analysis of VIS sequences.VIS sequences were collected and analyzed after two runs of 454 pyrosequencing. Initially, VIS DNA sequences from the left and the right junctions were separately processed (see Fig. S1 in the supple-mental material). Sequences were analyzed according to the following pro-gram.
on November 8, 2019 by guest
http://jvi.asm.org/
(i) VIS authentication.VIS sequences were authenticated by the existence of a vector-cellular DNA junction. The cellular DNA sequences were confirmed by alignment to the rhesus macaque genome (January 2006 rheMac2 assembly) and the human genome (March 2006 hg18 assembly; NCBI build 36.1) using BLAT (www.genome.ucsc.edu) and GMAP (www.gene.com/share/gmap/).
(ii) Sequence enumeration of unique VIS. The numbers of individual VIS sequences were counted based on the results of sequence comparison as well as sequence alignment onto the genome. Initially, individual sequences were clus-tered into groups of identical sequences based on sequence similarity (⬎95% homology) between sequences and their genomic alignment results, and the total number of sequences for each group and its representative nucleotide sequence were determined. Of total 73,470 sequences analyzed, we found that about 26% contain sequencing errors, mostly homopolymer errors (21), and failed to have a good match (⬎95% homology) to a correct VIS sequence (a sequence without errors). Other errors including nucleotide substitution, insertions, and deletions were relatively rare and were allowed by the⬎95% homology criterion. Homopolymer errors were apparent when an error-containing sequence was com-pared to the correct VIS sequence. Hence, we identified and added those se-quences containing homopolymer errors into the counts of the correct VIS sequences by a three-step search/match process. In step 1, the intermediate sequence data from the previous process were clustered into different groups based on sequence similarity at a lower stringency condition (⬎90% homology). In step 2, we assigned a different confidence level to individual sequences within a group and chose the highest ranking one to use as a standard sequence, representing the correct VIS sequence, for comparison with other error-contain-ing sequences. The rankerror-contain-ing criteria determinerror-contain-ing the confidence levels are as follows: first, a sequence whose authenticity is confirmed by the presence of the other side-junction sequence in our data set (see “Matching the left and the right junctions” below); second, a sequence that aligns best, with at least 95% homol-ogy, onto the genome; third, a sequence with higher sequence counts; fourth, a sequence with a Taq␣I site at the 3⬘ end; and fifth, a sequence with longer sequence read. In step 3, any sequence within a group showing⬎95% sequence homology, excluding mismatches at homopolymer stretches, to the standard sequence in the same group was added into the count of the standard sequence. We repeated one more cycle of the three-step process with the matching strin-gency of 80% at step 1 to cover more error-containing sequences. Lastly, for some sequences that were apparently identical to one of the VIS sequences but remained uncombined, we manually added those sequences into the appropriate VIS sequences.
(iii) Removal of sequence count data for VIS DNA of >500 bp.Since quanti-tative sequencing of the PCR amplicons of⬎500 bp was not efficient under current experimental conditions, sequence count data for VIS DNA of⬎500 bp were removed from quantitative analysis. The VIS DNA lengths were deter-mined based on the nearest restriction enzyme site (Taq␣I).
(iv) Matching the left and the right junctions.When a VIS sequence from one of two vector-host junctions was aligned onto the genome in opposite orientation of another VIS sequence from the other junction with a 5-bp overlap, which is a typical phenomenon of genomic DNA duplication following HIV integration, we considered these pairs to have originated from the same vector integrant. Se-quence counts from these pairs were averaged (see Fig. 5a).
(v) Compensation factor.To adjust for overestimation of clonal frequencies, we applied a compensation factor (0.39) (see Fig. 5b) to the relative sequence frequencies of individual vector integrants.
(vi) Statistical analysis. To test the correlation of the clonal frequencies between two experiments, we used the Pearson product-moment correlation coefficient (r). We usedr⫻ccontingency table analysis (chi-square approxima-tion) and a Student’sttest to test the null hypothesis of no correlation between the two experiments and equal numbers of unique VIS, respectively. Continuous variables are summarized by the mean⫾standard deviation (SD).
Clone-specific real-time PCR.Primer sequences and their annealing locations are listed in Table S2 in the supplemental material. The clone-specific primers (LcA, LcB, Lc1, Lc2, RcA, RcB, Rc1, and Rc2) were designed based on the rhesus genome sequence at the vicinity of the VIS, and the general primers specific to vector DNA (LgA, LgB, LgC, Lg1, Lg2, Lv1, Lv2, LgF, RgR, RgA, RgB, RgC, Rg1, Rg2, Rv1, and Rv2) were designed based on the vector DNA sequences. To obtain accurate quantitative measurements, the clone-specific primers (Lc1, Lc2, Rc1, and Rc2) were chosen after testing six to seven different primers for each junction. Primers were synthesized by Integrated DNA Tech-nologies, Inc. Copy numbers were determined by (i) standard assays and (ii) clonal real-time PCR.
(i) Standard assays.The vector-host DNA junctions of seven chosen clones were cloned to use as copy number standards for individual clone-specific real-time PCRs. The junction DNA was PCR amplified using primers LcA,
LgA, LcB, and LgB for the left junctions and primers RcA, RgA, RcB, and RgB for the right junctions and cloned using TOPO-TA cloning kit (Invitro-gen). The copy number of standard plasmid DNA was calculated based on the DNA concentration measured by a NanoDrop 1000 instrument (Thermo Scientific) and molecular weight of the plasmid. The plasmid DNAs were serially diluted into 20 ng/l rhesus genomic DNA in the range of 100to 106
plasmid copies.
(ii) Clonal real-time PCR.To quantify the total copy number of the clone of interest, a real-time nested-PCR procedure was performed. In the first round of PCR, the target DNA was amplified with 0.5M LgC and Lc1 primers for the left junctions or RgC and Rc1 primers for the right junctions, respectively, using 500 ng of genomic DNA or 100
to 106
copies of clone-specific plasmids for standards under the following conditions: 2 min of preincubation at 94°C, fol-lowed by 16 cycles of 94°C for 25 s, 58°C for 25 s, and 72°C 1.5 min. After purification of the first PCR product using a QIAquick PCR Purification Kit (Qiagen), 1/10 of the eluted DNA was subjected to the second round of PCR using Lg1 and Lc2 primers for the left junctions or Rg1 and Rc2 for the right junctions, respectively, in a 25-l mixture containing iTaq SYBR Green Supermix with ROX (6-carboxy-X-rhodamine; Bio-Rad). All reactions were performed on an IQ-5 real-time PCR detection system (Bio-Rad) under the following conditions: 1.5 min of preincubation at 94°C, followed by 40 cycles of 95°C for 10 s, 58°C for 20 s, and 72°C for 30 s. Total vector copies were also measured by the identical real-time PCR procedure described above, except that internal primer sets, Lv1 and Lv2 for the left junctions and Rv1 and Rv2 for the right junctions, respectively, were used instead of clone-specific prim-ers. All the real-time PCRs were conducted in parallel with standard assays using serially diluted clone-specific standard plasmids. The total copy number of the target junction DNA was determined in reference to the clone-specific standard curve.
RESULTS
Quantitative sequencing of different lengths of DNA.
Popu-lar VIS sequencing methods, such as LM-PCR, INV-PCR,
and LAM-PCR, use restriction enzymes to generate different
lengths of vector-host junction DNA (VIS DNA). The
recov-ery of integration sites relies on the genomic distribution of
restriction enzyme sites as only a fraction of VIS that generate
short VIS DNA may be efficiently amplified by PCR (10). To
test the efficiency of 454 pyrosequencing for VIS sequences of
various lengths, two control experiments were performed (Fig.
1a to c). First, 15 DNA clones ranging in size from 125 bp to
1,680 bp were mixed in the same molar ratios and subjected to
454 pyrosequencing. Although all DNA clones were
detect-able, sequence frequencies were severely biased by the length
of DNA. Sequence frequencies assayed for DNA clones of
ⱕ
488 bp were relatively even, but the efficiency dropped for
longer DNA clones under the current experimental conditions
(Fig. 1a). Second, to test the accuracy of our quantification
method, four different VIS DNA clones (188, 279, 494, and
1,104 bp) were serially diluted and mixed with a pool of VIS
DNA from CD34
⫹HPSC that were acutely infected with
len-tivirus vectors (Fig. 1b). Diluted samples were subjected to the
first PCR step of the LM-PCR procedure (see Fig. 2a) and
sequenced in parallel. The sequencing results showed that the
relative frequencies of three control VIS DNAs of
⬍
500 bp in
different dilutions showed a linear correspondence to the
di-lution factor (correlation
␥
ranging from 0.989 to 0.999) (Fig.
1c). The longer DNA clone (1,104 bp control VIS DNA)
showed a weak positive correlation to the dilution factor, and
its sequence frequency was 10 to 100 times lower than that of
the other controls. These experiments demonstrate that 454
pyrosequencing accurately enumerates DNA of
⬍
500 bp but is
unsuitable for quantifying larger sequences.
on November 8, 2019 by guest
http://jvi.asm.org/
Vector integration site sequencing for repopulating
nonhu-man primate HPSC clones.
Current VIS sequencing methods
analyze only one of two vector-host DNA junctions at a time.
To improve the chance to detect vector integrants, we
devel-oped a novel bidirectional method with which both the left and
the right junctions of the same vector integrant can be
concur-rently analyzed in a single experiment (Fig. 1d and Fig. 2a).
The two junctions were concurrently processed and amplified
by either INV-PCR or LM-PCR with modifications. We used
Taq
␣I (TCGA) enzyme to fragmentize genomic DNA. When
random VIS were modeled for the conventional one-directional
VIS analysis using Taq
␣I, only about 22% of random vector
in-tegrants generated VIS DNA of
⬍
500 bp. However, when
ran-dom integrants were analyzed with the bidirectional approach,
about 40.3% generated VIS DNA of
⬍
500 bp at either one of
two junctions (Fig. 1e).
We tested the technique by analyzing repopulation of HPSC
following transplant in a nonhuman primate. A rhesus
macaque (95E132) was transplanted 10 years ago with autologous
CD34
⫹cells following
ex vivo
transduction with
self-inactivat-ing lentiviral vectors (3). The animal has maintained stable
marking in all hematopoietic lineages to date without adverse
effects. Peripheral blood cells (PBC) collected from the animal
at four time points over 9 years as well as from acutely infected
CD34
⫹HPSC, as a control sample, were subjected to the
assay. Two independent experiments were conducted on the
same sample to test assay conditions and reproducibility.
Dur-ing the analyses, the left junctions were amplified by the
mod-ified INV-PCR method (Fig. 2a, both experiments), and the
right junctions were amplified by the INV-PCR (experiment 1)
or by the modified LM-PCR (experiment 2). When
PCR-am-plified VIS DNA clones from PBC samples were visualized by
QIAEXEL capillary electrophoresis analysis (Fig. 2b), various
intensities of distinctive bands in the range of 150 to 2,000 bp
were observed, reflecting differential clonal expansions. The
band patterns of experiments 1 and 2 were similar for the left
and right junctions, demonstrating the consistency of VIS
am-plification by either INV-PCR or LM-PCR. In contrast, VIS
DNA from acute infection appeared more uniformly
distrib-uted, except DNA bands resulting from long terminal repeat
(LTR) circles.
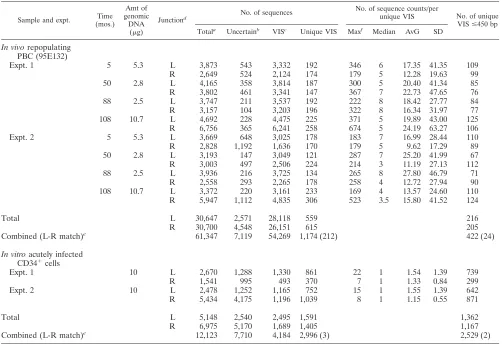
As observed by VIS DNA band patterns, sequence counts
for individual unique VIS showed dissimilar patterns between
PBC and acutely infected cells. After pyrosequencing of VIS
DNA from PBC at four time points, 28,118 and 26,151 VIS
sequences were obtained from the left and the right
vector-host junctions, respectively, and a total of 562 and 616 unique
VIS, respectively, were identified (Table 1; see also data files in
the supplemental material). Sequence counts for individual
VIS were highly variable, ranging from 1 to 674 sequences per
unique VIS (with 11.2
⫾
27.1 [SD] to 27.8
⫾
46.8 sequences on
average, depending on the junctions and time points),
indicat-FIG. 1. Quantitative sequencing via pyrosequencing-based, bidirectional vector integration site analysis. (a) Sequencing efficiency for different
lengths of DNA. The sequencing efficiency dropped for DNA of
⬎
500 bp but was relatively stable for DNA of
ⱕ
500 bp when 15 control DNAs
(lengths ranging from 125 to 1,680 bp) were tested by the 454 pyrosequencing. (b and c) Analysis of the serially diluted control VIS DNA showed
linear correspondence of the relative sequence frequencies to the dilution factor for DNA of
⬍
500 bp. A mixture of four control VIS DNAs was
serially diluted and mixed with the VIS DNA from acutely infected cells (b). Panel B shows a 2% agarose gel run after the second PCR. Lanes
1 to 7, 2-fold serial dilutions of the control DNAs; lane N, water; lane M, 2-log DNA marker; dark arrows, four control VIS DNA; empty arrows,
internal control (vector, LTR circles from acute infection). The relative sequence counts of the control VIS DNAs of
⬍
500 bp are in linear
correlation with the expected values after 2-fold dilution (c). (d) The schematic view of the assay. The bidirectional VIS analysis enabled concurrent
analysis of both the left and the right vector-host DNA junctions. Amplified junction DNA was then subjected to 454 pyrosequencing, followed
by controlled sequence analysis. (e) Percentage of random vector integrants that can generate VIS DNA of
⬍
500 bp. The length of VIS DNA was
determined based on the location of the nearest Taq
␣I site. With the one-directional approach, about 22.6% of random VIS generated VIS DNA
of
⬍
500 bp. With the bidirectional approach, 40.3% could generate VIS DNA of
⬍
500 bp in either one of two directions (upstream or downstream
from the vector).
on November 8, 2019 by guest
http://jvi.asm.org/
FIG. 2. Bidirectional VIS analysis. (a) Schematic diagram outlining the major steps of the two approaches (experiment 1 and experiment 2) for
the bidirectional VIS amplification. See Materials and Methods for a detailed description of the experimental procedures. Oblique arrows indicate
nuclease digestion of single-stranded DNA. Bent arrows indicate Taq
␣I digestion. Ovals and stars (
*
) represent streptavidin beads and 5
⬘
end
biotins, respectively. DNA linkers for experiment 2 are denoted by double purple lines. (b) QIAEXEL capillary electrophoresis analysis.
Bidirectional PCR analysis of acutely infected CD34
⫹cells (Acute Infn) and peripheral blood repopulating cells collected at 5, 50, 88, and 108
months (mos) posttransplant. Left junctions and right junctions were concurrently analyzed by either INV-PCR or LM-PCR during experiment
1 or experiment 2. A 100-bp marker (Mkr) is included in each panel. Arrowheads indicate DNA bands resulting from LTR circles after acute
infection.
on November 8, 2019 by guest
http://jvi.asm.org/
ing differential clonal expansion of certain repopulating clones.
In contrast, the acute infection samples had 2,996 unique VIS
with an average of 1.4
⫾
1.1 sequences per unique VIS,
indi-cating no major clonal expansions of transduced cells after
random vector integration.
Controlled sequence frequency analysis to calculate the
quantities of individual clones.
Selective amplification and
se-quencing efficiency for DNA of
⬍
500 bp was observed in our
control analyses, and rhesus PBC samples showed similar
re-sults. A total of 39.3 to 61.8% of unique VIS DNA clones were
⬍
500 bp, accounting for 54.1 to 86.2% of total VIS sequences
(Fig. 3 and Table 1). There was no notable sequence frequency
bias among VIS DNA of
⬍
500 bp; VIS DNA clones of
⬎
500
bp had lower frequencies, consistent with our reconstitution
studies using cloned DNA (Fig. 1a to c). Hence, we used VIS
DNA of
⬍
500 bp to estimate the relative frequencies of
indi-vidual vector integrants. The number of unique VIS selected
for quantitative analysis ranged from 67 to 125 depending on
the left/right junction type and time points analyzed, but we did
not see significant differences between results from
experi-ments 1 and 2 (95.4
⫾
17.7 versus 96.6
⫾
20.6, respectively) or
between the left and the right junctions (95.4
⫾
21.3 versus
96.6
⫾
16.9, respectively).
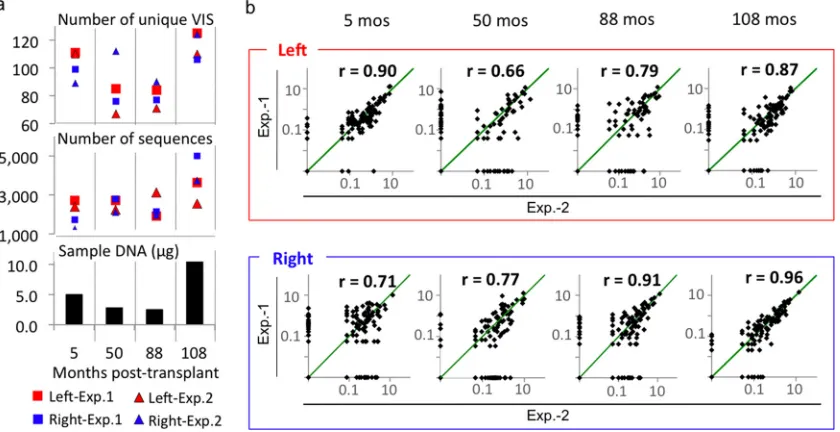
We tested the reproducibility of this analysis by comparing
VIS frequencies between experiments 1 and 2. Pearson’s
prod-uct-moment coefficient (
r
) was calculated for the two
experi-ments at each vector-host junction for samples obtained at four
different posttransplant time points. The correlation between
experiments ranged from 0.66 to 0.96, depending on the time
points and junctions, and may be attributed to differences in
the amount of genomic DNA and sequencing intensity (Fig. 4).
The experimental correlation declined when fewer than
2,000 VIS sequences were present or when less than 5
g of
genomic DNA was used. The highest correlation (
r
⫽
0.96)
was observed for the right junction of PBC of 108 months,
for which 6,241 (experiment 1) and 4,835 (experiment 2)
sequences were generated from 10.7
g of genomic DNA.
Since the overall marking efficiency was maintained at a
relatively constant level (data not shown), the amount of
genomic DNA is a reflection of the absolute number of
vector integrants in the sample (3.8
⫻
10
4to 4.8
⫻
10
4 [image:6.585.42.544.80.427.2]vector copies per
g of DNA). Hence, these results indicate
TABLE 1. Summary of VIS sequence analysis
Sample and expt. Time (mos.)
Amt of genomic
DNA (g)
Junctiond No. of sequences
No. of sequence counts/per
unique VIS No. of unique VISⱕ450 bp Totala
Uncertainb
VISc
Unique VIS Maxf
Median AvG SD
In vivo
repopulating
PBC (95E132)
Expt. 1
5
5.3
L
3,873
543
3,332
192
346
6
17.35
41.35
109
R
2,649
524
2,124
174
179
5
12.28
19.63
99
50
2.8
L
4,165
358
3,814
187
300
5
20.40
41.34
85
R
3,802
461
3,341
147
367
7
22.73
47.65
76
88
2.5
L
3,747
211
3,537
192
222
8
18.42
27.77
84
R
3,157
104
3,203
196
322
8
16.34
31.97
77
108
10.7
L
4,692
228
4,475
225
371
5
19.89
43.00
125
R
6,756
365
6,241
258
674
5
24.19
63.27
106
Expt. 2
5
5.3
L
3,669
648
3,025
178
183
7
16.99
28.44
110
R
2,828
1,192
1,636
170
179
5
9.62
17.29
89
50
2.8
L
3,193
147
3,049
121
287
7
25.20
41.99
67
R
3,003
497
2,506
224
214
3
11.19
27.13
112
88
2.5
L
3,936
216
3,725
134
265
8
27.80
46.79
71
R
2,558
293
2,265
178
258
4
12.72
27.94
90
108
10.7
L
3,372
220
3,161
233
169
4
13.57
24.60
110
R
5,947
1,112
4,835
306
523
3.5
15.80
41.52
124
Total
L
30,647
2,571
28,118
559
216
R
30,700
4,548
26,151
615
205
Combined (L-R match)
e61,347
7,119
54,269
1,174 (212)
422 (24)
In vitro
acutely infected
CD34
⫹cells
Expt. 1
10
L
2,670
1,288
1,330
861
22
1
1.54
1.39
739
R
1,541
995
493
370
7
1
1.33
0.84
299
Expt. 2
10
L
2,478
1,252
1,165
752
15
1
1.55
1.39
642
R
5,434
4,175
1,196
1,039
8
1
1.15
0.55
871
Total
L
5,148
2,540
2,495
1,591
1,362
R
6,975
5,170
1,689
1,405
1,167
Combined (L-R match)
e12,123
7,710
4,184
2,996 (3)
2,529 (2)
a
Total number of sequences that passed filtering after pyrosequencing.
b
Uncertain sequences include low-quality sequences and vector sequences.
c
Authenticated VIS sequences (vector DNA joined to cellular DNA).
d
Analyzed vector-cellular DNA junctions L, left; R, right.
e
Number of VIS pairs from the left and the right junctions originating from the same vector integrant. The number of matches is shown in parentheses.
f
Max, maximum.
on November 8, 2019 by guest
http://jvi.asm.org/
that both the amount of sample (vector copies) and the
sequencing intensity are important factors for the sensitivity
as well as the reproducibility of the assay.
To achieve reliability in clonal frequency analysis, sequence
data from experiments 1 and 2 were combined so that the
analysis could be based on a sufficient DNA sample and VIS
sequence count (total of
⬎
2
⫻
10
5vector copies and
⬎
3,000
VIS sequences). Individual vector integrants were quantified
based on the relative sequence frequencies available at either
one of the two junctions (Fig. 5a). At this step, the frequency
for each vector integrant was calculated as a fraction of only
the quantifiable rather than total vector integrants. Hence,
assuming that 40% of total vector integrants were quantifiable,
we estimated a 2.56-fold overestimation for the calculated
fre-quencies (Fig. 5b). Hence, we adjusted them with this
com-pensation factor (1/2.56
⫽
0.39) and present these adjusted
frequencies as the percentage of total vectors or total marked
cells (Fig. 5c and d).
Differential and polyclonal repopulation in a rhesus
macaque.
At any given time point, the frequencies of individual
vector integrants were markedly different, ranging from 0.002%
to 3.2% of total and averaging 0.37 to 0.53%, depending on the
time points (Fig. 5c). Furthermore, the relative frequencies of
individual vector integrants changed across the four time
points. Of the 401 analyzed vector integrants, 239 (60%) were
identified at multiple time points and were relatively frequent
(average, 0.16%) compared to those that appeared at only one
time point (162 vector integrants with a 0.02% frequency
av-erage), suggesting that large numbers of clonal populations
were circulating in the blood, frequently under the detection
limit, with dynamic and heterogeneous kinetics. Thus, the new
assay can detect subtle clonal frequency changes over time and
analyze a large number of clones in parallel.
To further validate the assay, seven clones were chosen for
clone-specific real-time PCR (Fig. 5c and d). Copy numbers of
the left or the right vector-host junctions were determined and
normalized by total vector integrant at each time point. The
majority of clones had a strong correlation between the new
assay and the real-time PCR result (
␥
greater than 0.9) (Fig.
5d), demonstrating accurate clonal frequency detection by the
quantitative VIS sequencing assay.
DISCUSSION
We have described a new system for accurate and
high-throughput, parallel quantification of individual clones in a
complex polyclonal cell population. Hundreds of repopulating
clones in a rhesus macaque, transplanted with lentivirus
vector-transduced autologous HPSC, were quantified at four time
points over 9 years posttransplant. The novel bidirectional VIS
PCR method enabled concurrent analysis of both the left and
the right vector-host junctions. Through a relatively simple
process, we increased the capacity of clonal analysis by nearly
2-fold. Furthermore, this method significantly improved the
sequence enumeration process during VIS sequence analysis
by using the two data sets from each junction to validate each
FIG. 3. Sequence frequency distribution for different lengths of VIS DNAs. The length of VIS DNA was calculated based on the distance
of the nearest Taq
␣I site from the junction added to 50 bp of vector DNA. Individual VIS were distributed primarily from 25 to 450 bp.
on November 8, 2019 by guest
http://jvi.asm.org/
other, enabling identification of the correct VIS sequences
among error-containing similar sequences. Under our
experi-mental conditions, PCR amplification and sequencing were
efficient for VIS DNA of
⬍
500 bp. Hence, we focused on the
portion of the vector integrants that can be detected without
the DNA length-associated bias. Using the described analysis,
we were able to detect vector-marked clones with frequencies
of
ⱖ
0.002%, equivalent to 1/150,000 PBC of the 108-month
sample, with a vector marking frequency of 32% (data not
shown). Due to the sensitivity of the assay, we were able to
detect a wide variety of different frequencies of repopulating
clones in the circulating PBC. Clonal frequencies detected
at each time point were confirmed by clone-specific
real-time PCR.
Compared to Southern blot analysis, VIS sequencing is more
sensitive and allows for a higher-throughput clonality analysis
by counting VIS sequences. With conventional chain
termina-tion sequencing, there are many experimental steps that may
have different efficiencies for different lengths of target DNA,
including PCR, cloning of VIS DNA, and transformation for
plasmid DNA purification. Simple VIS sequence enumeration
without considering these factors may have caused the poor
representation of clonal frequencies reported by Harkey et al.
(15). 454 Pyrosequencing significantly simplified the VIS
anal-ysis procedure by circumventing cloning and bacterial culture
steps using the innovative emPCR step, in which individual
VIS DNA can be captured and amplified separately in a
water-in-oil mixture prior to pyrosequencing. When
ligation-medi-ated PCR (LM-PCR or INV-PCR) and 454 pyrosequencing
are used, PCR is the major limiting step determining the
effi-ciency of competitive sequencing of multiple VIS DNA. We
did not observe the DNA length-associated bias at the
se-quencing step. Hence, application of simple analysis criteria,
by which unreliable sequence frequency data are removed
from the analysis, significantly improved the reliability of VIS
quantification. In addition, we also observed that the amount
of sample DNA and the intensity of sequencing were
impor-tant factors influencing the sensitivity and the reliability of
quantitative measurement. In our analysis, a high
reproduc-ibility was observed when 5 to 10
g of genomic DNA
(con-taining 2
⫻
10
5to 5
⫻
10
5copies of vector integrants) was used
for the analysis. Considering that generally 1 ng to 1
g of
genomic DNA was used in previous studies (5, 15, 20, 31, 36),
the amount we used may have allowed more reliable analysis of
vector integrants. After accounting for these factors, we were
able to reliably determine the relative quantities of 398 clones,
corresponding to 40% of the total expected vector integrants,
at four posttransplant time points.
[image:8.585.84.504.70.286.2]The system we demonstrate here is a sensitive, accurate,
and high-throughput assay. It can perform parallel analyses
of multiple samples, generating data that may be equivalent
to hundreds of clone-specific real-time PCRs. Here, our
primary purpose was validation of the methodology, so only
a few samples from one animal were analyzed. With
accu-mulation of sufficient data at multiple time points in more
animals, in-depth characterization of primate HPSC
en-graftment and repopulation kinetics would be achievable at
the clonal level. Furthermore, this system is also a useful
tool for the development of efficient and safe retrovirus
vectors to test the effects of insertional mutagenesis or the
effects of the vector components, such as therapeutic transgenes,
promoters, enhancers, and other noncellular elements. The assay
can be further developed and easily adapted for use in the clinic
as the efficiency and the safety of stem cell-based gene therapies
FIG. 4. Sequence frequency analysis for unique VIS of
⬍
450 bp. (a) Both the amount of sample DNA and the number of available VIS
sequences influence detection of unique VIS. The number of unique VIS and the number of VIS sequences from the left (red) and the right (blue)
junctions generated by experiment 1 or experiment 2 as well as the amount of genomic DNA used in the analysis were displayed at each time point.
(b) Reproducibility of the assay. The relative frequencies (percentage of total sequences for VIS DNA of
⬍
500 bp) for individual sites from the
two experiments were plotted on logarithmic scales. Reproducibility was tested using a Pearson product-moment correlation coefficient (
r
). Green
diagonal lines indicate complete frequency match (
r
⫽
1). Higher correlation was observed when
⬎
5
g of genomic DNA and
⬎
2,000 VIS
sequences were used for the analysis (PBC from 5 months and 108 months, respectively).
on November 8, 2019 by guest
http://jvi.asm.org/
rely heavily on the understanding and monitoring of normal and
abnormal growth of engineered stem cells in the recipient.
ACKNOWLEDGMENTS
This study was partly funded by the NIH (AI055281-06A2 and
CA68859), the California Institute of Regenerative Medicine
(RS1-00172-01), and the UCLA AIDS Institute/Center for AIDS Research
(AI28697) and was supported in part by the Intramural Research
Program of the National Heart, Lung, and Blood Institute, NIH.
We thank Cynthia Dunbar and her research group for support and
for helpful discussions. We thank the NIH veterinary and animal
support staff at 5 Research Court and the animal facility in Poolesville,
MD, for maintaining animals over the years. We thank Rina Lee
(University of California—Los Angeles) for editorial support.
REFERENCES
1.Aiuti, A., F. Cattaneo, S. Galimberti, U. Benninghoff, B. Cassani, L. Calle-garo, S. Scaramuzza, G. Andolfi, M. Mirolo, I. Brigida, A. Tabucchi, F. Carlucci, M. Eibl, M. Aker, S. Slavin, H. Al-Mousa, A. Al Ghonaium, A. Ferster, A. Duppenthaler, L. Notarangelo, U. Wintergerst, R. H. Buckley, M. Bregni, S. Marktel, M. G. Valsecchi, P. Rossi, F. Ciceri, R. Miniero, C. Bordignon, and M.-G. Roncarolo.2009. Gene therapy for immunodeficiency due to adenosine deaminase deficiency. N. Engl. J. Med.360:447–458. 2.Aiuti, A., S. Slavin, M. Aker, F. Ficara, S. Deola, A. Mortellaro, S. Morecki,
G. Andolfi, A. Tabucchi, F. Carlucci, E. Marinello, F. Cattaneo, S. Vai, P.
Servida, R. Miniero, M. G. Roncarolo, and C. Bordignon.2002. Correction of ADA-SCID by stem cell gene therapy combined with nonmyeloablative conditioning. Science296:2410–2413.
3.An, D. S., S. K. P. Kung, A. Bonifacino, R. P. Wersto, M. E. Metzger, B. A. Agricola, S. H. Mao, I. S. Y. Chen, and R. E. Donahue.2001. Lentivirus vector-mediated hematopoietic stem cell gene transfer of common gamma-chain cytokine receptor in rhesus macaques. J. Virol.75:3547–3555. 4.An, D. S., R. P. Wersto, B. A. Agricola, M. E. Metzger, S. Lu, R. G. Amado,
I. S. Y. Chen, and R. E. Donahue.2000. Marking and gene expression by a lentivirus vector in transplanted human and nonhuman primate CD34⫹cells. J. Virol.74:1286–1295.
5.Cartier, N., S. Hacein-Bey-Abina, C. C. Bartholomae, G. Veres, M. Schmidt, I. Kutschera, M. Vidaud, U. Abel, L. Dal-Cortivo, L. Caccavelli, N. Mahl-aoui, V. Kiermer, D. Mittelstaedt, C. Bellesme, N. Lahlou, F. Lefrere, S. Blanche, M. Audit, E. Payen, P. Leboulch, B. l’Homme, P. Bougneres, C. Von Kalle, A. Fischer, M. Cavazzana-Calvo, and P. Aubourg.2009. Hematopoi-etic stem cell gene therapy with a lentiviral vector in X-linked adrenoleu-kodystrophy. Science326:818–823.
6.Cavazzana-Calvo, M., S. Hacein-Bey, G. de Saint Basile, F. Gross, E. Yvon, P. Nusbaum, F. Selz, C. Hue, S. Certain, J.-L. Casanova, P. Bousso, F. L. Deist, and A. Fischer.2000. Gene therapy of human severe combined im-munodeficiency (SCID)-X1 dis. Science288:669–672.
7.Chun, T.-W., L. Carruth, D. Finzi, X. Shen, J. A. DiGiuseppe, H. Taylor, M. Hermankova, K. Chadwick, J. Margolick, T. C. Quinn, Y.-H. Kuo, R. Brook-meyer, M. A. Zeiger, P. Barditch-Crovo, and R. F. Siliciano.1997. Quanti-fication of latent tissue reservoirs and total body viral load in HIV-1 infec-tion. Nature387:183–188.
8.Deichmann, A., S. Hacein-Bey-Abina, M. Schmidt, A. Garrigue, M. H.
Brug-FIG. 5. Determination of relative frequencies for individual clones. (a) Calculation of clonal frequencies. The relative frequencies of VIS DNA
of
⬍
500 bp from the left (x) and the right (y) junction were combined as described and represented as quantifiable vector integrants (QVIs). (b)
The relation between the fraction of QVI in total vector (vertical axis) and expected overestimation (
n
-fold) of individual QVI frequency
(horizontal axis). When 40.3% of vector integrants are QVIs, individual QVI frequencies are 2.56-fold overestimated. (c) Clonal frequency changes
at four time points. The adjusted frequencies for individual QVIs were displayed according to the following color scheme: white to black to red,
representing 0% to 0.1% to 3.1%. The frequency change of the top 15 highest-frequency QVIs was magnified on the right side. Ten of them were
unambiguously mapped onto the rhesus genome (genomic locations are indicated on the right). Among those, seven were further tested with
clone-specific real-time PCR. ND, nondetermined. (d) Clone-specific real-time PCR. The relative frequencies of seven QVIs were confirmed by
clone-specific real-time PCR. Dark bars denote the adjusted relative frequencies determined by quantitative VIS sequencing. The values obtained
by clone-specific real-time PCR (percentage of total vector copies) at the right junction and at the left junction of the vector integrants are shown
with yellow and green bars, respectively.
on November 8, 2019 by guest
http://jvi.asm.org/
[image:9.585.63.524.68.368.2]man, J. Hu, H. Glimm, G. Gyapay, B. Prum, C. C. Fraser, N. Fischer, K. Schwarzwaelder, M.-L. Siegler, D. de Ridder, K. Pike-Overzet, S. J. Howe, A. J. Thrasher, G. Wagemaker, U. Abel, F. J. T. Staal, E. Delabesse, J.-L. Villeval, B. Aronow, C. Hue, C. Prinz, M. Wissler, C. Klanke, J. Weissen-bach, I. Alexander, A. Fischer, C. von Kalle, and M. Cavazzana-Calvo.2007. Vector integration is nonrandom and clustered and influences the fate of lymphopoiesis in SCID-X1 gene therapy. J. Clin. Invest.117:2225–2232. 9.Dick, J. E., M. C. Magli, D. Huszar, R. A. Phillips, and A. Bernstein.1985.
Introduction of a selectable gene into primitive stem cells capable of long-term reconstitution of the hemopoietic system of W/Wv mice. Cell42:71–79. 10.Gabriel, R., R. Eckenberg, A. Paruzynski, C. C. Bartholomae, A. Nowrouzi, A. Arens, S. J. Howe, A. Recchia, C. Cattoglio, W. Wang, K. Faber, K. Schwarzwaelder, R. Kirsten, A. Deichmann, C. R. Ball, K. S. Balaggan, R. J. Yanez-Munoz, R. R. Ali, H. B. Gaspar, L. Biasco, A. Aiuti, D. Cesana, E. Montini, L. Naldini, O. Cohen-Haguenauer, F. Mavilio, A. J. Thrasher, H. Glimm, C. von Kalle, W. Saurin, and M. Schmidt.2009. Comprehensive genomic access to vector integration in clinical gene therapy. Nat. Med. 15:1431–1436.
11.Gerrits, A., B. Dykstra, O. J. Kalmykowa, K. Klauke, E. Verovskaya, M. J. C. Broekhuis, G. de Haan, and L. V. Bystrykh.2010. Cellular barcoding tool for clonal analysis in the hematopoietic system. Blood115:2610–2618. 12.Hacein-Bey-Abina, S., A. Garrigue, G. P. Wang, J. Soulier, A. Lim, E.
Morillon, E. Clappier, L. Caccavelli, E. Delabesse, K. Beldjord, V. Asnafi, E. MacIntyre, L. Dal Cortivo, I. Radford, N. Brousse, F. Sigaux, D. Moshous, J. Hauer, A. Borkhardt, B. H. Belohradsky, U. Wintergerst, M. C. Velez, L. Leiva, R. Sorensen, N. Wulffraat, S. Blanche, F. D. Bushman, A. Fischer, and M. Cavazzana-Calvo.2008. Insertional oncogenesis in 4 patients after ret-rovirus-mediated gene therapy of SCID-X1. J. Clin. Invest.118:3132–3142. 13.Hacein-Bey-Abina, S., F. Le Deist, F. Carlier, C. Bouneaud, C. Hue, J.-P. De Villartay, A. J. Thrasher, N. Wulffraat, R. Sorensen, S. Dupuis-Girod, A. Fischer, E. G. Davies, W. Kuis, L. Leiva, and M. Cavazzana-Calvo.2002. Sustained correction of X-linked severe combined immunodeficiency by ex vivo gene therapy. N. Engl. J. Med.346:1185–1193.
14.Hacein-Bey-Abina, S., C. Von Kalle, M. Schmidt, M. P. McCormack, N. Wulffraat, P. Leboulch, A. Lim, C. S. Osborne, R. Pawliuk, E. Morillon, R. Sorensen, A. Forster, P. Fraser, J. I. Cohen, G. de Saint Basile, I. Alexander, U. Wintergerst, T. Frebourg, A. Aurias, D. Stoppa-Lyonnet, S. Romana, I. Radford-Weiss, F. Gross, F. Valensi, E. Delabesse, E. Macintyre, F. Sigaux, J. Soulier, L. E. Leiva, M. Wissler, C. Prinz, T. H. Rabbitts, F. Le Deist, A. Fischer, and M. Cavazzana-Calvo. 2003. LMO2-associated clonal T cell proliferation in two patients after gene therapy for SCID-X1. Science302: 415–419.
15.Harkey, M. A., R. Kaul, M. A. Jacobs, P. Kurre, D. Bovee, R. Levy, and C. A. Blau.2007. Multiarm high-throughput integration site detection: limitations of LAM-PCR technology and optimization for clonal analysis. Stem Cells Dev.16:381–392.
16.Howe, S. J., M. R. Mansour, K. Schwarzwaelder, C. Bartholomae, M. Hu-bank, H. Kempski, M. H. Brugman, K. Pike-Overzet, S. J. Chatters, D. de Ridder, K. C. Gilmour, S. Adams, S. I. Thornhill, K. L. Parsley, F. J. T. Staal, R. E. Gale, D. C. Linch, J. Bayford, L. Brown, M. Quaye, C. Kinnon, P. Ancliff, D. K. Webb, M. Schmidt, C. von Kalle, H. B. Gaspar, and A. J. Thrasher.2008. Insertional mutagenesis combined with acquired somatic mutations causes leukemogenesis following gene therapy of SCID-X1 pa-tients. J. Clin. Invest.118:3143–3150.
17.Jordan, C. T., and I. R. Lemischka.1990. Clonal and systemic analysis of long-term hematopoiesis in the mouse. Genes Dev.4:220–232.
18.Keller, G., C. Paige, E. Gilboa, and E. F. Wagner.1985. Expression of a foreign gene in myeloid and lymphoid cells derived from multipotent haema-topoietic precursors. Nature318:149–154.
19.Kim, S., Y. Kim, T. Liang, J. S. Sinsheimer, and S. A. Chow.2006. A high-throughput method for cloning and sequencing human immunodefi-ciency virus type 1 integration sites. J. Virol.80:11313–11321.
20.Kuramoto, K., D. A. Follmann, P. Hematti, S. Sellers, B. A. Agricola, M. E. Metzger, R. E. Donahue, C. von Kalle, and C. E. Dunbar.2004. Effect of chronic cytokine therapy on clonal dynamics in nonhuman primates. Blood 103:4070–4077.
21.Margulies, M., M. Egholm, W. E. Altman, S. Attiya, J. S. Bader, L. A. Bemben, J. Berka, M. S. Braverman, Y.-J. Chen, Z. Chen, S. B. Dewell, L. Du, J. M. Fierro, X. V. Gomes, B. C. Godwin, W. He, S. Helgesen, C. H. Ho, G. P. Irzyk, S. C. Jando, M. L. I. Alenquer, T. P. Jarvie, K. B. Jirage, J.-B. Kim, J. R. Knight, J. R. Lanza, J. H. Leamon, S. M. Lefkowitz, M. Lei, J. Li,
K. L. Lohman, H. Lu, V. B. Makhijani, K. E. McDade, M. P. McKenna, E. W. Myers, E. Nickerson, J. R. Nobile, R. Plant, B. P. Puc, M. T. Ronan, G. T. Roth, G. J. Sarkis, J. F. Simons, J. W. Simpson, M. Srinivasan, K. R. Tartaro, A. Tomasz, K. A. Vogt, G. A. Volkmer, S. H. Wang, Y. Wang, M. P. Weiner, P. Yu, R. F. Begley, and J. M. Rothberg.2005. Genome sequencing in microfabricated high-density picolitre reactors. Nature437:376–380. 22.Mazurier, F., O. I. Gan, J. L. McKenzie, M. Doedens, and J. E. Dick.2004.
Lentivector-mediated clonal tracking reveals intrinsic heterogeneity in the human hematopoietic stem cell compartment and culture-induced stem cell impairment. Blood103:545–552.
23.McKenzie, J. L., O. I. Gan, M. Doedens, J. C. Y. Wang, and J. E. Dick.2006. Individual stem cells with highly variable proliferation and self-renewal prop-erties comprise the human hematopoietic stem cell compartment. Nat. Im-munol.7:1225–1233.
24.Miller, A. D., and G. J. Rosman.1989. Improved Retroviral vectors for gene transfer and expression. Biotechniques7:980–990.
25.Montini, E., D. Cesana, M. Schmidt, F. Sanvito, C. C. Bartholomae, M. Ranzani, F. Benedicenti, L. S. Sergi, A. Ambrosi, M. Ponzoni, C. Doglioni, C. Di Serio, C. von Kalle, and L. Naldini.2009. The genotoxic potential of retroviral vectors is strongly modulated by vector design and integration site selection in a mouse model of HSC gene therapy. J. Clin. Invest.119:964– 975.
26.Naldini, L., U. Blomer, P. Gallay, D. Ory, R. Mulligan, F. H. Gage, I. M. Verma, and D. Trono.1996. In vivo gene delivery and stable transduction of nondividing cells by a lentiviral vector. Science272:263–267.
27.Ott, M. G., M. Schmidt, K. Schwarzwaelder, S. Stein, U. Siler, U. Koehl, H. Glimm, K. Kuhlcke, A. Schilz, H. Kunkel, S. Naundorf, A. Brinkmann, A. Deichmann, M. Fischer, C. Ball, I. Pilz, C. Dunbar, Y. Du, N. A. Jenkins, N. G. Copeland, U. Luthi, M. Hassan, A. J. Thrasher, D. Hoelzer, C. von Kalle, R. Seger, and M. Grez.2006. Correction of X-linked chronic granu-lomatous disease by gene therapy, augmented by insertional activation of MDS1-EVI1, PRDM16 or SETBP1. Nat. Med.12:401–409.
28.Roche Diagnostics. 2007. Amplicon sequencing. Roche Diagnostics GmbH, Mannheim, Germany. http://www.454.com/downloads/protocols /5_AmpliconSequencing.pdf.
29.Schmidt, M., D. A. Carbonaro, C. Speckmann, M. Wissler, J. Bohnsack, M. Elder, B. J. Aronow, J. A. Nolta, D. B. Kohn, and C. von Kalle.2003. Clonality analysis after retroviral-mediated gene transfer to CD34⫹cells from the cord blood of ADA-deficient SCID neonates. Nat. Med.9:463–468. 30.Schmidt, M., K. Schwarzwaelder, C. Bartholomae, K. Zaoui, C. Ball, I. Pilz, S. Braun, H. Glimm, and C. von Kalle.2007. High-resolution insertion-site analysis by linear amplification-mediated PCR (LAM-PCR). Nat. Methods 4:1051–1057.
31.Schmidt, M., P. Zickler, G. Hoffmann, S. Haas, M. Wissler, A. Muessig, J. F. Tisdale, K. Kuramoto, R. G. Andrews, T. Wu, H.-P. Kiem, C. E. Dunbar, and C. von Kalle.2002. Polyclonal long-term repopulating stem cell clones in a primate model. Blood100:2737–2743.
32.Schro¨der, A. R., P. Shinn, H. Chen, C. Berry, J. R. Ecker, and F. Bushman. 2002. HIV-1 integration in the human genome favors active genes and local hotspots.110:521–529.
33.Silver, J., and V. Kerrikatte.1989. Novel use of polymerase chain reaction to amplify cellular DNA adjacent to an integrated provirus. J. Virol.63:1924– 1928. (Erratum,64:3150, 1990.)
34.Stein, S., M. G. Ott, S. Schultze-Strasser, A. Jauch, B. Burwinkel, A. Kinner, M. Schmidt, A. Kramer, J. Schwable, H. Glimm, U. Koehl, C. Preiss, C. Ball, H. Martin, G. Gohring, K. Schwarzwaelder, W.-K. Hofmann, K. Karakaya, S. Tchatchou, R. Yang, P. Reinecke, K. Kuhlcke, B. Schlegelberger, A. J. Thrasher, D. Hoelzer, R. Seger, C. von Kalle, and M. Grez.2010. Genomic instability and myelodysplasia with monosomy 7 consequent to EVI1 activa-tion after gene therapy for chronic granulomatous disease. Nat. Med.16: 198–204.
35.Wang, G. P., C. C. Berry, N. Malani, P. Leboulch, A. Fischer, S. Hacein-Bey-Abina, M. Cavazzana-Calvo, and F. D. Bushman.Dynamics of gene-modified progenitor cells analyzed by tracking retroviral integration sites in a human SCID-X1 gene therapy trial. Blood115:4356–4366.
36.Wang, G. P., A. Garrigue, A. Ciuffi, K. Ronen, J. Leipzig, C. Berry, C. Lagresle-Peyrou, F. Benjelloun, S. Hacein-Bey-Abina, A. Fischer, M. Cavaz-zana-Calvo, and F. D. Bushman.2008. DNA bar coding and pyrosequencing to analyze adverse events in therapeutic gene transfer. Nucleic Acids Res. 36:e49.
on November 8, 2019 by guest
http://jvi.asm.org/