Int. J. Electrochem. Sci., 11 (2016) 7359 – 7369, doi: 10.20964/2016.09.36
International Journal of
ELECTROCHEMICAL
SCIENCE
www.electrochemsci.org
Corrosion Study of Al-Fe (20 wt%) Alloy in Seawater Alkaline
Solutions
J.E. Flores-Chan1,*, A. Torres-Islas2, C. Patiño-Carachure3, G. Rosas1, M.A. Espinosa-Medina4,*
1
Instituto de Investigación en Metalurgia y Materiales, UMSNH, C.P. 58000, Morelia, Mich. México.
2
Facultad de Ciencias Químicas e Ingeniería Mecánica, Universidad Autónoma del Estado de Morelos. C.P. 62209, Cuernavaca, Morelos, México.
3
Facultad de Ingeniería, Universidad Autónoma del Carmen, Campus III, Av. Central S/N, Esq. con Fracc. Mundo Maya, C.P. 24115 MSNH, Ciudad del Carmen, Campeche, México.
4
Facultad de Ingeniería Mecánica, UMSNH, C.P. 58000, Morelia, Mich. México.
*
E-mail: [email protected], [email protected]
Received: 30 May 2016 / Accepted: 8 July 2016 / Published: 7 August 2016
The assessment of corrosion susceptibility of the Al-Fe (20 wt%) alloy in seawater at different alkaline pH values was performed applying potentiodynamic polarization, linear polarization resistance (LPR) and electrochemical impedance spectroscopy (EIS) techniques. The electrochemical results carried out at room temperature showed lower values of the corrosion current density of about 0.008 - 0.0896 mA/cm2. The polarization curves showed the formation of an unstable layer which decreases with the pH increasing. EIS results revealed a corrosion mechanism controlled by the ion transport through the permeable film. Microstructural characterization confirmed the formation of hydroxides phases as corrosion products by increasing the pH and exposure time.
Keywords: Al-Fe (20 wt%) alloy, electrochemical techniques, seawater.
1. INTRODUCTION
Intermetallic compounds within Fe-rich region in the FeAl phase diagram are considered structural materials due to their attractive physical, chemical and mechanical properties combined with low density and low cost [1-3]. However, the intermetallic compounds in the Al-rich portion such as FeAl2, FeAl3, and Fe2Al5 are susceptible to hydrogen environment embrittlement caused by the
reaction of the aluminium and the air humidity according to the following reaction [4, 5]:
From the reaction, has been widely discussed that the hydrogen released provokes cleavages fracture of the intermetallic materials. Also, the cleavages fracture is accentuated with the aluminium content in the alloy. It is important to note that hydrogen environment embrittlement is not essentially a corrosion process, but can enhance. Among the above intermetallic compounds, FeAl3 contains the
highest Al ratio, so it would be expected that the corrosion process in this intermetallic will increase. In the other hand, with increasing corrosion of the material, a greater amount of hydrogen is released.
In the past, the aluminium and its alloys have been proposed to generate hydrogen from the hydrolysis of water for fuel cells applications. Thus, the intermetallic alloys are also considered candidates for hydrogen generation. A circumstance that assists this purpose is that released hydrogen gas from the reaction minimizes the cohesive forces resulting in the breaking down of the material, and then increasing the surface area of the reaction [6, 7]. However, an important feature for the use of aluminium and its alloys is to remove the oxide layer formed by exposing the aluminium in aqueous media [8, 9]. It is known that the thickness and stability of the passive layer depend on the composition of the electrolyte and electrochemical parameters, such as; corrosion potential, Ecorr, corrosion density, icorr, pH, etc. [10, 11]. In this way, a continuous film rupture improves efficiency and kinetics of the corrosion process for hydrogen generation. For this propose, the use of Ca(OH)2 addition has been
utilized in the past [12-15].
Thus, the aim of this study is to investigate the corrosion process in the Al-Fe (20 wt%) alloy using artificial seawater as the electrolyte. To evaluate the effect of pH on the corrosion rate in the intermetallic alloy the seawater was modified reached to an alkaline region by adding Ca(OH)2
promoter. Therefore, the continuous removal of the passive oxide layer was promoted in the alloy with Ca(OH)2 additive to increase the corrosion rate.
2. EXPERIMENTAL
The Al-Fe (20 wt%) alloy was obtained under conventional gravity casting techniques using high purity elements (99.99 wt%). To reveal the microstructure of the alloy was mechanically polished with emery paper, cleaned, and then chemically attacked with the 2% HBF4 and 200 mL H2O solution.
Samples were immersed for 5 seconds applying 10 V in DC potential. The samples for the corrosion tests were prepared according to ASTM G31-72 (1.3 x 1.3 x 1 cm3) standard. Before corrosion tests, the surface of the specimens of each experimental condition was SiC devastated (grade 1500), cleaned with acetone and dried. The corrosive agent was synthetic seawater prepared according to ASTM-D1141-98 standard. To increase the corrosion rate, the pH of seawater was adjusted at 10, 12 and 14 by adding Ca(OH)2, All the reagents used in the seawater preparation were analytical grade.
The electrochemical techniques for corrosion tests were potentiodynamic polarization curves, linear polarization resistance (LPR), and electrochemical impedance spectroscopy (EIS). The tests were performed according to ASTM G5-94, G59-91 and G106-89 standards respectively. The electrochemical cell consisted of three electrodes arrangement; saturated calomel (SCE) as a reference, a graphite bar as a counter electrode and the Al-Fe (20 wt%) alloy samples as working electrode. The arrangement was connected to a potentiostat Gill-AC (ACM Instruments) attached to a computer.
OCP with a scan rate of 1 mV/s. The values of the corrosion current density are calculated using the Tafel extrapolation method taking an extrapolation zone 150 mV versus OCP. Linear polarization resistance (LPR) measurements were performed in the range of -15 to +15 mV at a scan rate of 1 mV/s recording a measurement every 15 min during 24 h. EIS test was developed by applying an excitation signal of ±15 mV vs. open circuit potential, in the frequency range of 10,000 Hz to 0.01 Hz. All tests were performed at room temperature and in triplicate to ensure reproducibility of the experiments. The morphological and chemical characterization of materials was conducted in an X-ray diffractometer (BRUKER D8 ADVANCE). Scanning electron microscopy (SEM) was carried out on a JEOL JSM-7600F with microanalyzer BRUKER model adapted X-Flash 6130.
3. RESULTS AND DISCUSSION
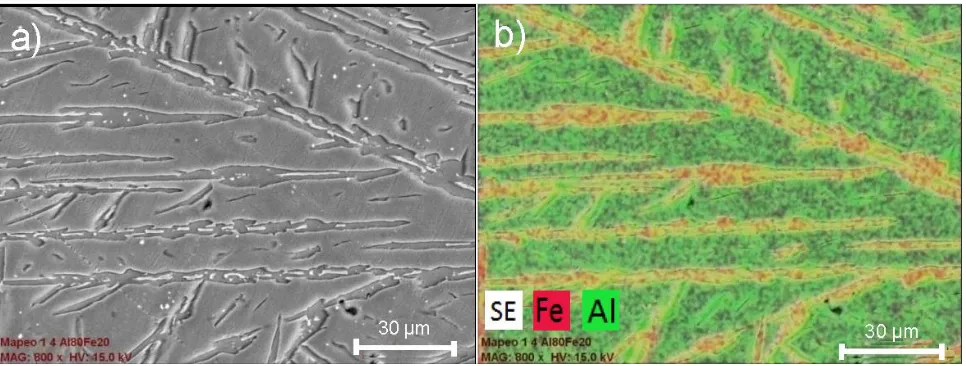
Figure 1. Microstructural characterization of Al-Fe (20 wt%) as-cast alloy: a) SEM micrograph, b) X-ray elements mapping.
[image:3.596.59.542.277.460.2] [image:3.596.179.418.527.724.2]
The observed morphology consists of elongated intermetallic grains and porosities dispersed in the bulk material [16]. EDS chemical maps illustrating the elements distribution is shown in Fig. 1b. It showed the Al and Fe were distributed in two phases. In order to know the structure of both crystallographic phases, an XRD analysis was performed. Fig. 2 shows the XRD pattern that indicates the presence of the Al (Fe) cubic solid solution and Al13Fe4 monoclinic intermetallic compound. These
results are in agreement with the Al-Fe phase equilibrium diagram.
Fig. 3 shows the potentiodynamic polarization curves for the Al-Fe (20 wt%) alloy immersed in artificial seawater at different pH values by Ca(OH)2 addition. As the pH increases, the anodic and
cathodic areas are displacing toward small potential values and high current density values, more accentuated at pH 14 with higher current density values. For pH 10, 12 and 14 the anodic polarization regions were associated with a mechanism of anodic dissolution at potentials near to OCP. A semi-passive region between -796 to -646 mVSCE was observed at pH 10, while at pH 12 and 14 longer
semi-passive region was present from -940 to -480 mV and -910 to -580 mV respectively. However, higher active dissolution was observed at pH 14. In addition, with increasing pH values the icorr increased in one order of magnitude associated with the aluminium dissolution into the activation region.
For pH 10 and 12 there is a semi-passive behaviour attributed to the formation of corrosion products trapped between Fe-Al phases; retarding the ion transfer mechanism at the alloy interface as a resistive barrier. A similar behavior has noted in materials susceptible to pitting corrosion [17]. However, at pH 14 an activation mode was the principal mechanism for over potential near the OCP.
The anodic dissolution mechanism is increased with the pH values when Ca(OH)2 was added
(Fig.3). At pH 10, an active region was formed in the range from OCP to -891 mV showing an icorr of 11.87 x10⁻³ mA/cm2 and a semi-passive region presented at ipass value around 0.1617 mA/cm2.
[image:4.596.53.544.666.754.2]Similarly, at pH 12 and 14 an active region from the OCP observed in the range -940 to -910 mV showing icorr values of 37.2 x10⁻³ and 89.63 x10⁻³ mA/cm2 respectively. Also, a semi-passive region shows ipass values around 0.345 and 0.67 mA/cm2. Instabilities showed in cathodic branches are related to the transformations in mixtures of salts at the beginning and the end of the experiment, attributed to the release of corrosion products formed on the surface of the intermetallic alloy [17, 18]. As in the present study some aluminium alloys, corrosion studies have reported changes in the Tafel slopes of the cathodic polarization curve in aqueous solutions attributed to the rupture of the oxide film formed on the cathodic surface [19, 20].
Table 1. Potentiodynamic polarization parameters for the Al-Fe (20 wt%) alloy tested in seawater at different pH values by Ca (OH)2 adding.
Electrolyte
(Seawater) pH
Ecorr
mV
icorr
mA/cm2
βa mV/decade
βc mV/decade
Seawater 8 -1114 8.0 x10⁻³ 549 465
Seawater + CaOH
10 -1045 11.8 x10⁻³ 407 350
12 -1237 37.2 x10⁻³ 147 124
Table 1 shows the electrochemical parameters obtained from potentiodynamic polarization curves, where the icorr was calculated by the method of extrapolation of Tafel (βa and βc) in the range of ±150 mV vs. OCP. The increasing in current density (icorr) was related to the dissolution process.
Figure 3. Potentiodynamic polarization curves for the Al-Fe (20 wt%) alloy in seawater at different pH values by Ca(OH)2 adding.
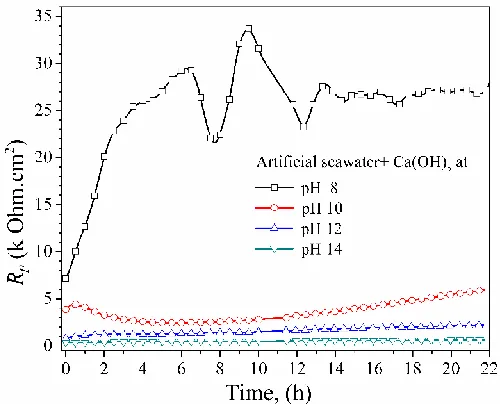
The results obtained from linear polarization resistance (LPR) of the alloy immersed in seawater with the pH effect on the Rp kinetic, are showed in Fig. 4. Ca(OH)2 additive decreased the Rp values in the range 0.1 to 100 kΩ cm2
showing an increase in the corrosion rate. At pH 14, the Rp values were lower attributed to a minimum or unstable corrosion products formed with permeability characteristics, and the passivation-breaking-passivation process caused by seawater composition.
[image:5.596.168.429.150.352.2] [image:5.596.173.423.526.728.2]
From potentiodynamic results, the icorr of the alloy increased slightly from 8 x10⁻³ to 89 x10-3 mA/cm2 with pH by the Ca(OH)2 addition. This variation in current density was attributed to the
instability of the hydrated γ-Al2O3 phase according to the aluminium Pourbaix diagram [21]. At pH 8,
lower icorr values of the alloy were observed, which was confirmed by the increase the values of Rp in the range from 7 to 29 kΩ cm2 for a period ranging from 1 to 6 h. Subsequently, Rp values stay stable around the 26 kΩ cm2 after 12 h of immersion. In the other hand, for pH>8 the solutions show values of Rp up to 5 kΩ. Notably, the alloy at pH 14 showed a maximum Rp around 0.6 kΩ cm2 after 20 h of immersion. These results illustrate a higher anodic dissolution obtained for pH>8 promoting high density of electrochemical reactions with possibilities of produce higher hydrogen liberation. It could be usable for energy conversion in future applications.
[image:6.596.59.537.271.666.2]
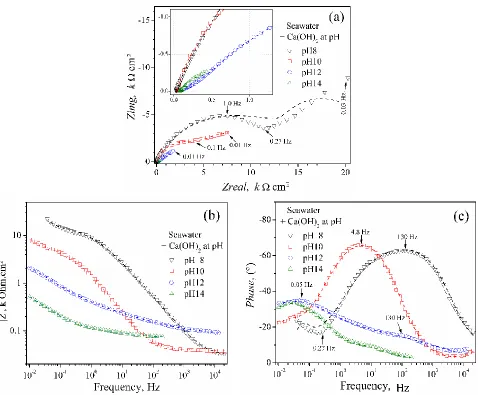
Figure 5. EIS results; a) Nyquist, b) Impedance module, c) Bode phase diagrams.
Fig. 5 shows the EIS results from the immersion of Al-Fe (20 wt%) alloy in seawater at different pH values by adding Ca(OH)2. Fig. 5a is illustrating the Nyquist diagrams. At pH 8 (near to
0.27 Hz) is observed due to the initial surface rough which increased with the anodic dissolution. At pH 10, a capacitive semicircle from high to medium frequencies (up to 0.1 Hz), tending to form a second semicircle at lower frequencies was presented. Nyquist diagrams for pH 12 and 14 show low frequencies and a second opened semicircle with diffusive behavior due to the formation of corrosion products which added to alloy surface. The formation of second opened semicircles was related to the presence of a permeable layer rapidly dissolved at pH>8. The decrease in semicircle diameter at pH 12 and 14 suggest an increase in the current density indicating both formation of stable corrosion products and a process of charge transfer. These results are in good agreement with the polarization curves at low overpotential close to the OCP (Fig. 3). Fig. 5b illustrates at low frequencies the maximum value of impedance module |Z| reaching 20 kΩ cm2 at pH 8. The impedance module for a frequency of 0.01 Hz was approximately 8.1 kΩ cm2
at pH 8 and 10 defining time constants. These results are in agreement with the Nyquist diagrams at the same pH values. The minimum values of the impedance module registered at low frequencies (pH>8) were approximately the same with Rp (see Fig.4). The phase angle determined at high frequencies shows low values related to electrolytic reactions governed by an activation mechanism. At pH 8 and 10, the phase angle is increased at low-frequency values indicating higher stabilities of the corrosion products. This trend is similar to the LPR results showed in Fig. 4.
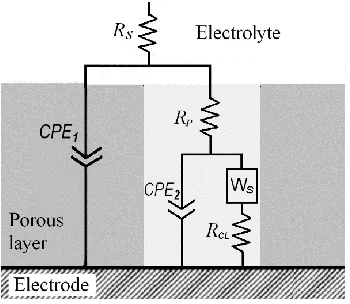
The hydrogen evolution during the electrochemical process [22] correspond to the hydration-dissolution and precipitation of aluminium corrosion products formed at the surface/electrolyte surface promoted by the pH increasing and uncovered substrate sites by the scale spalling [22]. That maintains a constant effective area in contact with the alkaline solution, as showed with EIS results of alloys in both pH 12 and pH 14 solutions. In this sense, the equivalent circuit model (ECM) in Fig. 6 shows analogous representation with electric elements of the corrosion phenomena mechanisms, considering the formation of the porous and defective scale of corrosion products. In the ECM, Rs is the resistance of the electrolyte solution, the arrangement of CPE1 in parallel with Rp is the impedance of the external scale/solution interface. The element CPE2 is the double layer capacitance between metal and electrolyte solution at the pore bottom, as before reported [23]. The RCL is the charge transfer resistance at the alloy surface and the electrolyte into the pore.
Figure 6. Equivalent electrical circuit of the impedance for an electrode with porously corrosion product formation by the Al-Fe (20 wt%) alloys immersed in seawater at different pH values.
) ( 1 ) ( j T Z CPE
CPE (2)
S
R R
Z( ) (3)
CL
f R
Z (4)
P D P D W jT jT Z ) ( ) tanh(
(5) Were:Rs is the electrolyte resistance, TCPE is a constant phase capacitance, α dimensionless potential number (0 < α ≤ 1; while α=1 assumes CPEiis a perfect capacitance Cdl). Angular frequency is , with f = linear frequency, j a complex number √ , and Zf is the Faradaic impedance at the
[image:8.596.212.387.74.226.2]metal/scale interface. Hence, the term TD represents the ratio of scale thickness L and the effective diffusion coefficient Deffof that scale; TD L2Deff1,power is between 0 < P < 1, σ is the constant of diffusion or the modulus of the Warburg resistance.
Table 2. EIS obtained fitting parameter by ECM (Fig. 6) of measured data obtained with the Al-Fe (20 wt%) alloys immersed in seawater at different pH values.
Seawater + Ca(OH)2 pH 8 pH 10 pH 12 pH 14
Rs, (Ω cm2) 24.12 2.12 x10⁻⁷ 78.61 71.26
, (F cm2) 1.59 x10⁻⁵ 7.68 x10⁻⁸ 1.05 x10⁻³ 3.54 x10⁻³
dimensionless 0.69 0.89 0.36 0.56
Rp, (Ω cm2) 20.39 39.11 580.2 76.19
, (F cm2) 1.76 x10⁻⁶ 1.29 x10⁻⁴ 4.85 x10⁻⁴ 4.15 x10⁻³
dimensionless 0.90 0.84 0.62 0.91
σ, (Ω cm2
/s) 8905 7254 27799 1204
TD, (s) 6.273 48.5 6.057 106.5
P, dimensionless 0.620 0.440 0.698 0.304
[image:8.596.62.537.580.748.2]
In accord with the EIS and fitting results, the Rsvalues were minor than 80 Ω cm2. RCL values showed in agreement with the Rp from LPR monuments, were the alloy immersed in the solution at pH 14 showed the lowest values while at pH 8, the highest value was observed. Warburg elements showed lower values, which are associated to more diffusivity between the defective scales of corrosion products, were ionic diffusion found high-density paths across the scale, Table 2. In this sense, defective corrosion product affected the surface area of scale/electrolyte interface; it was associated with the potency factor (α1) of the capacitive constant element CPE1, showing in all cases, α1 values
under of 0.9, particularly at both 12 and 14 pH values around 0.5. The last characteristic promoted a semicircle depreciation explained by Nyquist plots (Fig.5a). On the other hand, the capacitive element at the alloy/scale/pore interface, showed α2 values closer to 0.9, tending to get perfect capacitance behavior.
The fitting parameter of ECM proposed is in accord with the electrochemical experimental results and with the microstructural characterization of surface alloys after the corrosion tests. The capacitance values increased with the pH for the two constant elements (CPE), due its impedance (ZCPE) values diminished and scale density fall also, as discussed before [26]. Last behavior was promoted by the Ca(OH)2 addition in seawater solution.
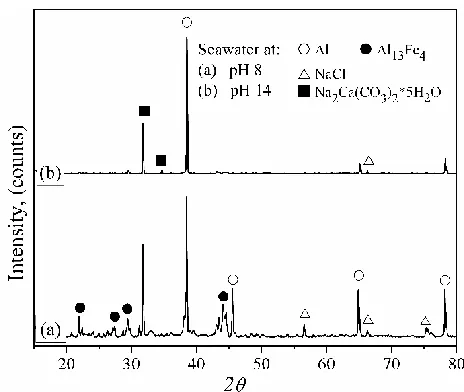
Fig. 7 shows XRD patterns of the sample at pH 8 and 14 exposed to seawater with Ca(OH)2
addition. For sample at pH 8, the same starting phases were observed indicating a weak or not alloy reaction with seawater. By contrast, in the pattern at pH 14, the Na2Ca (CO3)2·5H2O phase and minor
proportions of NaCl compound observed as constituents of seawater are indicating the effect of the pH in the alloy corrosion.
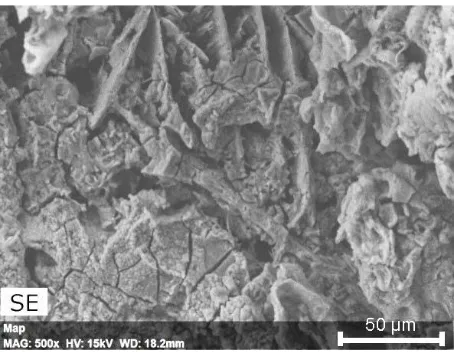
Fig. 8 displays surface images of the alloy exposed to seawater at pH 14. A visible dissolution of the alloy was observed. The aluminium oxide is thermodynamically stable near neutral seawater, showing excellent adhesion to the substrate. Therefore, the aluminium oxide layer is an ideal protective layer [27]. However, the layer can be dissolved in alkaline solution as can be deduced in the present work.
[image:9.596.182.414.538.734.2]
Figure 8. SEM micrograph showing characteristics on the corroded surface of alloy immersed in seawater solution at pH 14.
4. CONCLUSIONS
After the corrosion test on the Al-Fe (20 wt%) alloy immersed in seawater at pH 10, 12 and 14 by Ca(OH)2 additions, the following conclusions are derivate:
The potentiodynamic plots show anodic dissolution and semi-passive behaviour at higher potential values from OCP. With pH increasing the alloy shows higher icorr values.
EIS results from the Nyquist plots with the pH increasing show a semicircle diameter reduction as an indication of the impedance module values are associated to charge transfer control governed by a corrosion mechanism.
The electrochemical properties modified a semi-passive layer forming a defective scale with porous high density accentuated by Ca(OH)2 addition. In this sense, the Rp values of the alloy decreased with pH.
XRD patterns showed the presence of the Na2Ca (CO3)2·5H2O and NaCl compounds identified
as constituents of seawater in the alloy. SEM images indicate the formation of stable surface layers that obstruct and slow the corrosion process. The film growth was due to the ionic migration of Al3+ and O2- through the film thickness, indicating greater dissolution of the alloy by Ca(OH)2.
ACKNOWLEDGEMENTS
J.E. Flores-Chan expresses their gratitude to PRODEP for the financial support granted for the development of this research.
References
[image:10.596.185.412.68.244.2]
2. H. Song, Y. Wu, C. A. Tang, S. Yuan, Q. Gong, and J. Liang, Tsinghua Sci. Technol., 14 (2009) 300-306
3. Ji. Gang, T. Grosdidier, F. Bernard, P. Sebastien, E. Gaffet and L. Sebastien, J. Alloys Comds, 434 (2007) 358-36
4. O. Hernández, F. de la Rosa, A. Bedolla, C. Patiño-Carachure and G. Rosas, Superficies y vacío, 26 (2013) 18-21
5. M. Martinez, B. Viguier, P. Maugis, J. Lacaze, Intermetallics 14 (2006) 1214-1220 6. C. T. Liu, Mater. Chem. Phys. 42 (1995) 77-86
7. R. Akid, Corrosion of Engineering Materials, Handbook of Advanced Materials, Wiley inter-science, United States of America 2004
8. Y. K. Chen, H. T. Teng, T. Y. Lee, H. W. Wang, Int. J. Energy Env. Eng., 5 (2014) 1-6
9. M. Pudukudy, Z. Yaakob, B. Narayanan, R. Ramakrishnan, S. Viswanathan, Int. J. Hydrogen Energy, 37 (2012) 7451-7456.
10. E. A. EI-Wahab, A. H. Marei, O. R. Khalifa, H. A. Mohamed, J. Am. Sci., 6 (2010) 476-486 11. A. Aballe, M. Bethencourt, F. J. Botana, M. Marcos, J. Pérez-Mariscal, Rev. Metal., 34 (1998)
37-41
12. A. A. El-Meligi, International Journal of Hydrogen Energy 36 (2011) 10600-10607
13. L. Soler, A. M. Candela, J. Macanás, M. Muños, J. Casado, J. Power Sources, 192 (2009) 21-26. 14. H. Z. Wang, D. Y. C. Leung, M. K. H. Leung, M. Ni, Renew. Sust. Energ. Rev., 13 (2009)
845-853
15. C. B. Porciúncula, N. R. Marcilio, I. C. Tessaro, M. Gerchmann, Braz. J. Chem. Eng., 29 (2012) 337-348
16. W. John Pridgeon, L EdwardLanger, ASM Handbook, Vol. 9, Metallography and Micro-structures, 9th Edition, Printed in the United States of America, 2004
17. W. J. Lee, S. I. Pyun, Electrochim. Acta 45 (2000) 1901-1910
18. L. Martinez, M. Amaya, J. Porcayo-Calderon, E. J. Lavernia, Mater. Sci. Eng., A, 258 (1998) 306-312
19. M. Amaya, M.A. Espinosa-Medina, J. Porcayo-Calderon, L. Martinez, J. G. Gonzalez-Rodríguez, Mater. Sci. Eng., A, 349 (2003) 12-19
20. K. Nisancioglu, H. Holtan, Electrochim. Acta 24 (1979) 1229-1235
21. M.Pourbaix, Aluminium Atlas of Electrochemical Equilibrium in Aqueous Solutions, Ed Per-gamon, Oxford. 1966.
22. V. Sarou-Kanian, S. Ouazar, P. E. Bocanegra, C. Chauveau, I. Gokalp, Low temperature reactivity of aluminum nanopowders with liquid water, In Proceedings of the 3rd European Combustion Meeting ECM.
23. C. L. Zeng, W. Wang, W. T Wu, Corrosion Sci., 43 (2001) 787-801
24. N.J. Medvedeva, Y.N. Gornostyrev, D.L. Novikov, O.N. Myrasov and A.J. Freeman, Acta Mater. 46 (1998) 3433-3442.
25. Y. L. Zhou, M. Ninomi, T. Akahori, H. Fukui and H. Toda, Mater. Sci. Eng., A, 398 (2005) 28-36. 26. J. R. Macdonald, E. Barsoukov, Impedance spectroscopy: theory, experiment, and applications.
John Wiley and Sons, New Jersey, 2005.
27. F. Rosalbino, S. Delsante, G. Borzone, E. Angeline, Corrosion Sci., 52 (2010) 322-326.