Int. J. Electrochem. Sci., 10 (2015) 3054 - 3064
International Journal of
ELECTROCHEMICAL
SCIENCE
www.electrochemsci.org
Corrosion Behavior of Nanostructure Al-Fe Alloy Processed by
Mechanical Alloying and High Frequency Induction Heat
Sintering
Asiful Hossain Seikh1,*, Muneer Baig1, Hany Rizk Ammar2
1
Centre of Excellence for Research in Engineering Materials, Advanced Manufacturing Institute, King Saud University, P.O. Box -800, Riyadh 11421, Kingdom of Saudi Arabia
2
Metallurgical and Materials Engineering Department, Faculty of Petroleum and Mining Engineering, Suez University, Suez, Egypt
*
E-mail: [email protected]
Received: 25 January 2015 / Accepted: 12 February 2015 / Published: 24 February 2015
In this investigation, Al-10 wt. %Fe alloy was produced from metallic powders processed using mechanical alloying (MA) technique. The initial powders were processed in a planetary ball mill for 10, 30, 70, 100 and 150 hours at room temperature in an inert atmosphere. The processed powders were consolidated and sintered using a high frequency induction heat sintering (HFIHS) machine to form bulk samples. The consolidation pressure, heating rate, temperature and time of sintering were 50MPa, 823K/min, 823K, 6minutes, respectively. The crystallize size of the bulk samples were calculated from the peak profile obtained through X-Ray diffraction (XRD). The smallest crystallite size was found to be 30nm in the sample obtained from the 150 hours milled powders. The sintered samples were investigated for their corrosion behavior at room temperature in 3.5% NaCl solution through two well-known techniques, electrochemical impedance spectroscopy (EIS) and potentiodynamic polarization resistance. The results show that with increase in milling time, the corrosion potential ( corr) moves to a higher positive value with an increase in corrosion current (jcorr)
i.e. corrosion resistance decrease.
Keywords: Nanocrystalline aluminium alloy, mechanical alloying, corrosion, polarization, EIS
1. INTRODUCTION
423K) the strength of the alloys decreases significantly [2]. This puts the limit on the use of aluminum alloys for elevated temperature applications. To increase the strength at elevated temperatures, new processes or modifications are needed in place of traditional /or existing methods. The strength of aluminum alloys can also be increased by alloying aluminum with transition metals (TM). Transition metals enhance the strength of the alloy by forming secondary phases and intermetallics leading to microstructural stability at elevated temperatures [1]. Al-Fe alloys have been an area of interest in the last few years owing to the low diffusivity of Fe in aluminum. The lower diffusivity of Fe in the aluminum matrix ensures microstructural stability even at elevated temperatures by forming secondary phases including super saturated solution. However, there exists a limit of Fe content in Al-Fe alloy if processed using traditional methods. It was observed that the maximum diffusivity of Fe in aluminum matrix is less than 0.03 at. % at elevated temperatures [1]. It is highly desirable to increase the alloying content of Fe beyond the 0.03 at. %. To further increase the solid solubility limits of Fe in Al matrix other non-equilibrium processing techniques such as mechanical alloying (MA) and rapid solidification (RS) must be employed. These non-equilibrium techniques not only extend the solid solubility limit of Fe in Al matrix but also refines the microstructure to ultrafine /or nanometer level with uniform dispersion of oxides and intermetallics. Since the alloys are produced with higher content of Fe and refined microstructure, it is expected that the processed alloy shows improved mechanical and physical properties compared to its traditional counterparts [3-6]. Various parameters that define the morphology of processed powders are the time and type of mill, milling atmosphere, ball to powder weight ratio, grinding medium and process control agents [5]. MA takes place in a high energy ball mill wherein the powder particles are subjected repetitive welding, fracturing, and re-welding of powder particles resulting in fine particles within a fine grained matrix due to high energy impact [3].
In contrast to characterizing the mechanical properties, a limited interest has been shown towards the characterization of the corrosion properties in nanocrystalline materials. The corrosion behavior in nanocrystalline materials is found to be dependent on various other factors such as concentration of the impurity present [6], processing techniques [7, 8], texture of the processed material [9, 10] and environment [11,12] that inherently arise during the processing of nanocryatalline materials. These factors along with refinement of grain size [4, 5] influence the corrosion behavior in such materials. Thus, a direct correlation between the effect of grain size on the corrosion behavior of nanocrystalline materials is difficult to establish and can be studied case by case wherein; the effect of other contributing factors described above can be assumed to remain invariant.
As mentioned above, the corrosion resistance of a material depends on the environment. It is observed that the corrosion resistance of nanocrystalline materials tends to increase in passive and decrease in active environment. However, in the active-passive environment it is observed that the rate of uniform corrosion in nanocrystalline materials tend to supersede the localized corrosion [15]. Similarly, the corrosion resistance of a coarse grained pure material was observed to increase in active environment and decrease in passive environment [16].
The corrosion rate in the nanocrystalline materials also depends on the solubility of the corrosion products. It is observed that the corrosion rate tends to increase if the corrosion products are soluble and decrease in the case of insoluble products [17].
A limited number of investigations have addressed the influence of severe plastic deformation (SPD), a process for refining the grain size of an initial coarse grained material, on the pitting and uniform corrosion in Al-based alloys. A majority of these investigations observed that the corrosion resistance decrease with a decrease in grain size [18-20]. Also, the corrosion resistance in finer grained materials was observed to increase in acidic and alkaline media. However, in neutral electrolytes a slight change in the corrosion resistance was observed [20].
The present study is performed to investigate the influence of grain size on the corrosion behavior of the MA nanocrystalline bulk Al-10 wt.% Fe alloy, obtained through the sintering of milled powders for various milling times, in 3.5% NaCl solution. It is known that 3.5% NaCl solution provide the most corrosive medium for Al and its alloys.
The present study is performed at room temperature using the potentiodynamic polarization and electrochemical impedance spectroscopy (EIS) measurements techniques.
2. EXPERIMENTAL
2.1. Fabrication of ultrafine/nanocrystalline Al -10%Fe alloys
The rate of heating was set to 823 K/min. The sintering temperature was set at 823 K while maintaining a constant pressure of 50 MPa for 6 minutes.
2.2 X-Ray Diffraction (XRD)
The sintered samples of Al-10wt. % Fe alloy was characterized by Discover D8 diffractometer operating in the θ-θ geometry using a Cu-Kα (λ = 0.154nm) radiation. The sample surface was polished
using various grit sand papers with final polishing performed using colloidal silica solution to produce mirror finish surface. The X-ray scanning was performed for a 2θ ranging from 38 to 39 degree with a scanning speed of 5° per minute. The scanning was focused in the small 2θ range to capture the most intensive peak of Al which is at (1 1 1) plane.
2.3. Scanning Electron Microscope (SEM)
The scanning electron microscope (SEM) images for microstructure characterization of the as-mixed and milled powders were obtained from JEOL model JSM-6610LV FESEM.
2.4. Chemicals, Materials, and Electrochemical cell
The electrochemical experiments in this investigation were performed in a 3.5% NaCl solution. A conventional three-electrode cell configuration was used in which Ag/AgCl acted as a reference electrode (RE), the platinum foil as a counter electrode (CE) and the nanocrystalline Al–10 wt. % Fe alloy fabricated in the current investigation formed the working electrode (WE). The preparation of WE involved a series of steps wherein; a blind hole of about 0.5 mm in depth and diameter was drilled on one surface of the alloy. A long copper wire with similar diameter was place in the dilled hole and later soldered to form a rigid joint. The entire assembly was then mounted in an epoxy resin and allowed to cure for 24 hours at room temperature. After curing, the other surface was polished using Buehler MetaServ 250 Twin machine. The surface was later fine polished using colloidal silica solution to produce a scratch free mirror surface.
2.5 Experimental Procedure (linear polarization and the EIS)
simulation method. The linear potentiodynamic polarization curves were obtained by scanning the potential in the forward direction from −0.1 to 0.1V against Ag/AgCl at a scan rate of 1 mV/s.
All the electrochemical experiments were recorded after immersion of the electrode in the test solution at a temperature of (25±1) °
C. Fresh solution and fresh specimens were used after each weep. For each experimental condition, two to three measurements were performed to ensure the reliability and reproducibility of the data.
3. RESULTS AND DISCUSSION 3.1. X-Ray Diffraction (XRD)
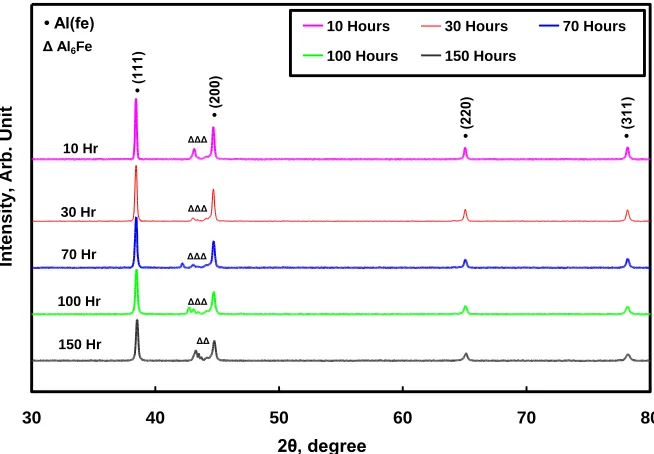
Fig. 1 shows the XRD patterns of Al-10wt. % Fe sintered samples obtained from milled powders for different milling times. It is observed that, with an increase in milling time the Al (1 1 1) peak shifts to higher diffraction angles along with significant broadening. This is being attributed to the grain refinement caused by mechanical alloying. The Al peak at (1 1 1) was used to calculate the average grain (crystallite) size using Debye-Scherrer's equation [24] given by
BCos K
D (1)
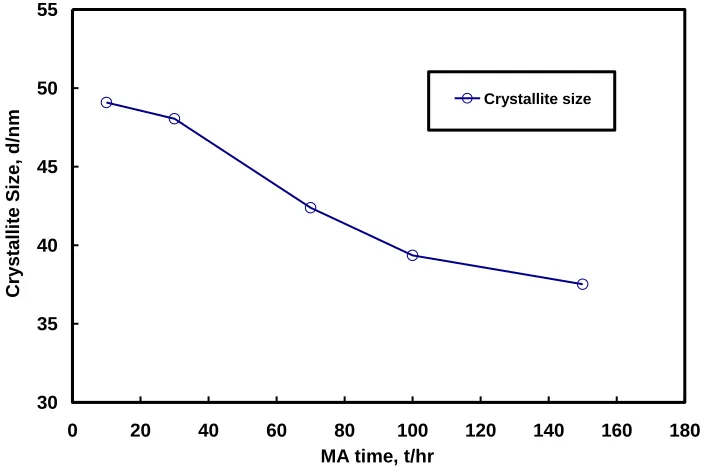
where, D=crystallite size, K=shape factor (assumed to be 0.9) and λ = 0.154nm, the wavelength of Cu-Kα radiation, B indicates to full width at half maximum (FWHM). The variation of crystallite
size with milling time is shown Fig. 2. The smallest average crystallite size was found to be 37 nm in the sample produced using powder milled for 150 hours. From the figure, the formation of Al6Fe
metastable phase is observed during the sintering process.
30 40 50 60 70 80
10 Hours 30 Hours 70 Hours 100 Hours 150 Hours
[image:5.596.137.464.489.716.2]2θ, degree In tensity , Ar b. Uni t • Al(fe) • (111) • (200) • (220) • (311) 10 Hr 30 Hr 70 Hr 100 Hr 150 Hr ΔΔΔ ΔΔΔ ΔΔΔ ΔΔΔ ΔΔ Δ Al6Fe
30 35 40 45 50 55
0 20 40 60 80 100 120 140 160 180
MA time, t/hr
Cr
ys
talli
te Size, d
/n
m
Crystallite size
Figure 2. Variation of crystallite size of the sintered sample with milling time.
3.2. Scanning Electron Microscope (SEM)
Fig. 3a shows the morphology of the as-mixed powders containing a mixture of 90 wt. % of Aluminum and 10 wt. % of Fe. From the figure, it is evident that the as-mixed powders were spherical shaped with an average particle size of 2 µm. Fig. 3b shows the morphology of the milled powders (to 70 hours). From the figure, it is evident that the milled powders were no longer spherical shaped. The change in the morphology of the milled powders could be attribute to the amount of straining that takes place during the milling where the particles are flattened, cold welded, fractured and re-welded. It is also evident from the figure that 1 wt. % of stearic acid (PCA) was not sufficient to inhibit agglomeration of the milled powders.
Figure 3. SEM images of the Al-10wt. % Fe alloy powders (a) as-mixed (b) milled for 70hrs.
[image:6.596.123.475.76.309.2] [image:6.596.92.503.561.721.2]
3.3. Electrochemical Measurements
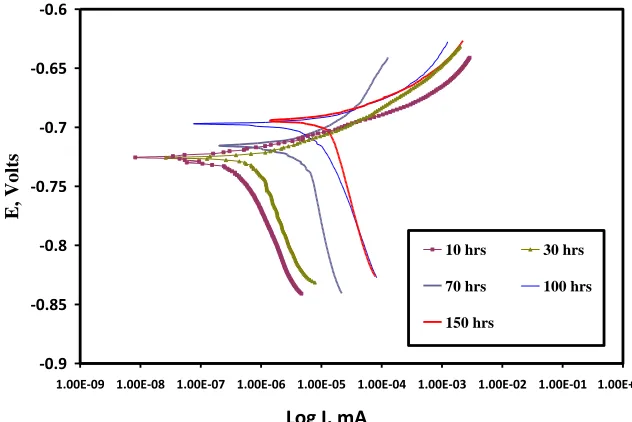
The corrosion behavior of the nanocrystalline sintered alloys, obtained from powders milled for various milling times, were investigated after 1 hour exposure in an aerated 3.5% NaCl solution by linear polarization measurement. Fig. 4 shows the linear potentiodynamic polarization (LPP) curves for the sintered alloy. A similar shape is observed for all samples. The values of cathodic (βc) and
anodic (βa) Tafel slopes, corrosion potential (ECorr), corrosion current density (jCorr) and polarization
resistance (Rp) that were obtained from the LPP curves and listed in Table 1.
-0.9 -0.85 -0.8 -0.75 -0.7 -0.65 -0.6
1.00E-09 1.00E-08 1.00E-07 1.00E-06 1.00E-05 1.00E-04 1.00E-03 1.00E-02 1.00E-01 1.00E+00
Log I, mA
E, V
olts
10 hrs 30 hrs
70 hrs 100 hrs
150 hrs
Figure 4. Potentiodynamic polarization curves of Al-10% Fe alloy obtained from milled powder in 3.5% NaCl at room temperature after 1 hr immersion.
Table 1. Potentiodynamic polarization parameters of Al-10% Fe alloy in 3.5% NaCl atroom temperature after 1 hr immersion.
Tafel Data Linear
Polarization Data
Milling Time (Hours)
βamV/decade βcmV/decade EcorrmV Jcorr,
µAcm-2
RpΩcm2
10 62.21 14.95 -729 0.2832 18476
30 54.83 16.75 -723 0.5701 9776
70 62.97 25.88 -715 2.7487 2898
100 52.21 19.16 -701 4.9802 1223
150 88.07 21.73 -695 10.582 715
[image:7.596.137.453.233.444.2]
the corrosion current (jcorr) increases. Similarly, it is observed that the increase in milling times leads to
an increase in corrosion potential (Ecorr). The corrosion current density, jcorr, was determined
graphically by extrapolating the cathodic and anodic Tafel slopes to the Ecorr (versus Ag/AgCl). The
observed values of corrosion rate (jcorr) and the corrosion resistance (Rp) are shown in Table 1. It is
confirmed from Table 1 that with milling time the corrosion current increases and polarization resistance decreases. Thus it can be concluded that with an increase in milling time, the rate of corrosion in nanocrystalline aluminum alloy increases. It is known that aluminium in contact with water solution forms a rapid hydrated oxide film (AlOOH, also regarded as Al2O3.H2O) on its surface.
The hydrated oxide film formation process can be found elsewhere [25]. In NaCl solution, chloride ion tend to attack the passive film (hydrated oxide) by forming products (AlOHCl, AlOHCl2) which is
soluble in water and further helps in dissolution of the passive film [26].
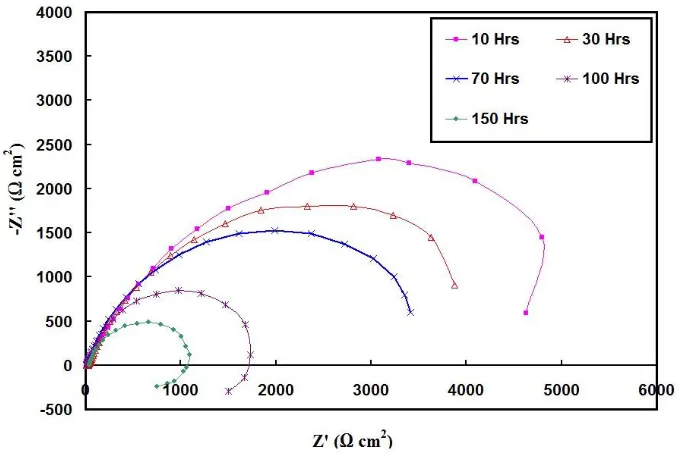
Electrochemical impedance spectroscopy (EIS) method has been commonly used to investigate the corrosion behavior and the process of passivation for different metals and alloys in a variety of corrosive environments [27-30]. The corrosion behavior of sintered Al-10% Fe samples were carried out in 3.5% NaCl solution after an immersion time of 1 hour and the Nyquist plots obtained at the open-circuit potential is shown in Fig.5.
.
Figure 5. Nyquist plot of Al-10% Fe alloy obtained from milled powder in 3.5% NaCl at room temperature after 1 hr immersion.
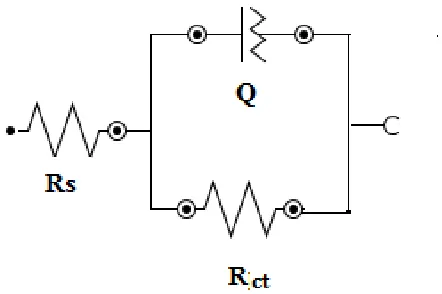
The Nyquist plots were analyzed by fitting the experimental results to an equivalent circuit model shown in Fig. 6. The values of various parameters [RS represents the solution resistance, Q is
the constant phase elements (CPEs), Rct is the charge transfer resistance] obtained by correlating the
[image:8.596.128.469.371.598.2]
with increasing milling time. The constant phase elements (CPEs, Q) with a variation in n values ranging from 0.76 to 0.89 indicate the presence of minor pores in double layer capacitors. This could imply that the film formation on the surface of aluminium is non homogenous and with diminutive porosities. The shapes of Nyquist plot of the milled specimens are similar at each concentration, with one depressed semicircle indicating that the corrosion mechanism is similar for all regions. From fig.6 it is observed that the diameter of the arc, giving the charge-transfer resistance ( ct) of corrosion
reaction, exceeds 1 kΩ.cm2 for all. This high ct values indicate that a stable oxide layer is formed on
aluminum alloy and that it has an excellent corrosion resistance in the 3.5 wt% NaCl solution.
[image:9.596.185.406.280.427.2]It is important to note that the results from EIS measurements indicated that the corrosion resistance values of sintered samples decreased with increasing milling time. Similar observation was made earlier based on the experimental results from LPP data.
Figure 6. Equivalent circuit fitting for EIS.
Table 2: Electrochemical Impedance parameters of Al-10% Fealloy in 3.5% NaCl atroom temperature after 1 hr immersion.
EIS Data
Milling Time (Hours)
Rs
Ωcm2
Cdl µMho
cm-2
n Rct Ω
cm2
10 12.4 93.7 0.776 6100
30 18.2 103 0.803 4800
70 27.2 116 0.835 3900
100 31.2 125 0.865 2200
150 39.2 138 0.896 1120
[image:10.596.118.479.137.380.2]
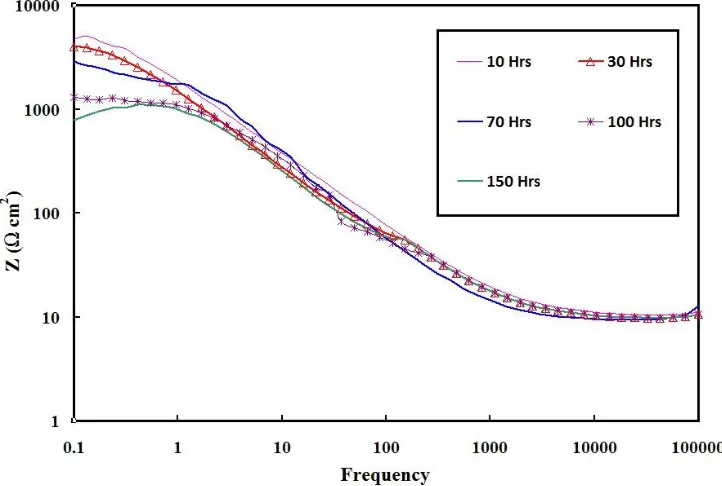
cm2. The decrease in impedance values with milling time implies that the corrosion resistance of the sintered alloy decrease with increase in milling time.
Figure 7. Bode plot of as received (AR) and different milled Al-10% Fe alloy in 3.5% NaCl atroom temperature after 1 hr immersion.
From the results obtained during this investigation it can be concluded that due to milling the corrosion resistances of the sintered Al-Fe alloy decreases and could be attributed to the refinement of grain/or microstructure. It is also known that, an increase in the grain refinement leads to the formation of increased number of sites that can promote or enhance the corrosion rate which in turn reduces the corrosion resistance of the nanocrystalline material [14]. Hence, it can be concluded that the extent of grain refinement plays a significant role on the corrosion behavior of the nanocrystalline material.
4. CONCLUSIONS
(jcorr). This implies that the corrosion resistance of the sintered alloy was found to decrease with an
increase in milling time. ACKNOWLEDGEMENT
This project was supported by the NSTIP Strategic Technologies Program, grant number (12-NAN2635-02), Kingdom of Saudi Arabia.
References
1. T. Sasaki, T. Mukai, and K. Hono, Scri. Mater., 57 (2007) 189-192. 2. A. S. Khan and M. Baig, Int. J. Plas., 27 (2011) 522-538,.
3. L. Lu and Y. Zhang, J. alloys and comp., 290 (1999) 279-283.
4. R. Mishra and R. Balasubramaniam, Corr. Sci., 46 (2004) 3019-3029,.
5. W. Luo, Y. Xu, Q. Wang, P. Shi, and M. Yan, Corr. Sci., 52 (2010) 3509-3513.
6. S. Kim, K. Aust, U. Erb, F. Gonzalez, and G. Palumbo, Scri. Mater., 48 (2003) 1379-1384. 7. H. Miyamoto, K. Harada, T. Mimaki, A. Vinogradov, and S. Hashimoto, Corr. Sci., 50 (2008)
1215-1220.
8. N. Birbilis and Y. Estrin, Adv. Eng. Mater., 10 (2008) 579-582.
9. A. Gebert, A. El-Moneim, O. Gutfleisch, and L. Schultz, Magnetics, IEEE Trans., 38 (2002) 2979-2981.
10. S. Wang, C. Shen, K. Long, T. Zhang, F. Wang, and Z. Zhang, J. Phys. Chem. B, 110 (2006) 377-382.
11. A. Barbucci, G. Farne, P. Matteazzi, R. Riccieri, and G. Cerisola, Corr. Sci., 41 (1998) 463-475. 12. A. Chianpairot, G. Lothongkum, C. A. Schuh, and Y. Boonyongmaneerat, Corr. Sci., 53 (2011)
1066-1071.
13. H. S. Kim and M. B. Bush, Nano. Mater.11 (1999) 361-367.
14. S. Ghosh, G. Dey, R. Dusane, and A. Grover, J. alloys and comp., 426 (2006) 235-243. 15. K. Ralston, N. Birbilis, and C. Davies, Scr. Mater., 63 (2010) 1201-1204.
16. S. Gollapudi, Corr. Sci., 62 (2012) 90-94.
17. L. Liu, Y. Li, and F. Wang, J. Mater. Sci. & Tech., 26 (2010) 1-14.
18. W. Osório, J. Spinelli, I. Ferreira, and A. Garcia, Electrochim. acta, 52 (2007) 3265-3273. 2007. 19. W. R. Osório, C. M. Freire, and A. Garcia, Mat. Sci. and Eng.: A, 402 (2005) 22-32.
20. K. Ralston, D. Fabijanic, and N. Birbilis, Electrochim. acta, 56 (2011) 1729-1736.
21. J. S. Wang, S. G. Donnelly, P. Godavarti, and C. C. Koch, Int. J. Pwd. Met., 24, (1986) 1988. 22. C. Suryanarayana and F. Froes, J. Mater. Res., 5 (1990) 1880-1886.
23. A. S. Khan, B. Farrokh, and L. Takacs, Mat. Sci. and Eng.: A, 489 (2008) 77-84. 24. A. Patterson, Phys. Rev., 56 (1939) 978 1939.
25. J. Gorman, A. Hughes, D. Jamieson, and P. Paterson, Corr. Sci., 45 (2003)1103-1124, 2003. 26. Z. Szklarska-Smialowska, Corr. Sci., 41 (1999) 1743-1767.
27. K. Darowicki, S. Krakowiak, and P. Ślepski, Electrochim. acta, 49 (2004) 2909-2918.
28. F. L. Floyd, S. Avudaiappan, J. Gibson, B. Mehta, P. Smith, T. Provder, and J. Escarsega, Prog. Org. Coat., 66 (2009)8-34.
29. E. M. Sherif, H. R. Ammar, K. A. Khalil, Int. J. Electrochem. Sci., 10 (2015) 775 - 785 30. E. M. Sherif, S.A. Hossain, Int. J. Electrochem. Sci., 7 (2012) 7567 -7578.