A DISSERTATION ON
“ROLE OF QUANTITATIVE CT IN COPD & ITS
CORRELATION WITH PULMONARY FUNCTION
TEST VALUES’’
Submitted to
THE TAMIL NADU Dr.M.G.R.MEDICAL
UNIVERSITY CHENNAI
In Partial fulfilment of the Regulations
For the Award of the degree
M.D. DEGREE BRANCH VIII
RADIODIAGNOSIS
MADRAS MEDICAL COLLEGE,
CHENNAI.
CERTIFICATE
This is to certify that the dissertation titled “ROLE OF QUANTITATIVE CT IN COPD & ITS CORRELATION WITH PULMONARY FUNCTION TEST VALUES” submitted by Dr.AISHWARYA.R, appearing for M.D.RADIODIAGNOSIS degree examination in May 2019, is a bonafide record of work done by her, under my guidance and supervision in partial fulfilment of requirements of The Tamilnadu Dr. M.G.R Medical University, Chennai. I forward this to The Tamilnadu Dr. M.G.R Medical University, Chennai.
PROF.Dr.K.MALATHY, PROF.Dr.R.RAVI M.D.R.D. PhD, M.D., D.M.R.D.,
Guide, Professor, Director & Professor,
Barnard Institute of Radiology, Barnard Institute of Radiology, Madras Medical College & Madras Medical College & Rajiv Gandhi Government Rajiv Gandhi Government General Hospital, General Hospital,
Chennai - 600 003. Chennai - 600 003.
PROF.Dr.R.JAYANTHI, M.D., FRCP(Glasg),
The Dean,
Madras Medical College,
DECLARATION
I, Dr.AISHWARYA.R, certainly declare that this dissertation titled, “ROLE OF QUANTITATIVE CT IN COPD & ITS CORRELATION WITH PULMONARY FUNCTION TEST VALUES”, represents a genuine work of mine, done at the Barnard Institute of Radiology, Madras Medical College and Rajiv Gandhi Government General Hospital, under the supervision of Prof.Dr.K.MALATHY, M.D.R.D. PhD, Professor, Barnard Institute of Radiology, Madras Medical College and Rajiv Gandhi Government General Hospital. I, also affirm that this bonafide work or part of this work was not submitted by me for any others for any award, degree or diploma to any other university board, neither in India or abroad. This is submitted to The Tamil Nadu Dr.MGR Medical University, Chennai in partial fulfilment of the rules and regulations for the award of M.D Degree in Radiodiagnosis (Branch VIII).
Date : Place: Chennai
Dr. Aishwarya.R
ACKNOWLEDGEMENT
I would like to express my deep sense of gratitude to the Dean, Professor Dr.R.Jayanthi M.D, FRCP(Glasg), Madras Medical College and
Professor.Dr.R.Ravi, M.D.R.D., D.M.R.D., our Director, Barnard Institute of
Radiology, MMC & RGGGH, for allowing me to undertake this study on “ROLE OF QUANTITATIVE CT IN COPD & ITS CORRELATION WITH
PULMONARY FUNCTION TEST VALUES” and utilize the Institutional
facilities.
I was able to carry out my study to my fullest satisfaction, thanks to the guidance, encouragement, motivation and constant supervision extended to me, by my guide and beloved Head of the Department, Professor Dr.K.Malathi, M.D.R.D., PhD. Hence my profuse thanks are due for her.
I would like to express my deep gratitude and respect to Professor Dr.S.Babu Peter for his practical comments and guidance especially at the inception of this study. This work would not have been possible without his guidance, support and encouragement.
My sincere thanks to Professor Dr.S.Kalpana for her valuable support throughout the study. I also thank Professor Dr.D.Ramesh, whose advice and insight was invaluable to me.
I am bound by ties of gratitude to my respected Associate Professors,
Dr.E.Manimekala, Dr.R.Ganga Devi and Dr.Sivashankar and Assistant Professors,
Dr.Balan.M.P, Dr.Dheebha and Dr.Karthik, for placing and guiding me on the right track from the very beginning of my career in Radiodiagnosis till this day.
I also thank my past and present fellow postgraduates who helped me in carrying out my work and preparing this dissertation. I thank all the Radiology technicians, Staff Nurses and all the Paramedical staff members in Barnard Institute of Radiology, for their fullest co-operation.
I thank my statistician Mr.Venkatesan, who rendered his valuable timely help in completing this study.
I thank my parents and my brother for their constant and persistent support for my studies and in all my endeavours.
I would be failing in my duty if I don’t place on record my sincere thanks to those patients and their relatives who inspite of their sufferings extended their fullest co-operation to this study.
TABLE OF CONTENTS
S.NO.
CONTENTS
PAGE
1.
INTRODUCTION
1
2.
RATIONALE OF STUDY
3
3.
ANATOMY & REVIEW OF LITERATURE
5
4.
MATERIALS & METHODS
43
5.
REPRESENTATIVE CASES
47
6.
STATISTICAL ANALYSIS
57
7.
OBSERVATION & RESULTS
58
8.
DISCUSSION
84
9.
LIMITATIONS OF STUDY
87
10.
CONCLUSION
88
11.
REFERENCES
12.
ANNEXURES
i.
Abbreviations
ii.
Data Collection Proforma
iii.
Patient Information Sheet
iv.
Patient Consent Form
v.
Master Charts
vi.
Ethical Committee Approval Letter
vii.
Plagiarism Analysis Report
1
“ROLE OF QUANTITATIVE CT IN COPD & ITS
CORRELATION WITH PULMONARY FUNCTION TEST
VALUES’’
1.
INTRODUCTION
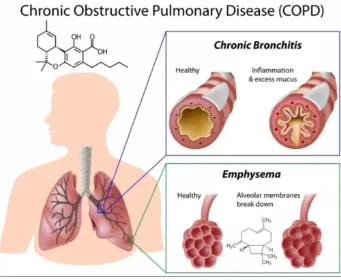
Chronic obstructive pulmonary disease (COPD) is a gradually progressive disorder characterized by irreversible or partially reversible airway obstruction[1]. It is predicted to be the fifth leading cause of disability in the world by the year 2020[2]. The accompanying histopathological changes that lead to air flow limitations appear to be a combination of varying degree of parenchymal destruction (emphysema), small and large airway changes (bronchiolitis and bronchitis), air trapping on expiration, vascular alterations, and chest wall and diaphragmatic changes[3,4].
2 contributions of the individual processes even in patients with similar values of pulmonary function tests.
Hence, routine pulmonary function tests are of not much use to assess the specific contribution of each pathological process. These changes are better evaluated by quantitative computed tomography analysis of the lungs.
3
2.
RATIONALE OF STUDY
The chronic airflow limitation characteristic of COPD is caused by a mixture of parenchymal destruction and small airways disease the relative contributions of which vary from person to person. The potential usefulness of CT for identification of regions of pulmonary emphysema and air trapping has been addressed in many investigations[6]. Emphysematous changes in the lungs of patients with COPD are represented as low attenuation areas on CT images[7-9].
QCT of the lung parenchyma uses accurate measures of lung density to generate histogram statistics of the lung to detect lower-density areas of the lung that correspond to emphysema on total lung capacity (TLC) scans and can also look at lower-density areas of the lung that correspond to air trapping on CT scans of the lung obtained at functional residual capacity (FRC) or residual volume(RV). The detection of the emphysema is a direct measure of lung remodeling in COPD, and the detection of air trapping is believed to be an indirect measure of small airway disease[10].
4 morphologic changes such as emphysema, hyperinflation, bronchial wall thickening, air trapping & vascular pruning. Thus, airway-predominant and emphysema-predominant COPD can be effectively differentiated by computed tomography[11,12].
5
3.1 EMBRYOLOGY
Anatomically, the respiratory tract is divided into two parts.
Upper Respiratory Tract
Lower Respiratory Tract
The nose, nasal cavity & pharynx upper respiratory tract form the upper respiratory tract, whereas the larynx, trachea, bronchi & lungs make up the lower respiratory tract.
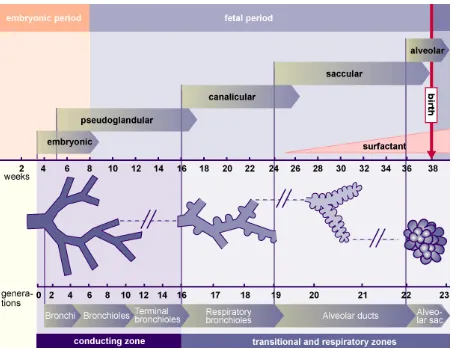
There are 4 phases of histological development of the lungs. Amniotic fluid, respiratory movements & thyroid hormone play an important role in lung maturation during late fetal period. One of important processes in lung development is the branching of the airways which leads to alveolar saccule formation. Around a total of 18 to 30 branching generations occur.
3.1.1 EARLY DEVELOPMENT
The respiratory diverticulum is a key structure from which the lung bud, also referred to as the respiratory bud develops. The respiratory diverticulum forms from part of the laryngotracheal tube. The lung bud is an endodermal structure in the development of the respiratory tract and gives rise to trachea, larynx bronchi & lungs.
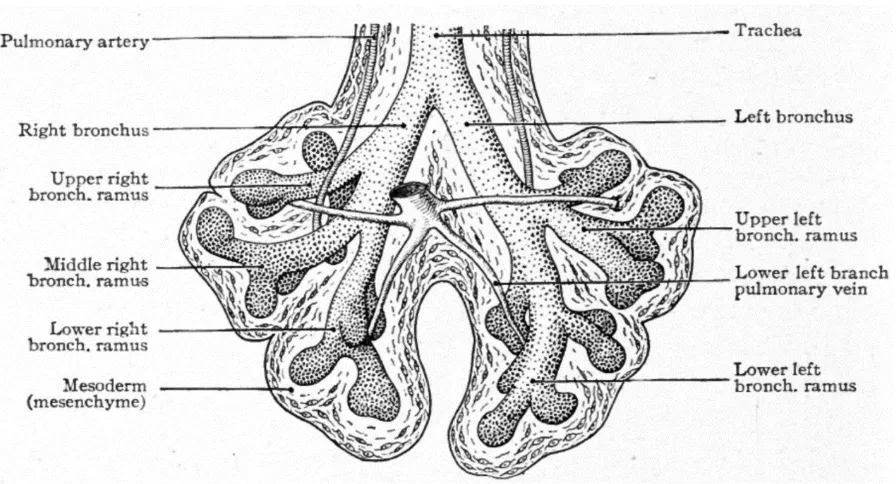
6 development. During the separation of the lung bud from the foregut around the 28th day of gestation, it forms the trachea & the two bronchial buds, one on each side.
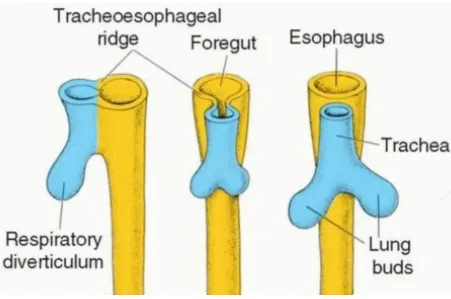
3.1.2 SEPARATION OF TRACHEA AND ESOPHAGUS
[image:12.595.72.523.296.595.2]Initially the trachea is open into the esophagus at its posterior aspect. Later as the lung bud elongates two laryngotracheal folds develop, which are longitudinal mesodermal ridges, and they gradually grow until they form a wall between the two organs thus separating them.
FIGURE 3-1 SEPARATION OF FOREGUT INTO ESOPHAGUS & TRACHEA
3.1.3 LATER DEVELOPMENT
7 the mature organ[14]. The pseudoglandular stage is the first stage of alveolar development. It occurs between the 5th & 16th weeks of development and it is so named because the primitive alveoli histologically resemble glandular tissue at this stage. Next the lung enters into canalicular & saccular phases. Two main changes occur in these stages. First, the terminal tubes narrow & form small saccules. These saccules later make gas exchange possible by association with capillaries. Second, type I & type II pneumocytes, are formed by the differentiation of alveolar epithelium. It also forms the respiratory epithelium of the trachea & bronchi.
[image:13.595.73.525.346.695.2]3.1.4 LUNG DEVELOPMENT STAGES
8 FIGURE 3-3 LUNG DEVELOPMENT IN A 6 WEEK EMBRYO
10
3.2 ANATOMY
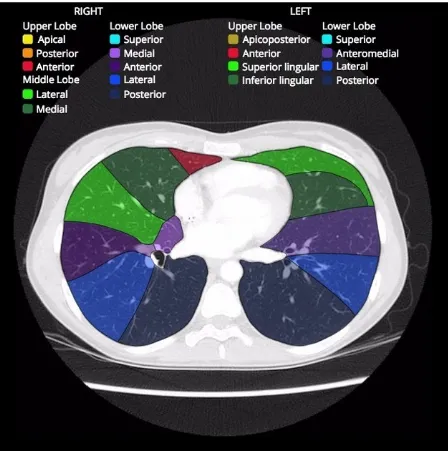
The lungs lie within the thoracic cavity separated by the heart & the mediastinum. The two lungs are similar, however, they are not completely symmetrical, having different number of lobes and different bronchial and vascular anatomy. In most individuals, the right lung consists of three lobes which are subdivided into 10 segments and the left consists of two lobes and eight segments. The lungs are surrounded by the pleura which separates them from the chest wall. The lobes are also incompletely separated by fissures. Each lung has an oblique fissure, and a horizontal fissure is also seen in the right lung.
3.2.1 Tracheobronchial tree
The tracheobronchial tree is a branching structure composed of tubes of an ever-decreasing diameter which start at the larynx and end in the alveoli. It is broadly divided into conduction and respiratory zones.
3.2.2 Conduction zone
11
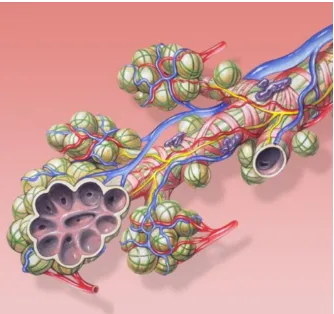
3.2.3 Respiratory zone
The respiratory zone is an continuation of the tracheobronchial tree at the terminal bronchioles. It is composed of respiratory bronchioles, alveolar ducts, alveoli and it is the location of gas transfer within the lung. In any organ, the parenchyma refers the functional tissues; thus, the strict definition of lung parenchyma only includes the alveoli, alveolar ducts, and respiratory bronchioles.
3.2.4 Blood supply
The lungs have dual arterial supply and venous drainage :- pulmonary arteries and veins, as well as bronchial arteries and veins
Arterial supply
o pulmonary arteries: They supply de-oxygenated blood from the right ventricle.
o bronchial arteries: They are branches of the thoracic aorta which supply
oxygenated blood
Venous drainage
o pulmonary veins: They drain into the left atrium
o bronchial veins: They drain to the pulmonary veins, superior vena cava,
and azygos venous system
3.2.5 Nerve Supply
12
Sympathetic innervation: noradrenaline causes bronchodilation by acting on
the beta receptors
Parasympathetic innervation: acetylcholine maintains the resting tone of the bronchiolar smooth muscle by acting on M-1 muscarinic receptors - this action is related to, but distinct from bronchoconstriction
13
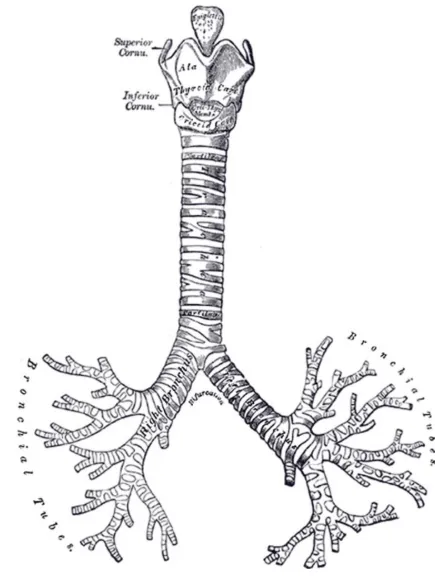
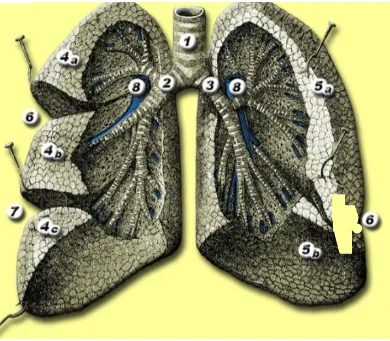
Figure 3-5
1. Trachea
2. Right main bronchus 3. Left main bronchus 4a.
4b. 4c.
Right upper lobe Middle lobe Right lower lobe 5a.
5b.
Left upper lobe Left lower lobe 6. Minor fissure 7. Major fissure 8. Pulmonary Artery
14
Gross Anatomy
The trachea divides at the carina to form the left and right main stem bronchi which then enter the lung substance to divide further. The initial division is into lobar bronchi, and subsequent divisions give rise to smaller bronchi and bronchioles till the smallest bronchioles connect to alveoli.
The bronchopulmonary segment is supplied by its own bronchus and artery. Hence each segment is functionally and anatomically discrete which allows a single segment to be surgically resected without affecting other neighbouring segments.
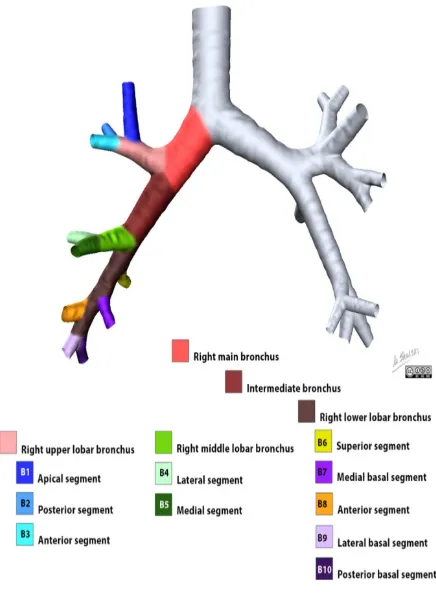
Right lung
The right lung is further subdivided into three lobes with ten segments. The notation in brackets refers to the Boyden classification of bronchi.
right upper lobe
o apical segment (B1)
o posterior segment (B2)
o anterior segment (B3)
right middle lobe
o lateral segment (B4)
15
right lower lobe
o superior segment (B6)
o medial segment (B7)
o anterior segment (B8)
o lateral segment (B9)
o posterior segment (B10)
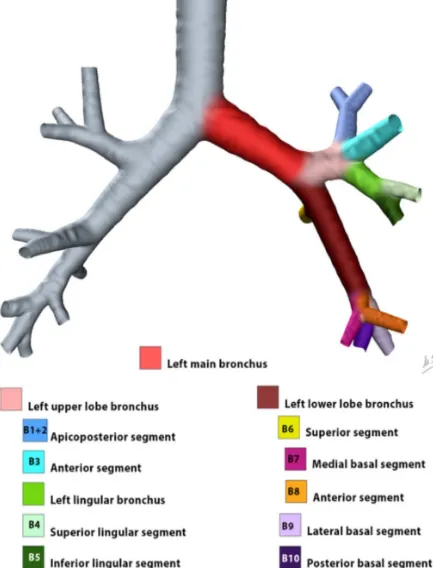
Left lung
The left lung is further subdivided into two lobes and hence, into eight segments. The notation in brackets refers to the Boyden classification of bronchi.
left upper lobe
o apicoposterior segment (B1/2)
o anterior segment (B3)
o superior lingular segment (B4)
o inferior lingular segment (B5)
left lower lobe
o superior segment (B6)
o anteromedial segment (B8)
o lateral segment (B9)
20
3.3 PATHOPHYSIOLOGY & PATHOGENESIS
[image:26.595.127.468.392.672.2]Chronic obstructive pulmonary disease (COPD) is defined as a pathologic condition of the lung which is characterized by emphysematous destruction of the lung parenchyma as well as remodelling of the small airways. The presence of these two processes leads to expiratory airflow obstruction which is not completely reversible with the use of inhaled bronchodilators[15]. Marked heterogeneity exists in subject symptoms and response to therapeutic intervention[16]. This inconsistency in the association between lung function and disease manifestations has caused increasing interest in image based and classification of COPD.
21
3.3.1 Pathogenesis[17]
One of the major physiological changes of COPD is airflow limitation. It can occur both due to small airway obstruction as well as emphysema. Various factors such as hyperplasia and accumulation of cells, mucus and fibrosis lead to narrowing of the small airways. Airway fibrosis occurs as a result of Transforming growth factor (TGF-β) activation. Parenchymal inflammation causes emphysema in the absence of TGF-β activation.
The Pathogenesis of emphysema (Fig. 3-10):
(1) Chronic smoking causes respiratory epithelial damage by recruitment of Inflammatory and immune cell within the terminal air spaces of the lung[18,19]
(2) Elastolytic and other proteinases released by inflammatory cells release damage the extracellular matrix of the lung.
(3) Oxidant-induced cigarette smoke damage[20] and senescence directly lead to structural cell death (endothelial and epithelial cells)
23
Alveoli, small (≤2 mm diameter), & large airways may be affected by cigarette smoke. Large airway changes are responsible for cough and sputum, while small airways and alveolar damage cause physiologic alterations. In most patients with COPD both small airway changes and emphysema are present simultaneously; however, there is variation in the contribution of small airway changes & emphysema in each patient even with similar pulmonary function test results.
Large Airway
Cigarette smoking causes enlargement of mucus glands and goblet cell hyperplasia, which further leads to cough and mucus production. The bronchi also develop squamous metaplasia, which causes disruption of muco-ciliary clearance. It is also a predisposing factor for carcinogenesis. Airflow limitation may occur as a result of bronchial hyperreactivity and smooth muscle hypertrophy. Neutrophil influx in upper respiratory tract infections is associated with purulent sputum production.
Small Airways
24
3.3.2 Pathophysiology[22]
The inflammation of the airways which is a consequence of COPD leads to a series of physiological changes.
Elastic recoil pressure of the lungs is reduced due to elastin proteolysis.
The damage to elastin causes airway narrowing with decreased airflow in
bronchioles & air trapping.
Fixed airway narrowing occurs due to fibrotic remodelling of airways. This
leads to increased airway resistance that is not reversible by bronchodilators, as opposed to the airway resistance in asthma which is reversible by bronchodilators.
Ventilation perfusion mismatch occurs as a result of apoptosis of bronchial &
alveolar epithelial cells as well as pulmonary capillaries. The lead to decreased surface area of alveoli for gaseous exchange.
Elastic recoil pressure of the lung is decreased in emphysema. This leads to a
25 FIGURE 3-12: Pathophysiological Changes occurring in the Lungs of COPD patients
Airflow Obstruction
Fixed airway narrowing occurs due to fibrotic remodelling of airways. This leads to increased airway resistance that is not reversible by bronchodilators, as opposed to the airway resistance in asthma which is reversible by bronchodilators.
There is prolongation in the time required for removal of air from lungs during expiration as a result of the airway narrowing.
The airflow obstruction is detected spirometrically by the following factors
FEV1
26 Where FEV1 is volume of air removed in first second and FVC is total volume of air removed during forceful expiration after maximal inhalation.
[image:32.595.76.476.364.617.2]Airflow during forced exhalation is the result of the balance between the elastic recoil of the lungs promoting flow and the resistance of the airways limiting flow. In normal lungs, as well as in lungs affected by COPD, maximal expiratory flow diminishes as the lungs empty because the lung parenchyma provides progressively less elastic recoil and because the cross-sectional area of the airways falls, raising the resistance to airflow. The decrease in flow coincident with decreased lung volume is readily apparent on the expiratory limb of a flow-volume curve.
27 FIGURE 3-14: PATHOPHYSIOLOGY OF AIRWAY OBSTRUCTION
Hyperinflation
Lung hyperinflation occurs as a result of air trapping in COPD. It is the primary cause of dyspnoea in COPD patients & produces barrel shaped chest.
28
Pulmonary Hypertension
There is increased pulmonary vascular resistance as a result of endothelial dysfunction, hypertrophy of pulmonary capillary musculature, intimal thickening & apoptosis which are initiated by the structural changes in COPD. This results in predisposition to pulmonary arterial hypertension. In severe cases it may lead to right heart failure.
29
3.3.3 Risk Factors[23]:
The most common cause is cigarette smoking. It takes many years of smoking to develop COPD and as such typically patients are older adults. There are, however, a number of other less common risk factors. They include:
industrial exposure (e.g. mining)
cystic fibrosis
alpha-1 antitrypsin deficiency
intravenous drug use
immune deficiency syndromes
vasculitides and connective tissue disorders
3.3.4 Clinical Features:
Symptoms of COPD include
dyspnoea on exertion,
wheezing,
productive cough,
pursed-lip breathing, and
use of accessory muscles.
Patients with chronic bronchitis are classically "blue bloaters," while those with
emphysema are known as "pink puffers". In advanced cases, muscle
30
3.3.5 Pulmonary Function Tests (PFT):
GOLD
STAGE[1]
SEVERITY SPIROMETRY
I Mild FEV1/FVC <0.7 and FEV1 ≥80% predicted
II Moderate FEV1/FVC <0.7 and FEV1 ≥50% but <80% predicted
I Severe FEV1/FVC <0.7 and FEV1 ≥30% but <50% predicted
IV Very Severe FEV1/FVC <0.7 and FEV1<30% predicted
31
3.4 REVIEW OF LITERATURE
3.4.1 EMPHYSEMA
Emphysematous lung destruction results in replacement of normal lung (which has a typical attenuation about -850 HU on inspiratory CT) by air-containing spaces, with CT attenuation close to -1000 HU. Emphysema may be further classified as panlobular, centrilobular, or paraseptal[24].
IMAGING FEATURES[25-27]
CT FINDINGS[28]
Centrilobular emphysema
commonest type of emphysema encountered in imaging.
predominantly occurs in the upper zones of each lobe [29].
appears as focal lucencies measuring up to 1 cm in diameter, around the central
respiratory bronchioles.
located centrally within the secondary pulmonary lobule.
Strongly associated with smoking.
32 FIGURE 3-17: CENTRILOBULAR EMPHYSEMA
33
Panlobular emphysema[30]
widespread areas of abnormally low attenuation due to widespread destruction of entire secondary pulmonary lobule.
affected lung shows appear fewer and smaller pulmonary vessels than normal.
Commonly seen in association with alpha1-antitrypsine deficiency.
Findings are more predominant in the lower lobes.
34 FIGURE 3-20: PANLOBULAR EMPHYSEMA
Paraseptal emphysema[31,32]
localized near fissures and pleura
commonly associated with bullae formation
Is a cause of spontaneous pneumothorax in young adults.
35 FIGURE 3-22: PARASEPTAL EMPHYSEMA
QUANTITATIVE CT[33-37]
Emphysema is quantitatively assessed by the following parameters :-
Relative areas of low-attenuation lower than a predetermined threshold
The frequency-attenuation distribution percentile.
There is good correlation of PFT and low-attenuation regions consisting of pixels with attenuation values of −950 HU or less on thin-section CT scans.
3.4.2 SMALL AIRWAY DISEASE:
36 obstruction[38,39]. Smooth muscle hypertrophy and airway wall fibrosis are other pathologic features that may be found in patients with COPD[40,41]. The mechanisms of airflow obstruction include increased mucus secretion with resultant luminal occlusion, epithelial layer thickening that encroaches on the airway lumen[42], and increased mucus secretion with altered airway surface tension and a resultant predisposition to expiratory collapse[43].
IMAGING FEATURES
[image:42.595.104.495.363.672.2]Small airway disease cannot be visualized directly with current radiographic techniques.
37
CT
Direct Signs
o thickened peripheral airways: may only be seen in the proximal portion
Indirect Signs
o air trapping
o subsegmental atelectasis
o mosaic lung attenuation
o centrilobular nodules
o tree-in-bud changes
QUANTITATIVE CT[44]
38 shown a significant correlation between the expiratory-inspiratory attenuation ratio and airflow limitation in COPD[49-51].
3.4.3 LARGE AIRWAY DISEASE:
Coughing and sputum production are clinical manifestations of chronic bronchitis. At pathologic examination, hypertrophy of the bronchial wall mucous glands is seen in association with chronic inflammation and fibrous replacement of the smooth muscle layer. Those pathologic changes result in bronchial wall thickening and narrowing of the bronchial lumen. In patients with COPD, bronchial wall thickening can be evaluated qualitatively and quantitatively at CT[52-55]. The correlation of airway measurements with lung function varies according to the order of bronchial generation. Thus, when airway dimensions are evaluated, bronchial generation– based analysis should be considered.
3.4.4 VASCULAR ALTERATIONS
39 extrapulmonary vascular alterations in patients with COPD are closely related to endothelial dysfunction[59-61]. Endothelial dysfunction results from changes in the expression and release of vasoactive mediators. In particular, vascular endothelial growth factor (VEGF) plays an important role in the pathogenesis of both vascular alteration and emphysema[60-62]. Kanazawa et al[63] reported that the VEGF level in induced sputum from patients with emphysema is decreased in comparison with that from patients with chronic bronchitis. Vascular alterations also may be relevant to the diagnosis and characterization of COPD.
40
3.4.5 OTHER STUDIES:
1. Bankier et al.[35] - QCT measurements correlated better with macroscopic measurements of emphysema than visual CT scoring.
2. Madani et al.[66] - the best correlation between QCT and macroscopic and microscopic measures of emphysema was obtained using a density mask technique with a threshold level of –960 or –970 HU, although the correlation for a threshold of –950 HU was almost as high.
3. Dirksen et al.[67] - use of CT will provide an analysis of change in lung density over time that is more sensitive to intervention than the usual analysis of change in lung function (FEV1)
4. Hasegawa et al.[68] - measurements of the bronchial wall area and inner luminal area obtained in distal (small) airways were more closely correlated with the percentage of predicted FEV1 than those obtained in proximal (large) airways. These findings may indicate that airflow limitation is more closely related to the dimensions of the small airways than to those of the large airways.
41
6. Knudson et al.[70] - CT obtained in expiration shows stronger correlation in the assessment of emphysema the CT obtained during inspiration.
42 COPD Phenotype Emphysema (%Low Attenuation Area) Airway Wall Thickening Air Trapping (Residual Volume)
Emphysema-predominant Moderate to severe None to mild None to mild
Airway-predominant None to mild Moderate to
severe
Moderate to severe
Mixed
More small airway remodeling than emphysema
Moderate to severe Moderate to severe
Moderate to severe
More emphysema than small airway
remodeling
Moderate to severe Moderate to
43
MATERIALS AND METHODS
4.1 AIM OF THE STUDY:
1. Primary Aim - To assess the role of Quantitative CT in COPD
2. Secondary Aim - To evaluate the relationship between Quantitative CT(QCT) and spirometric measurements of disease severity in subjects with and without chronic obstructive pulmonary disease (COPD).
4.2 STUDY AREA:
Barnard Institute of Radiology, Madras Medical College, Chennai.
4.3 STUDY PERIOD:
1 year (July 2017 to July 2018)
4.4 SAMPLE SIZE: 70
4.5 STUDY DESIGN: Prospective Comparative Study
4.6 INCLUSION CRITERIA:
Cases: Eligible subjects between the ages of 40 and 65 years & having COPD.
Controls: Subjects between the ages of 40 and 65 years & not having COPD.
4.7 EXCLUSION CRITERIA:
Subjects with concomitant respiratory disorders other than COPD.
Non-Cooperative patients
COPD patients who are unable to hold their breath for sufficient period of time
44
4.8 METHODOLOGY:
This prospective study was performed after obtaining clearance from our Institutional Ethics Committee and institutional informed consent guidelines were observed.
4.9 STUDY POPULATION:
Patients referred from Thoracic Medicine department for CT chest who were proved to have COPD by Pulmonary Function Test were included in this study during the period from July 2017 to July 2018.
Controls were subjects with normal Pulmonary Function Test values & normal CT chest findings who were referred for reasons other than COPD.
The patients were screened using the drawn inclusion/ exclusion criteria. Relevant entries in the proforma for each patient were made after reviewing his/her case sheet & previous medical records.
QCT data were suppressed from the cohort if scans showed extreme motion or had other technical inadequacies (e.g., non-protocol reconstruction kernel, low exposure, or a value of > 1 for the ratio of functional residual capacity [FRC] to total lung capacity [TLC]).
45 All patients were required to provide written informed consent before study participation.
4.10 CT EXAMINATION:
All the Quantitative CT studies were performed in a 16 slice CT scanner (TOSHIBA-ALEXION).
In each case, CT of the thorax was performed from the lung apices through the level of the adrenal glands. These scans were reconstructed with a slice thickness of 1 mm and corresponding slice interval of 1mm, to achieve near-isotropic voxels.
Inspiratory & expiratory scans were acquired at 100 mAs; all scans were acquired at 120 kVp. CT dose modulation and IV contrast agents were not used for this study.
Scanning was performed as follows:
Inspiratory CT – Subject was asked to take a deep breath & plain CT chest was
taken at full inspiration to obtain Total Lung Capacity.
Expiratory CT – Subject was asked to hold breath in normal expiration & CT
chest was taken to obtain Functional Residual Capacity.
4.11 IMAGE POSTPROCESSING & ANALYSIS
46 yellow. Lung volume, low attenuation volume, low attenuation percentage and mean lung attenuation were calculated.
47
CASE 1
51 year old male, smoker for 20 years, stopped for past 4 years. Diagnosed to have COPD GOLD stage 1 by PFT.
FEV1 – 1.33 FVC – 1.84
FEV1/FVC – 0.72 QUANTITATIVE CT: Inspiration
48
Expiration:
PARAMETERS VALUES
49
CASE 2
57 year old male, smoker for 35 years. Diagnosed to have COPD GOLD stage 2 by PFT.
FEV1 – 1.05 FVC – 1.94
FEV1/FVC – 0.54 QUANTITATIVE CT: Inspiration
50
Expiration
PARAMETERS VALUES
51
CASE 3
50 year old male, smoker for 28 years. Diagnosed to have COPD GOLD stage 3 by PFT.
FEV1 – 0.82 FVC – 1.51
FEV1/FVC – 0.54 QUANTITATIVE CT: Inspiration
52
Expiration
PARAMETERS VALUES
53
CASE 4
60 year old male, smoker for 45 years. Diagnosed to have COPD GOLD stage 4 by PFT.
FEV1 – 0.62 FVC – 0.88 FEV1/FVC – 0.7
QUANTITATIVE CT:
Inspiration
54
Expiration
PARAMETERS VALUES
55
CASE 5
41 year old male, smoker for 10 years. No other complaints.
PFT:
FEV1 – 3.3 FVC - 4.1
FEV1/FVC – 0.8 QUANTITATIVE CT
Inspiration
56
Expiration
PARAMETERS VALUES
% lung attenuation <-950HU 0
Mean lung attenuation in Inspiration -813 HU Total Lung Capacity 4.9 L % lung attenuation <-856HU 0
57
6.
STATISTICAL ANALYSIS
The collected data were analysed with IBM.SPSS statistics software 23.0 Version.
To describe about the data descriptive statistics frequency analysis, percentage analysis were used for categorical variables and the mean & S.D were used for continuous variables.
To find the significant difference between the bivariate samples in Independent groups the Unpaired sample t-test was used.
For the multivariate analysis the one way ANOVA with Tukey's Post-Hoc test was used.
To assess the relationship between the variables Pearson's Correlation was used with Scatter plot.
To identify the influence of the variables the multiple regression model with enter method.
To find the significance in categorical data Chi-Square test was used similarly if the expected cell frequency is less than 5 in 2×2 tables then the Fisher's Exact was used.
58
7.
OBSERVATION & RESULTS
[image:64.595.98.500.400.684.2]7.1 FREQUENCY TABLES: 7.1.1 AGE
TABLE 7.1 AGE WISE DESTRIBUTION IN STUDY GROUP AGE (yrs)
Frequency Percent
Valid Percent
Cumulative Percent Valid 40 - 49 yrs 32 45.7 45.7 45.7
50 - 59 yrs 31 44.3 44.3 90.0 60 - 69 yrs 7 10.0 10.0 100.0 Total 70 100.0 100.0
FIGURE 7.1 BAR DIAGRAM SHOWING AGE WISE DESTRIBUTION IN STUDY GROUP 7.1.2 SEX 0.0 5.0 10.0 15.0 20.0 25.0 30.0 35.0 40.0 45.0 50.0
59
TABLE 7.2 SEX DESTRIBUTION IN STUDY GROUP SEX
Frequency Percent
Valid Percent
Cumulative Percent Valid Female 13 18.6 18.6 18.6
Male 57 81.4 81.4 100.0 Total 70 100.0 100.0
FIGURE 7.2 PIE CHART SHOWING SEX DESTRIBUTION IN STUDY GROUP
19%
81%
Gender distribution
60
[image:66.595.75.527.391.652.2]7.1.3 GOLD STAGE
TABLE 7.3 GOLD STAGE DESTRIBUTION IN STUDY GROUP GOLD STAGE
Frequency Percent
Valid Percent
Cumulative Percent Valid I 6 8.6 12.2 12.2
II 18 25.7 36.7 49.0 III 13 18.6 26.5 75.5 IV 12 17.1 24.5 100.0 Total 49 70.0 100.0
Missing System 21 30.0 Total 70 100.0
FIGURE 7.3 PIE CHART SHOWING GOLD STAGE DESTRIBUTION IN STUDY GROUP 12% 37% 27% 24%
Gold Stage
61
62
64
66
67
74
TABLE 7.9: CORRELATION
Correlations
FEV1 FEV1/FVC
Pearson Correlation Sig. (2-tailed) Pearson Correlation Sig. (2-tailed)
FEV1/FVC .820 .005
% LUNG ATTENUATION<-950HU
-.813 .005 -.697 .005
MLAI .868 .005 .753 .005
% LUNG ATTENUATION<-856 HU
-.934 .005 -.799 .005
MLAE .836 .005 .739 .005
INNER DIAMETER (mm) .868 .005 .751 .005
AWWT -.668 .005 -.584 .005
INNER AREA (mm2) .875 .005 .759 .005
OUTER AREA (mm2) .667 .005 .574 .005
WALL AREA (mm2) -.018 .884 -.022 .854
TABLE 7.10: COEFFICIENTS
Coefficientsa
Model Unstandardized
Coefficients Standardized Coefficients t Sig. Confidence 95.0% Interval for B
B Std.
Error
Beta Lower
Bound
Upper Bound
(Constant) .522 .277 1.887 .064 -.030 1.074
LUNG < -950 %
-.005 .002 -.171 -2.094 .040 -.009 .000
LUNG < -856 %
-.011 .001 -.848 -8.201 .005 -.013 -.008
INNER DIAMETER (mm)
-.015 .063 -.024 -.231 .818 -.141 .112
[image:80.595.68.532.437.674.2]75
CROSSTABULATION – HOMOGENOUS SUBSETS TABLE 7.11: FEV1
FEV1
Tukey HSD
GOLD STAGE N
Subset for alpha = 0.05
1 2 3 4
Stage IV 12 .5708 Stage III 13 .8146 .8146 Stage II 18 1.1378 1.1378 Stage I 6 1.3833
Control 21 3.3571 Sig. .265 .067 .258 1.000
TABLE 7.12:FVC
FVC
Tukey HSD
GOLD STAGE N
Subset for alpha = 0.05 1 2 3 Stage IV 12 .9425 Stage III 13 1.2854 Stage II 18 1.7611 Stage I 6 2.1800
Control 21 4.0714 Sig. .216 .079 1.000
TABLE 7.13: FEV1/FVC
FEV1/FVC
Tukey HSD
GOLD STAGE N
Subset for alpha = 0.05
1 2 Stage IV 12 .6100 Stage III 13 .6377 Stage I 6 .6417 Stage II 18 .6483
Control 21 .8252
Sig. .459 1.000
76
TABLE 7.14: % LUNG ATTENUATION < -950
% Of Lung Attenuation <-950HU
Tukey HSD
GOLD STAGE N
Subset for alpha = 0.05
1 2 3 4 5
Control 21 .090 Stage I 6 6.233 Stage II 18 9.683 Stage III 13 17.954
Stage IV 12 29.725 Sig. 1.000 1.000 1.000 1.000 1.000
TABLE 7.15: Mean Lung Attenuation in Inspiration(MLAI)
Mean Lung Attenuation in Inspiration(MLAI)
Tukey HSD
GOLD STAGE N
Subset for alpha = 0.05
1 2 3 4
Stage IV 12 -889.42 Stage III 13 -882.85 -882.85 Stage II 18 -867.89 Stage I 6 -849.00
Control 21 -818.33 Sig. .798 .094 1.000 1.000
TABLE 7.16: TLC (L)
TLC (L)
Tukey HSD
GOLD STAGE N
Subset for alpha = 0.05 1 2 3 Control 21 4.538 Stage I 6 5.217 Stage II 18 5.233
Stage III 13 5.392 5.392
Stage IV 12 5.833
Sig. 1.000 .814 .062
77
TABLE 7.17: % LUNG ATTENUATION <-856 HU
% Lung Attenuation <-856 HU
Tukey HSD
GOLD STAGE N
Subset for alpha = 0.05
1 2 3 4 5
Control 21 .443 Stage I 6 21.717 Stage II 18 39.667 Stage III 13 50.777
Stage IV 12 60.658 Sig. 1.000 1.000 1.000 1.000 1.000
TABLE 7.18 : MEAN LUNG ATTENUATION IN EXPIRATION
Mean Lung Attenuation in Expiration(MLAE)
Tukey HSD
GOLD STAGE N
Subset for alpha = 0.05
1 2 3 4 5
Stage IV 12 -846.25 Stage III 13 -806.15 Stage II 18 -765.00 Stage I 6 -734.17
Control 21 -706.71 Sig. 1.000 1.000 1.000 1.000 1.000
TABLE 7.19: FRC(L)
FRC (L)
Tukey HSD
GOLD STAGE N
Subset for alpha = 0.05 1 2 3 Control 21 2.414 Stage I 6 3.033 Stage II 18 3.172
Stage III 13 3.408 3.408
Stage IV 12 3.775
Sig. 1.000 .060 .068
78
Table 7.20: INNER DIAMETER (mm)
Inner Diameter (mm)
Tukey HSD
GOLD STAGE N
Subset for alpha = 0.05
1 2 3 4 5
Stage IV 12 2.842 Stage III 13 3.146 Stage II 18 3.433 Stage I 6 3.733
Control 21 4.110 Sig. 1.000 1.000 1.000 1.000 1.000
TABLE 7.21: AIRWAY WALL THICKNESS(AWWT)
Airway Wall Thickness(AWWT)
Tukey HSD
GOLD STAGE N
Subset for alpha = 0.05 1 2 3 Control 21 1.300 Stage I 6 1.417 Stage II 18 1.461 Stage III 13 1.485
Stage IV 12 1.600
Sig. 1.000 .428 1.000
TABLE 7.22: INNER AREA (mm2)
Inner Area (mm2)
Tukey HSD
GOLD STAGE N
Subset for alpha = 0.05
1 2 3 4 5
Stage IV 12 6.325 Stage III 13 7.731 Stage II 18 9.211 Stage I 6 10.467
79
TABLE 7.23: OUTER AREA (mm2)
Outer Area (mm2)
Tukey HSD
GOLD STAGE N
Subset for alpha = 0.05
1 2 3 4
Stage IV 12 28.700 Stage III 13 29.415 29.415 Stage II 18 31.772 31.772
Stage I 6 33.867 33.867 Control 21 35.395 Sig. .953 .145 .241 .554
TABLE 7.24: WALL AREA (mm2)
Wall Area (mm2)
Tukey HSD
GOLD STAGE N
Subset for alpha =
0.05 1 Stage III 13 21.685
Control 21 22.114
Stage IV 12 22.375
Stage II 18 22.561
Stage I 6 23.400
Sig. .263
80
RESULTS:
1. Among the 70 subjects studied, 21 subjects without COPD (no spirometric evidence of airway obstruction) served as control and 49 cases with COPD served as cases.
2. The study group consisted of 6 subjects with GOLD stage 1 disease (12%), 18 subjects with GOLD stage 2 disease (37%), 13 subjects with GOLD stage 3 disease (27%), and 12 subjects with GOLD stage 4 disease (24%).
3. The cohort consists of 57 men (81%) and 13 women (19%).
In the 49 subjects with COPD,
Progressively increasing LAA-950I (Low attenuation area in Inspiration
<-950HU) and LAA856E (Low attenuation areas in Expiration <-856HU) were noted for increasing GOLD stage and COPD disease severity.
Mean LAA-950I and LAA856E values progressively increased with increasing
GOLD stage (p < 0.005).
For air trapping, LAA-856E showed correlation for both FEV1 and FEV1/FVC
(r = –0.93 and –0.79, respectively) (Figure 7.6 & 7.7).
Emphysema showed similar results, with LAA-950I showing correlation for
FEV1 and FEV1/FVC (r = –0.81 and –0.69, respectively) (Figure 7.4 & 7.5).
Other measures, such as the difference in mean lung attenuation, showed very
high correlation with spirometric measures also.
81
airway wall thickness, inner area, inner diameter and outer area showed
good correlation to both FEV1 and FEV1/FVC for all subjects in the
cohort.
Measures of wall area showed poor correlation to both FEV1 (r -.01) and
[image:87.595.149.444.280.521.2]FEV1/FVC (r -.02)
82 FIGURE 7.5: Scatterplot shows LAA-950I and ratio of FEV1 to forced vital capacity (FVC). Line shows linear correlation.
[image:88.595.122.454.394.671.2]84
8.DISCUSSION
The potential usefulness of CT for identification of regions of pulmonary emphysema and air trapping has been addressed in many investigations[72-74].. Several lung attenuation parameters have been developed based on results of histogram analysis of the frequency distribution of the attenuation values of the lung, to objectively quantify pulmonary emphysema with CT.
The purpose of our study was to determine whether measurements of lung attenuation obtained from 3D lung reconstructions at inspiration and expiration reflect the severity of chronic obstructive pulmonary disease (COPD). We correlated lung function measurements at inspiration and expiration with measurements of lung attenuation on 3D lung reconstructions. We also evaluated the relationship between severity of COPD, reflected by GOLD staging[1], and measurements of lung attenuation on 3D lung reconstructions.
Among the 70 subjects studied, 21 subjects without COPD (no spirometric evidence of airway obstruction) served as control and 49 subjects with COPD served as cases.
The study group consisted of 6 subjects with GOLD stage 1 disease (12%), 18 subjects with GOLD stage 2 disease (37%), 13 subjects with GOLD stage 3 disease (27%), and 12 subjects with GOLD stage 4 disease (24%).
The cohort consists of 57 men (81%) and 13 women (19%).
85 measures of FEV1 and FEV1/FVC and that these parameters increase in severity with increasing GOLD stage. Statistical analysis suggests that CT-determined LAA-856E is strongly associated with decline in airflow in patients with COPD. CT is uniquely able to detect, classify, and quantify LAA-950I in adults. The quantitative assessment of low-attenuation areas is based on determining the percentage of lung pixels that are below –950 HU (ie, density mask technique)[66,68,69].
Madani et al.[66]reported that the best correlation between QCT and macroscopic and microscopic measures of emphysema was obtained using a density mask technique with a threshold level of –960 or –970 HU, although the correlation for a threshold of –950 HU was almost as high. Because of concerns that a threshold of –960 or –970 HU might exclude milder degrees of emphysema, we selected a threshold of –950 HU for the purposes of this study.
In subjects with severe asthma, Busacker et al.[75] used a threshold for assessing air trapping of –850 HU on chest CT scans obtained at FRC. The selection of –856 HU as the threshold for air trapping on expiratory CT is based on the fact that –856 HU is the mean attenuation of normally inflated lung (≈ 6 mL air per gram of lung) on inspiration. Therefore, in a normal lung, the attenuation should be higher than –856 HU on expiration. The results of our study confirm that there is a strong relationship between air trapping measured on expiratory CT and expiratory airflow obstruction assessed by FEV1 and FEV1/FVC ratio; these findings suggest that this measure provides a robust independent measure of airflow obstruction.
86 percentage of predicted FEV1 than those obtained in proximal (large) airways. These findings may indicate that airflow limitation is more closely related to the dimensions of the small airways than to those of the large airways.
87
9.LIMITATIONS OF STUDY:
Our study was associated with multiple limitations.
The CT attenuation values are affected by variation in inspiratory and
expiratory lung volumes and acquisition techniques.
Limited number of study subjects (70).
Poor breath holding by subjects affected the correct measurement of lung
volumes (TLC & ERC).
Manual measurement of 4th generation segmental bronchial measurements.
Full-body plethysmography was not performed as part of this study; hence,
88
10. CONCLUSION:
We conclude that QCT measurements of inspiratory and expiratory low-attenuation areas are strongly associated with spirometric impairment in subjects with COPD.
QCT of the lung parenchyma uses accurate measures of lung density to generate histogram statistics of the lung to detect lower-density areas of the lung that correspond to emphysema on total lung capacity (TLC) scans and can also look at lower-density areas of the lung that correspond to air trapping on CT scans of the lung obtained at functional residual capacity (FRC) or residual volume(RV). The detection of the emphysema is a direct measure of lung remodeling in COPD, and the detection of air trapping is an indirect measure of small airway disease.
Although univariate correlation between airway measures and spirometric impairment is less strong, inclusion of these measures in the multiple regression model strengthens the correlation.
REFERENCES
1. Global Initiative for Chronic Obstructive Lung Disease. Global strategy for the diagnosis, management, and prevention of chronic obstructive pulmonary disease. Bethesda, Md: National Heart, Lung, and Blood Institute, World Health Organization, 2008.
2. Murray CJL, Lopez AD. Evidence-based health policy—Lessons from the Global Burden of Disease Study. Science 1996;274:740-3.
3. Fujimoto K, Kitaguchi Y, Kubo K, Honda T. Clinical analysis of chronic obstructive pulmonary disease phenotypes classified using high-resolution computed tomography. Respirology 2006;11:731-40.
4. Makita H, NasuharaY, Nagai K, Ito Y, Hasegawa M, Betsuyaku T, et al. Characterisation of phenotypes based on severity of emphysema in chronic obstructive pulmonary disease. Thorax 2007;62:932-7.
5. Webb WR, Muller NL, Naidich DP. High-resolution CT of the lung. 4th ed. Philadelphia, Pa: Lippincott Williams & Wilkins; 2009.
6. Coxson HO, Rogers RM. Quantitative computed tomography of chronic obstructive pulmonary disease. Acad Radiol 2005; 12:1457–1463.
8. Gevenois PA, De Vuyst P, de Maertelaer V, et al. Comparison of computed density and microscopic morphometry in pulmonary emphysema. Am J Respir Crit Care Med 1996; 154:187–192.
9. Müller NL, Staples CA, Miller RR, Abboud RT. ―Density mask‖: an objective method to quantitate emphysema using computed tomography. Chest 1988; 94:782–787.
10. John D. Newell, Jr. Quantitative Computed Tomography of Lung Parenchyma in Chronic Obstructive Pulmonary Disease - An Overview. Proc Am Thorac Soc Vol 5. pp 915–918, 2008.
11. Fujimoto K, Kitaguchi Y, Kubo K, Honda T. Clinical analysis of chronic obstructive pulmonary disease phenotypes classified using high-resolution computed tomography. Respirology 2006;11:731–740.
12. Makita H, Nasuhara Y, Nagai K, et al. Characterisation of phenotypes based on severity of emphysema in chronic obstructive pulmonary disease. Thorax 2007;62:932–937.
13. Larsen, William J. (2001). Human embryology (3. ed.). Philadelphia, Pa.: Churchill Livingstone. p. 143. ISBN 0-443-06583-7.
14. Sadler, T. (2010). Langman's medical embryology (11th ed.). Philadelphia: Lippincott William & Wilkins. pp. 202–204. ISBN 978-0-7817-9069-7.
disease: National Heart, Lung, and Blood Institute and World Health Organization Global Initiative for Chronic Obstructive Lung Disease (GOLD): executive summary. Respir Care. 2001;46(8):798–825.
16. Jones PW. Health status measurement in chronic obstructive pulmonary disease. Thorax. 2001;56(11):880–7.
17. Harrison 19th Edition, Dennis Casper, Anthony Fauci, Stephen Hauser, Dan Longo, J.Larry Jameson, Joseph Loscalzo.
18. Saetta M, Ghezzo H, Kim WD, et al. Loss of alveolar attachments in smokers: a morphometric correlate of lung function impairment. Am Rev Respir Dis 1985;132:894–900.
19. Gelb AF, Hogg JC, Muller NL, et al. Contribution of emphysema and small airways in COPD. Chest 1996;109:353–359.
20. Hogg JC, Wright JL, Wiggs BR, Coxson HO, Opazo Saez A, Pare PD. Lung structure and function in cigarette smokers. Thorax 1994;49:473–478.
21. Petty TL, Silvers GW, Stanford RE. Radial traction and small airways disease in excised human lungs. Am Rev Respir Dis 1986;133:132–135.
22. Lamb D, McLean A, Gillooly M, et al. Relation between distal airspace size, bronchiolar attachments, and lung function. Thorax 1993;48:1012–1017.
24. Foster WL Jr, Gimenez EI, Roubidoux MA, et al. The emphysemas: radiologic-pathologic correlations. RadioGraphics 1993;13:311–328.
25. Stern EJ, Frank MS. CT of the lung in patients with pulmonary emphysema: diagnosis, quantification, and correlation with pathologic and physiologic findings. AJR Am J Roentgenol. 1994;162 (4): 791-8.
26. Robertson RJ. Imaging in the evaluation of emphysema. Thorax. 1999;54 (5): 379.
27. Collins J, Stern EJ. Chest radiology, the essentials. Lippincott Williams & Wilkins. (2007) ISBN:0781763142.
28. Sanders C, Nath PH, Bailey WC. Detection of emphysema with computed tomography: correlation with pulmonary function tests and chest radiography. Invest Radiol 1988;23:262–266.
29. Leopold JG, Gough J. The centrilobular form of hypertrophic emphysema and its relation to chronic bronchitis. Thorax 1957;12:219–235.
30. Wyatt JP, Fischer VW, Sweet HC. Panlobular emphysema: anatomy and pathodynamics. Dis Chest 1962;41:239–259.
31. Heard BE. A pathological study of emphysema of the lungs with chronic bronchitis. Thorax 1958;13: 136–149.
33. Stoel BC, Putter H, Bakker ME, Dirksen A, Stockley RA, Piitulainen E, et al. Volume correction in computed tomography densitometry for follow-up studies on pulmonary emphysema. Proc Am Thorac Soc. 2008 Dec 15; 5(9):919–24.
34. Kinsella M, Muller NL, Abboud RT, Morrison NJ, DyBuncio A. Quantitation of emphysema by computed tomography using a ―density mask‖ program and correlation with pulmonary function tests. Chest 1990;97:315–321.
35. Bankier AA, De Maertelaer V, Keyzer C, Gevenois PA. Pulmonary emphysema: subjective visual grading versus objective quantification with macroscopic morphometry and thin-section CT densitometry. Radiology 1999;211:851–858.
36. Muller NL, Staples CA, Miller RR, Abboud RT. ―Density mask‖: an objective method to quantitate emphysema using computed tomography. Chest 1988;94:782–787.
37. Gould GA, MacNee W, McLean A, et al. CT measurements of lung density in life can quantitate distal airspace enlargement: an essential defining feature of human emphysema. Am Rev Respir Dis 1988;137:380–392.
38. Hogg JC, Chu F, Utokaparch S, et al. The nature of small-airway obstruction in chronic obstructive pulmonary disease. N Engl J Med 2004;350:2645–2653.
40. Kuwano K, Bosken CH, Paré PD, Bai TR, Wiggs BR, Hogg JC. Small airways dimensions in asthma and in chronic obstructive pulmonary disease. Am Rev Respir Dis 1993;148:1220–1225.
41. Finkelstein R, Fraser RS, Ghezzo H, Cosio MG. Alveolar inflammation and its relation to emphysema in smokers. Am J Respir Crit Care Med 1995;152: 1666–1672.
42. James AL, Wenzel S. Clinical relevance of airway remodelling in airway diseases. Eur Respir J 2007;30: 134–155.
43. Macklem PT, Proctor DF, Hogg JC. The stability of peripheral airways. Respir Physiol 1970;8:191–203.
44. Zaporozhan J, Ley S, Eberhardt R, et al. Paired inspiratory/expiratory volumetric thin-slice CT scan for emphysema analysis: comparison of different quantitative evaluations and pulmonary function test. Chest 2005;128:3212– 3220.
45. Newman KB, Lynch DA, Newman LS, Ellegood D, Newell JD Jr. Quantitative computed tomography detects air trapping due to asthma. Chest 1994;106: 105–109.
47. Hansell DM, Rubens MB, Padley SP, et al. Obliterative bronchiolitis: individual CT signs of small airways disease and functional correlation. Radiology 1997;203:721–726.
48. Kauczor HU, Hast J, Heussel CP, et al. CT attenuation of paired HRCT scans obtained at full inspiratory/expiratory position: comparison with pulmonary function tests. Eur Radiol 2002;12:2757–2763.
49. Eda S, Kubo K, Fujimoto K, Matsuzawa Y, Sekiguchi M, Sakai F. The relations between expiratory chest CT using helical CT and pulmonary function tests in emphysema. Am J Respir Crit Care Med 1997;155:1290–1294.
50. Kubo K, Eda S, Yamamoto H, et al. Expiratory and inspiratory chest computed tomography and pulmonary function tests in cigarette smokers. Eur Respir J 1999;13:252–256.
51. O’Donnell RA, Peebles C, Ward JA, et al. Relationship between peripheral airway dysfunction, airway obstruction, and neutrophilic inflammation in COPD. Thorax 2004;59:837–842.
52. Nakano Y, Wong JC, de Jong PA, et al. The prediction of small airway dimensions using computed tomography. Am J Respir Crit Care Med 2005;171: 142–146.
54. Orlandi I, Moroni C, Camiciottoli G, et al. Chronic obstructive pulmonary disease: thin-section CT measurement of airway wall thickness and lung attenuation. Radiology 2005;234:604–610.
55. Berger P, Perot V, Desbarats P, Tunon-de-Lara JM, Marthan R, Laurent F. Airway wall thickness in cigarette smokers: quantitative thin-section CT assessment. Radiology 2005;235:1055–1064.
56. Cordasco EM, Beerel FR, Vance JW, Wende RW, Toffolo RR. Newer aspects of the pulmonary vasculature in chronic lung disease: a comparative study. Angiology 1968;19:399–407.
57. Hale KA, Niewoehner DE, Cosio MG. Morphologic changes in the muscular pulmonary arteries: relationship to cigarette smoking, airway disease, and emphysema. Am Rev Respir Dis 1980;122:273–278.
58. Wright JL, Lawson L, Paré PD, et al. The structure and function of the pulmonary vasculature in mild chronic obstructive pulmonary disease: the effect of oxygen and exercise. Am Rev Respir Dis 1983;128: 702–707.
59. Peinado VI, Barbera JA, Ramirez J, et al. Endothelial dysfunction in pulmonary arteries of patients with mild COPD. Am J Physiol 1998;274:L908– L913.
61. Santos S, Peinado VI, Ramirez J, et al. Enhanced expression of vascular endothelial growth factor in pulmonary arteries of smokers and patients with moderate chronic obstructive pulmonary disease. Am J Respir Crit Care Med 2003;167:1250–1256.
62. Barr RG, Mesia-Vela S, Austin JH, et al. Impaired flow-mediated dilation is associated with low pulmonary function and emphysema in ex-smokers: the Emphysema and Cancer Action Project (EMCAP) Study. Am J Respir Crit Care Med 2007;176: 1200–1207.
63. Kanazawa H, Asai K, Hirata K, Yoshikawa J. Possible effects of vascular endothelial growth factor in the pathogenesis of chronic obstructive pulmonary disease. Am J Med 2003;114:354–358.
66. Madani A, Zanen J, de Maertelaer V, Gevenois PA. Pulmonary emphysema: objective quantification at multi-detector row CT—comparison with macroscopic and microscopic morphometry. Radiology 2006;238:1036–1043.
67. Dirksen A, Dijkman JH, Madsen IF, Stoel B, Hutchison DCS, et al. A randomized clinical trial of a-1 antitrypsin augmentation therapy. American Journal of Respiratory and Critical Care Medicine. 1999;160:1468–1472.
68. Hasegawa M, Nasuhara Y, Onodera Y, et al. Airflow limitation and airway dimensions in chronic obstructive pulmonary disease. Am J Respir Crit Care Med 2006;173:1309–1315.
visual emphysema scores, and pulmonary function test results. Radiology 1999;211:541–547
70. Knudson RJ, Standen JR, Kaltenborn WT, et al. Expiratory computed tomography for assessment of suspected pulmonary emphysema. Chest 1991; 99: 1357–1366.
71. Fujimoto K, Kitaguchi Y, Kubo K, Honda T. Clinical analysis of chronic obstructive pulmonary disease phenotypes classified using high-resolution computed tomography. Respirology 2006;11:731–740.
72. Zompatori M, Fasano L, Mazzoli M, et al. Spiral CT evaluation of pulmonary emphysema using a low-dose technique. Radiol Med (Torino) 2002; 104:13– 24.
73. Mishima M, Itoh H, Sakai H, et al. Optimized scanning conditions of high resolution CT in the follow-up of pulmonary emphysema. J Comput Assist Tomogr 1999; 23: 380–384.
74. Coxson HO, Rogers RM. Quantitative computed tomography of chronic obstructive pulmonary disease. Acad Radiol 2005; 12:1457–1463.
ABBREVIATIONS
COPD : Chronic Obstructive Pulmonary Disease
GOLD : Global Initiative for Chronic Obstructive Lung Disease HRCT : High-resolution computed tomography
QCT : Quantitative CT
PFT : Pulmonary Function Test TLC : Total Lung Capacity
FRC : Functional Residual Capacity RV : Residual Volume
FEV1 : Forced Expiratory Volume (volume of air removed in first second)
FVC : Forced Vital Capacity (total volume of air removed during forceful expiration after maximal inhalation)
VEGF : Vascular endothelial growth factor HU : Hounsfield unit
MLAI : Mean Lung Attenuation in Inspiration MLAE : Mean Lung Attenuation in Expiration AWWT : Airway Wall Thickness
DATA COLLECTION PROFORMA
NAME: AGE: SEX:
IP/OP NUMBER: OCCUPATION: ADDRESS:
CONACT NUMBER:
PRESENTING COMPLAINTS: SMOKING HISTORY:
OTHER COMORBIDITIES:
PFT VALUES
FEV1 FVC
QCT VALUES
Inspiratory CT
% Lung pixels ≤ –950HU Mean lung attenuation (HU) TLC(CT)
Expiratory CT
% Lung pixels ≤ –856HU Mean lung attenuation (HU) FRC(CT)
Airway
Inner diameter (mm)
Airway wall thickness (mm) Outer area (mm2)
PATIENT INFORMATION SHEET
“ROLE OF QUANTITATIVE CT IN COPD & ITS CORRELATION WITH
PULMONARY FUNCTION TEST VALUES”
Your cooperation would be valuable to us for the same
The privacy of patients in the research will be maintained throughout the study. In the event of any publication or presentation resulting from the research, no personally identifiable information will be shared.
Taking part of the study is voluntary. You are free to decide whether to participate in this study or to withdraw at any time. Your decision will not result in any loss of benefits to which you are otherwise entitled.
The result of the special study may be intimated to you at the end of the study period or during the study if anything is found abnormal which may aid in the management or treatment.
Signature of the investigator Signature of participant
PATIENT CONSENT FORM
“ROLE OF QUANTITATIVE CT IN COPD & ITS CORRELATION WITH
PULMONARY FUNCTION TEST VALUES”
PARTICIPANT’SNAME:
AGE:
SEX:
OP/IP.NO. :
I confirm that I have understood the purpose of procedure for the above
study.I have the opportunity to ask the questions and all my questions and doubts have been answered to my satisfaction.
I have been explained about the pitfall in the procedure.I have been explained about the safety,advantage and disadvantage of the technique.
I understand that my participation in the study is voluntary and that I’m free to withdraw at any