White Rose Research Online URL for this paper:
http://eprints.whiterose.ac.uk/141661/
Version: Accepted Version
Article:
McBride, Emma E., Krygier, A., Ehnes, A et al. (17 more authors) (2019) Phase Transition
Lowering in Dynamically Compressed Silicon. Nature Physics. 89–94. ISSN 1745-2473
[email protected] https://eprints.whiterose.ac.uk/
Reuse
Items deposited in White Rose Research Online are protected by copyright, with all rights reserved unless indicated otherwise. They may be downloaded and/or printed for private study, or other acts as permitted by national copyright laws. The publisher or other rights holders may allow further reproduction and re-use of the full text version. This is indicated by the licence information on the White Rose Research Online record for the item.
Takedown
If you consider content in White Rose Research Online to be in breach of UK law, please notify us by
Phase Transition Lowering in Dynamically-Compressed Silicon
1
E. E. McBride1,∗,†, A. Krygier2
, A. Ehnes1
, E. Galtier3
, M. Harmand2
, Z. Konˆopkov´a1
, H. J. Lee3 ,
2
H.-P. Liermann1
, B. Nagler3
, A. Pelka4
, M. R¨odel4
, A. Schropp1
, R. F. Smith5
, C. Spindloe6 ,
3
D. Swift5
, F. Tavella3
, S. Toleikis1
, T. Tschentscher7
, J. S. Wark8
, and A. Higginbotham9
4
1
Photon Science, Deutsches Elektronen-Synchrotron DESY, Notkestrasse 85, D-22607, Hamburg, Germany
5
2
IMPMC, UPMC, MNHN, IRD, Paris, France
6
3
SLAC National Accelerator Laboratory, 2575 Sand Hill Road, Menlo Park, California 94025, USA
7
4
Helmholtz-Zentrum Dresden-Rossendorf, P.O. Box 510119, D-01314 Dresden, Germany
8
5
Lawrence Livermore National Laboratory, 7000 East Avenue, Livermore, California 94550, USA
9
6
Central Laser Facility, STFC, Rutherford Appleton Laboratory,
10
Harwell Oxford, Didcot, OX11 0QX, United Kingdom
11
7
European XFEL GmbH, Holzkoppel 4, D-22869 Schenefeld, Germany
12
8
Department of Physics, Clarendon Laboratory, University of Oxford, Parks Road, Oxford OX1 3PU, UK
13
9
York Plasma Institute, Department of Physics, University of York, York, YO10 5DD, UK
14
15
† Present address: SLAC National Accelerator Laboratory,
16
2575 Sand Hill Road, Menlo Park, California 94025, USA and
17
‡ European XFEL GmbH, Albert-Einstein-Ring 19, D-22761 Hamburg, Germany
Silicon, being one of the most abundant elements in nature, attracts wide-ranging scientific and
19
technological interest. Specifically, in its elemental form, crystals of remarkable purity can be
pro-20
duced. One may assume that this would lead to Si being well understood, and indeed, this is the
21
case for many ambient properties, as well as for higher pressure behaviour under quasi-static loading.
22
However, despite many decades of study, a detailed understanding of the response of silicon to rapid
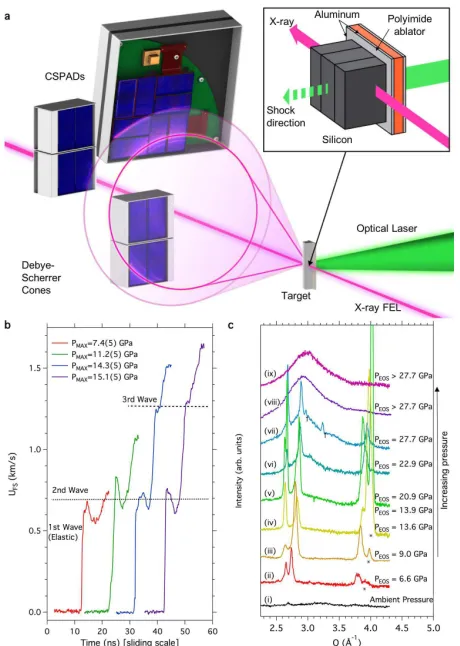
23
compression such as that experienced under shock impact – remains elusive. Here, we combine a
24
novel Free Electron Laser (FEL) based X-ray diffraction geometry with laser-driven compression to
25
elucidate the importance of shear generated during shock compression on the occurrence of phase
tran-26
sitions. We observe the lowering of the hydrostatic phase boundary in elemental silicon, an ideal model
27
system for investigating high-strength materials, analogous to planetary constituents. Moreover, we
28
unambiguously determine the onset of melting above 14 GPa, previously ascribed to a solid-solid phase
29
transition, undetectable in the now conventional shocked diffraction geometry; transitions to the liquid
30
state are expected to be ubiquitous in all systems at sufficiently high pressures and temperatures.
31
Since Bancroft[1] first reported shock-induced polymorphism over fifty years ago, solid-solid and solid-liquid phase
32
transitions have been the focus of innumerable shock-compression studies. Velocimetry techniques have been key
33
diagnostic tools in the inference of such phase transitions, with plateaus in density interpreted as plastic deformation
34
or phase transitions. However, such methods are not able to shed light on the crystallographic phase of material,
35
especially since effects, such as kinetics, have the potential to cause significant differences between statically and
36
dynamically determined sample response. In this work we focus on the behaviour of elemental silicon (Si), which
37
despite being well-understood under hydrostatic conditions, remains a subject of vigorous debate following dynamic
38
loading[2–6]. Under uniaxial compression conditions, significant shear is generated as the material resists compression,
39
a direct consequence of the material strength, yet the nature of the shear-relieving mechanism plasticity or via a phase
40
transformation), and the structure(s) of the proposed high pressure phases remain largely unknown.
41
More generally, previous works suggest that phase boundaries in rapidly-compressed solids depend strongly on the
42
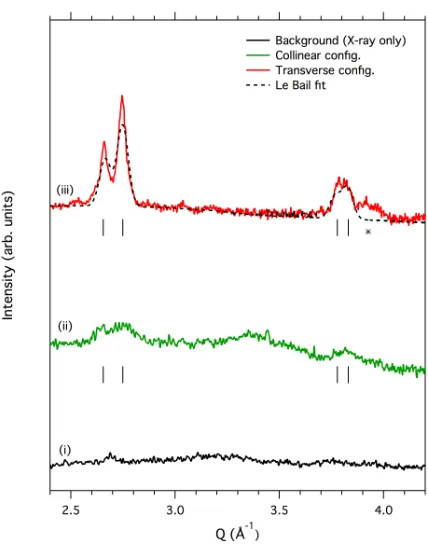
strain-rate of the compression, with a higher strain-rate drive (i.e. shock compression) leading to a higher transition
43
pressure[7, 8]. However, it is also suggested that the anisotropic nature of planar shock compression may lead to
44
significant shear stresses in samples, which can lead to lowering of phase transition boundaries from hydrostatically
45
determined values[9]. This points to the danger in the typical method of assigning phase transitions under shock
46
loading to those observed under hydrostatic conditions at similar pressure conditions. Moreover, it means that
47
phase transition pressures determined from dynamic compression experiments must be interpreted with care before
48
application to hydrostatic systems, such as planetary interiors.
49
As one of the most abundant elements in nature, Si attracts wide-ranging scientific and technological interest, and
50
hence many of its properties at ambient conditions, and at higher pressure under quasi-static loading, are well
un-51
derstood. Static compression experiments reveal a complex phase diagram, where thirteen different polymorphs have
52
been observed to date[10–17]. Of particular relevance to this work is the highly reconstructive phase transformation
53
from the ambient pressure semi-conducting cubic diamond (CD) structure to the metallicβ-tin structure at∼12 GPa,
54
with an associated 20% volume collapse[10]. On further increase of pressure, the closely related orthorhombic phase
55
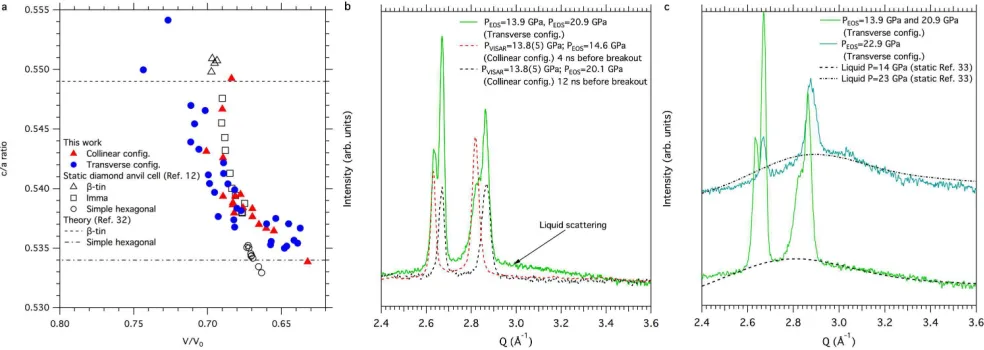
Imma is formed, which in turn transforms to a simple hexagonal (SH) crystal structure at 16 GPa[11, 13].
56
However, among dynamic-loading experiments, a clear consensus in the data is yet to emerge. Such studies using
57
velocimitery measurements report the observation of three distinct waves traversing the sample[3–6]. For example,
58
early work by Gust & Royce find waves at 5.4 GPa, 10.1 GPa and 13.7 GPa for compression along the [111] crystal
59
direction. Such waves are often interpreted as occurring at the onset pressure of shear dissipation mechanisms, such
60
as plasticity i.e. by the generation and motion of defects, or via a phase transformation. These velocimetry data
61
are therefore often taken to suggest that the first phase transition occurs at 10 GPa, in broad agreement with the
62
hydrostatically determined value of 12 GPa. The second wave emerging at 5.4 GPa is then assigned to plasticity within
63
the compressed CD phase. However, positive identification of the mechanisms associated with these waves in silicon
64
is still outstanding.
65
Numerous laser-driven compression experiments coupled with traditional laser-plasma X-ray sources have failed to
66
find evidence for higher pressure phases in compressed single crystal samples. Molecular dynamics (MD) simulations
67
have suggested that this may be due to any new phases forming small (sub-micron), potentially misaligned grains,
68
which would lead to highly diffuse diffraction features, difficult to detect in experiments using these conventional
69
laser-plasma X-ray sources[18]. The structure of the high pressure phase(s) adopted by Si on the Hugoniot, and the
70
nature of the two waves which emerge following the elastic wave, remains unknown, leaving the dynamic behaviour
71
of Si a matter of ongoing debate.
72
Here, we present a systematic study of the behaviour of Si following laser-driven shock-compression. Specifically,
73
we employ polycrystalline Si samples, and exploit the high brightness X-rays offered by Free Electron Lasers to study
74
diffuse reciprocal space features. In doing so, we are able to identify the structural response of the sample from its
75
ambient CD phase, through to shock-induced melting at 14 GPa, coinciding with the emergence of the third wave.
3
FIG. 1.Experimental configuration and data examples: athe transverse configuration whereby the compression laser was perpendicular to the X-ray beam. bVelocimetry data (VISAR) lineouts showing free surface velocity (UF S). Laser intensity
increases to the right. Dashed lines indicate the onset of the 2nd and 3rd wave. c Azimuthally integrated 1D diffraction patterns as a function of increasing laser intensity and hence increasing pressure in both the transverse: (i), (ii), (iv), (v), (ix) and collinear (iii), (vi), (vii), (viii) configurations. Peaks marked with the∗symbol belong to the compressed cubic diamond phase. Peaks marked with the†symbol cannot be described by the cubic diamond,β-tin,Imma, or simple hexagonal phases.
Crucially, we observe a lowering of two solid-solid phase boundaries from their hydrostatically determined values,
77
suggesting the significant role that shear stress plays in modifying the phase diagram of Si.
78
Experiments were conducted at the Matter in Extreme Conditions (MEC) endstation at the Linear Coherent
79
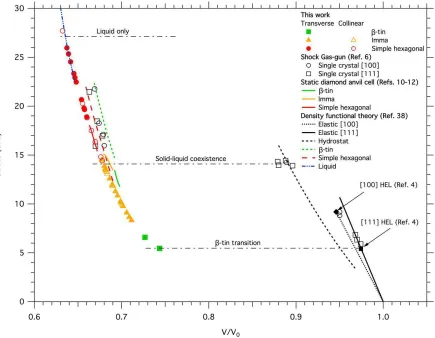
Light Source (LCLS)[19]. Polycrystalline silicon samples, with 50 µm polyimide ablators, were shock compressed
80
via irradiation with the nanosecond pulsed Nd:glass laser system. During shock transit through the Si sample, the
81
high brightness LCLS X-ray beam was used to determine the structure of the material via X-ray diffraction in a
82
Debye-Scherrer geometry. Two distinct experimental geometries were employed in this work. The first is a ‘collinear’
83
geometry, where the X-ray beam is incident at around 11◦ to the target normal, and thus to the direction of shock 84
compression. This is a common geometry at LCLS[20–24], and other laser-plasma based experiments[25–28]. It is
85
described in Supp. Info. Sec. I.
86
However, this configuration has the distinct disadvantage of providing a signal that integrates through all states
87
within the sample. This greatly complicates both the detection and the analysis of low-symmetry complex phases on
88
the Hugoniot, including melting, where multiple high-pressure phases may be present in successive compression waves.
89
The second ‘transverse’ geometry aims to resolve this shortcoming by driving the shockwaveperpendicularto the LCLS
90
beam direction (Fig. 1 (a)). In this configuration, by taking advantage of the highly collimated and microfocussed
91
beam available at the LCLS we ensure that, predominantly, a single wave in the multi-wave compression response is
92
probed, greatly aiding interpretation and phase identification. Further details of the experimental configurations and
93
target designs employed are confined to the Methods section and Supp. Info. Secs. I-III. A detailed comparison of
94
the collinear and transverse configurations is found in the Supp. Info. Sec. VI.
95
Utilising optical velocimetry (VISAR) combined with X-ray diffraction in the collinear configuration, the wave
96
profile as a function of laser intensity was investigated, and the sample pressure was inferred from the free surface
velocity, UF S (Supp. Info. Sec. IV). An example of typical velocimetry traces may be seen in Fig. 1 (b). The 98
wave profiles observed were in good agreement with previous laser and gas-gun based shock experiments[3, 6]. Here,
99
consistent with previous studies, we observe the significant elastic response, followed by a pullback and a second wave,
100
often ascribed to plastic deformation. Above 14 GPa (UF S ∼1.3 km/s), we observe a plateau in the velocity-time data 101
indicating a change in sound speed in the sample. Following the plateau we observe the emergence of a third wave,
102
again consistent with previous studies. The plateau is described as the onset of a structural phase transition. As these
103
polycrystalline samples have large grains (∼100µm) with different orientations, we observe that the magnitude of the
104
elastic response differs from shot to shot depending on the starting orientation of the sample – varying from 6.6(5)
105
GPa to 7.9(5) GPa (Supp. Info. Fig. 6). This is consistent with the previously-reported orientational dependence
106
of the elastic response of single-crystal[4]. We also note that the plateau observed is independent of the starting
107
orientation, consistent with previous studies[6].
108
Figure 1 (c) shows azimuthally integrated 1D diffraction patterns as a function of increasing laser intensity, and
109
hence increasing pressure, in both geometries (see caption). As the initial grain size of the sample is large compared
110
to the X-ray beam diameter (10-40µm), prior to the shock, we are unlikely to satisfy the Bragg condition due to
111
preferred orientation. Therefore the diffraction profile is flat (Fig. 1 (c i)). As laser intensity is increased we observe
112
the emergence of sharp peaks, consistent with the formation of a new phase (Fig. 1 (c ii)). Note, in some diffraction
113
patterns we also observe reflections belonging to the compressed CD phase (∗ symbols), suggesting the generation
114
of smaller grains of CD material between domains of the newly formed high pressure phase. An example of the 2D
115
diffraction images may be seen in Fig. 1 (a), and in Supp. Info. Fig. 7. Here, the smooth Debye-Scherrer rings
116
belong to the high pressure phase, and indicate that the large grains of the initial CD phase have broken up into
117
nanometer-sized grains, inferred from the smooth powder rings observed in the 2D diffraction patterns.
118
In the collinear configuration, at a pressure of 7.4(5) GPa, just above the elastic limit, we observe an increase in
119
scattering intensity of diffraction features at Q∼2.7 and Q ∼3.8 ˚A−1
(Fig. 2 (ii)), but here the structure cannot
120
be fully resolved. By using the same laser-drive conditions, in the transverse geometry we can clearly assign these
121
features to theβ-tin structure, with ac/aratio of 0.550, as shown by the diffraction pattern Fig. 2 (iii). A Le Bail fit
122
is shown by the dotted black line, and is in excellent agreement with the data [29]. A distinguishing feature used to
123
identify the high pressure phases is the evolution of thec/aratio as a function of pressure. Theβ-tin structure has a
124
c/avalue of 0.550, and the SH a value of 0.533; thec/aratio of theImma structure evolves from 0.550 to 0.533 with
125
increasing pressure [12] (See Methods). As laser intensity, and hence pressure is increased to 9.0(5) GPa, we observe
126
what can be best described as a mixed phase (Fig. 1 (c iii)), consisting of both the β-tin andImma structures. At
127
9.4(5) GPa, the high-pressure phase transforms completely to theImma structure (Fig. 1 (c iv), with no evidence of
128
co-existence withβ-tin. TheImma structure also co-exists with the compressed CD phase. This phase co-existence
129
has previously been observed in quasi-hydrostatic diamond anvil cell studies [12, 13].
130
Hence, we observe that, for laser-driven compression, rather than through plastic deformation, the significant shear
131
stress at the Hugoniot elastic limit (HEL) is consistent with being relieved via a phase transformation to a mixed phase
132
of CD and a high-pressure structure i.e. the dominant shear dissipation mechanism as the material is compressed
133
beyond the HEL is a phase transformation. As suggested by Mogniet al.[18] in their MD simulations, we observe that
134
the second wave is concurrent with transformation to a body-centred tetragonal structure, yet we identify it as theβ
-135
tin phase, rather thanImmaas they suggest. Moreover, we note a considerable lowering of the onset of theβ-tin phase
136
transformation as compared with hydrostatic diamond anvil cell experiments – from 12 GPa in ref. [12] down to as low
137
as 5.4(5) GPa in this work. Such an effect has been observed inab initio simulations where it was suggested that the
138
transition pressure decreases from 11.4 GPa under hydrostatic conditions to 3.9 GPa under uniaxial compression[30].
139
Additionally, in experimental studies combining resistivity measurements with nanoindentation techniques, Gupta &
140
Ruoff[31] note that the onset of the metallic phase, interpreted as the onset of the β-tin phase, lowers from 12 GPa
141
in under static loading, to 8 GPa under a compression rate of 1 kbar/sec, for compression along the [100] axis. This
142
work, therefore, highlights the failure of the long-standing approach of understanding the nature of shock-induced
143
phase transformation through comparison with hydrostatic phase transformations occurring at similar pressures.
144
As theImma structure is further compressed, we observe an evolution of thec/aratio as a function of normalised
145
volume (V/V0), (Fig. 3 (a)) away from the ideal experimental and theoreticalβ-tin values (0.550 and 0.549) towards
146
the ideal SH values (0.535 and 0.533), with the same trend observed in both the collinear and transverse experimental
147
configurations[12, 32]. At a c/aratio of 0.537, and a corresponding V/V0 of 0.681, we note a distinct change in the
148
gradient of the c/aratio, indicating a change in compressibility of the structure. This change occurs at a pressure
149
inferred via VISAR of 13.8(5) GPa, coinciding with the emergence of the third wave discussed above. One should note
150
that in our data obtained in the collinear configuration, we do not observe any additional scattering in the diffraction
151
patterns, that would be indicative of the formation of a second new phase, and hence account for such a change in
152
compressibility (Fig. 3 (b)).
153
Owing to the unique ability that we are afforded by the transverse configuration, we are able to isolate each of the
154
different waves as they traverse the sample following shock compression. We are therefore able to determine that the
5
FIG. 2. The greater sensitivity of the transverse configuration1D diffraction profiles in the collinear (ii) and transverse (iii) configurations. Profile (i) shows X-ray only pre-shot. The dotted black line under profile (iii) is a Le Bail fit to theβ-tin structure. The tick marks underneath diffraction profiles (ii) and (iii) indicate the position of the first fourβ-tin reflections. The∗symbol indicates reflections belonging to the compressed cubic diamond phase.
change in c/aratio coincides with the emergence of a broad diffuse feature, characteristic of a liquid or amorphous
156
sample, in coexistence with the solid (Fig 3 (b) and Fig. 1 (c v)). Moreover, we note that both the shape and position
157
of the broad diffuse peak are in good agreement with that of liquid silicon at 14 GPa (Fig. 3 (c)), as determined
158
through static compression techniques combined with synchrotron X-ray diffraction[33]. Notably, we do not observe
159
the second strong broad diffraction peak at Q∼3.6 ˚A−1
characteristic of the high-density amorphous polymorph at
160
P∼13 GPa, and therefore conclude that the diffuse scattering is most consistent with the liquid state (Supp. Info.
161
Fig. 9).[34] The third wave, rather than being due to a solid-solid phase transition as previously reported, is therefore
162
attributed to shock-induced melting along the Hugoniot.
163
In comparing diffraction from both configurations, we note that in the collinear configuration we are overwhelmed
164
by the solid Bragg diffraction and insensitive to the presence of liquid diffraction until we have incubated a significant
165
fraction of the liquid phase (Supp. Info. Fig. 13). Moreover, in the collinear configuration, the amount of volumetric
166
compression as determined from the diffraction patterns is directly related to the timing of the X-rays with respect
167
to the supported shock (Supp. Info Fig. 12). It is clear from Fig. 3 (b) that, in the collinear geometry, depending on
168
the timing of the X-rays, we are sensitive to different parts of the wave profile, i.e. to different volumes (and hence
169
pressures), and insensitive to the onset of melting on the Hugoniot.
170
As pressure is increased, the solid Imma phase transforms to the SH phase, and the diffuse feature grows more
171
intense, as a larger volume fraction of the sample is now in the liquid state (Fig. 1 (c vi)). Due to the significant latent
172
heat of fusion of Si, the second highest of the elements, we observe that the Hugoniot follows the melting curve over
173
a considerable pressure range, as indicated by solid-liquid co-existence up to at least a V/V0 of 0.632 (P∼27 GPa)
174
as shown in Fig. 1 (c vii). Above 27 GPa, the sample is able to overcome the latent heat of fusion and melts entirely
175
(Fig. 1 (c viii & ix). Such a plateau of the Hugoniot along the melting line, and two-phase coexistence, has been
176
previously reported in laser-driven shock compression studies of diamond[35]. In contrast to recent shock-recovery
177
and MD studies on Si, at similar maximum pressures of 30 GPa, which suggest the formation of localised amorphous
178
banding[36, 37], we observe the occurrence of bulk, or complete, melting of the sample. Hence, we conclude that the
179
formation of bands of amorphous and CD Si is formed on release to ambient pressure following shock compression,
180
demonstrating the importance ofin situ measurements.
181
In their recent work combining a gas-gun pressure driver and synchrotron X-ray diffraction, Turneaure et al. [38]
182
report that at P∼19 GPa, above the onset of the third wave, Si adopts the SH structure. However, unlike our work,
they find no evidence of melting in their diffraction data. In their study, the sample was initially shock-compressed
184
to a peak pressure of 26 GPa, and only conclusively identified transforming to the SH structure after at least one
185
reflection of the phase transformation wave had passed back through the silicon, releasing pressure. Hence they were
186
probing an off-Hugoniot, and rather complex, hydrodynamic state.
[image:7.612.55.547.110.285.2]187
FIG. 3. Evidence of the onset of melting: aEvolution of the c/a ratio as a function of volumetric change (V/V0) in
the collinear (blue circles) and transverse (red triangles) configurations. Open symbols are from a hydrostatic diamond anvil cell study Ref. 12: β-tin (triangles), Imma (squares), simple hexagonal (circles). Theoretical idealc/a ratios from Ref. 32 are shown for β-tin (dashed line) and the simple hexagonal (dot-dashed line). bComparison of azimuthally integrated 1D diffraction patterns in the collinear and transverse configurations. In the transverse configuration we are more sensitive to the onset of melting, as indicated by the emergence of a broad diffuse peak characteristic of a liquid phase. c1D diffraction patterns in the transverse configuration showing a significant region of solid-liquid co-existence on the Hugoniot. The emergence of the broad diffuse peak at ∼14 GPa is in good agreement with both the position and shape of the liquid peak as determined by static compression experiments, Ref. 33.
Moreover, the lack of liquid signal in their diffraction data is likely due to the transmission (collinear configuration)
188
geometry employed in their experiment. As we have demonstrated, in the oft used collinear geometry one is unable
189
to resolve the various components of a complex, multi-wave shock structure, and specifically one is insensitive to the
190
incubation of melting along the Hugoniot, particularly where there are regions of solid-liquid coexistence. By using the
191
novel transverse approach, collecting diffraction patterns perpendicular to the shock propagation direction, we have
192
much greater sensitivity to the onset of low-symmetry phase transitions and melting along the Hugoniot, expected in
193
all systems at sufficiently high pressures and temperatures.
194
The stress-volume plot shown in Fig. 4 compares the relative volume (V/V0) of the high-pressure phases from this
195
work with recent density functional theory calculations[39], and with static diamond anvil cell work.[12] We clearly
196
observe the occurrence of a shear-relieving solid-solid transition concurrent with the HEL, and the observation of the
197
high-pressure phases at considerably lower pressures than previously reported, below the stability field of the static
198
phases. It should also be noted that the additional reflections marked with the†symbol in diffraction profiles Fig. 1
199
(c vii) cannot be accounted for by any of the candidate structures observed statically up to 30 GPa – the CD,β-tin,
200
Immaor SH structure described in this manuscript. These diffraction peaks suggest that prior to melting entirely, we
201
may reach a mixed phase region between the liquid, the SH phase, and an additional solid phase. A likely candidate
202
is theCmca structure, which has been reported to co-exist with the SH phase at room temperature at close to 30
203
GPa[15]. However, with the observation of only a few weak reflections it is impossible to provide a full structural
204
solution to conclusively determine from which structure these additional peaks arise.
205
In conclusion, we have determined the nature of the multiple waves that traverse silicon samples following shock
206
compression. We show that the second wave is concurrent with a phase transition to aβ-tin structure, rather than
207
due to plasticity. We further determine that the third wave observed above P∼14 GPa is due to the onset of melting
208
along the Hugoniot, rather than due to a solid-solid transition as was previously reported. We observe that the solid
209
and liquid co-exist over a significant pressure range of ∆P∼10 GPa, before enough energy is supplied to overcome
210
the significant latent heat of fusion of silicon where the sample melts entirely, as indicated by the observation of only
211
the broad diffuse scattering at the highest pressure achieved, 30 GPa. We demonstrate that the now conventional
212
X-ray diffraction geometry for probing shock-compressed matter is insensitive to the onset of melting, expected in all
213
systems at extreme conditions.
214
Crucially, we demonstrate a shock-induced lowering of the onset of phase transitions, and thus modification of the
7
FIG. 4. Dynamic shear-lowering of phase transition boundaries: Stress-Volume plot of data obtained in this study, compared with density functional theory calculations (Ref. 39) and static diamond anvil cell experiments (Refs. 10-12). Hugoniot Elastic Limits for the [100] and [111] directions are from Ref. 4. Horizontal dot-dashed lines indicate phase transition boundaries from this study.
phase diagram away from that which would be determined utilising a diamond anvil cell-based (quasi-hydrostatic)
216
approach. Here, we find the lowering of two subsequent solid-solid phase transitions: CD→β-tin→Imma, illustrating
217
that compression experiments can have a profound impact on hydrostatic phase boundaries. Previous
shock-218
compression studies suggest that high strain-rates may cause phase transition boundaries to be shifted upwards in
219
pressure, relative to their static boundaries[7, 8]. Clearly, the influence of shock-induced shear and strain-rate on the
220
occurrence of phase transitions is non-trivial, and will have a significant impact when employing dynamic compression
221
techniques to explore high pressure phases of materials found in planetary interiors, where conditions are largely
222
hydrostatic and strain-rates are very low. In particular, careful attention will need to be paid when investigating
223
non-metallic systems, the dominant constituents of planetary interiors, which typically exhibit higher strength, and
224
may thus be more susceptible to the effects of shear-induced phase boundary modification.
225
I. ACKNOWLEDGEMENTS
226
E.E.M and A.S. acknowledge funding from the Volkswagen Foundation. J.S.W. is grateful for support from EPSRC
227
under grant EP/J017256/1. This work is supported by the French Agence Nationale de la Recherche (ANR) with
228
the ANR IRONFEL 12-PDOC-0011 Use of the Linac Coherent Light Source (LCLS), SLAC National Accelerator
229
Laboratory, is supported by the U.S. Department of Energy, Office of Science, Office of Basic Energy Sciences under
230
Contract No. DE-AC02-76SF00515. The MEC instrument is supported by the U.S. Department of Energy, Office of
231
Science, Office of Fusion Energy Sciences under contract No. SF00515. The authors thank J. B. Hastings and L. B.
232
Fletcher for a critical review of the manuscript.
II. AUTHOR CONTRIBUTIONS
234
E.E.M., A.H., and A.N. designed the experiment, and E.E.M., A.H., D.S. and C.S. designed the targets, and C.S.
235
manufactured the targets. E.E.M., A.K., M.H., E.G., Z.K., H-.J.L., B.N., A.P., M.R., A.S., C.S., F.T., S.T., T.T. and
236
A.H. contributed to the setup of the experiment and data collection. E.E.M. analysed the data, with assistance from
237
A.K., M.H., R.F.S. and A.H.. E.E.M. and A.H. interpreted the data. E.E.M., A.H. and J.S.W. wrote the manuscript.
238
All authors commented critically on the manuscript.
239
[1] Bancroft, D., Peterson, E. L. & Minshall, S., Polymorphism of iron at high pressure.J. Appl. Phys.27, 291-298 (1956) 240
[2] Colburn N. L., Forbes, J. W. & Jones, H. D., Electrical measurements in silicon under shock-wave compression.J. Appl.
241
Phys.43, 5007-5012 (1972) 242
[3] Smith, R. F., Minich, R. W., Rudd, R. E., Eggert, J. H., Bolme, C. A.,et al., Orientation and rate dependence in high 243
strain-rate compression of single-crystal silicon.Phys. Rev. B,86, 245204 (2012) 244
[4] Gust W. H. & Royce, E. B., Axial yield strengths and two successive phase transition stresses for crystalline silicon. J.
245
Appl. Phys.42, 1897-1905 (1971) 246
[5] Goto, T., Sato, T. & Syono, Y., Reduction of shear strength and phase-transition in shock-loaded silicon.Jpn. J. Appl.
247
Phys21, L369-L371 (1982) 248
[6] Turneaure, S. J., & Gupta, Y. M., Inelastic deformation and phase transformation of shock compressed silicon single 249
crystals.Appl. Phys. Lett.91, 201913 (2007) 250
[7] Smith, R. F., Eggert, J. H., Saculla, M. D., Jankowski, A. F., Bastea, M.,et al., Ultrafast dynamic compression technique 251
to study the kinetics of phase transformations in bismuth.Phys. Rev. Lett.101, 065701 (2008) 252
[8] Smith, R. F., Eggert, J. H., Swift, D. C., Wang, J., Duffy, T. S.,et al., Time-dependence of the alpha to epsilon phase 253
transformation in iron.J. Appl. Phys.114, 223507 (2013) 254
[9] Higginbotham, A., Stubley, P. G., Comley, A. J., Eggert, J. H., Foster, J. M.,et al., Inelastic response of silicon to shock 255
compression.Sci. Rep.6, 24211 (2016) 256
[10] Jamieson, J. C., Crystal structures at high pressures of metallic modifications of silicon and germanium, Science 139, 257
762-764 (1963) 258
[11] McMahon, M. I. & Nelmes R. J., New high-pressure phase of Si.Phys. Rev. B47, 8337-8340 (1993) 259
[12] McMahon, M. I., Nelmes, R. J., Wright, N. G. & Allan, D. R., Pressure dependence of the Imma phase of silicon.Phys.
260
Rev. B50, 739-743 (1994) 261
[13] Olijnyk, H., Sikka, S. K. & Holzapfel, W. B., Structural phase transitions in Si and Ge under pressures up to 50 GPa. 262
Phys. Lett. A103, 137-140 (1984) 263
[14] Duclos, S. J., Vohra, Y. K. & Ruoff, A. L., hcp-to-fcc transition in silicon at 78 GPa and studies to 100 GPa.Phys. Rev.
264
Lett.58, 775-777 (1987) 265
[15] Hanfland, M., Schwarz, U., Syassen, K. & Takemura, K., Crystal Structure of the High-Pressure Phase Silicon VI.Phys.
266
Rev. Lett.82, 1197-1200 (1999) 267
[16] Wentorf, R. H., & Kasper, J. S., Two new forms of silicon.Science 139, 338-339 (1963) 268
[17] Piltz, R. O., Maclean, J. R., Clark, S. J., Ackland, G. J., Hatton, P. D.,et al., Structure and properties of silicon XII: A 269
complex tetrahedrally bonded phase.Phys. Rev. B 52, 4072-4085 (1995) 270
[18] Mogni, G., Higginbotham, A., Ga´al-Nagy, K., Park, N. & Wark, J. S., Molecular dynamics simulations of shock-compressed 271
single-crystal silicon,Phys. Rev. B 89, 064104 (2014) 272
[19] Nagler, B., Arnold, B., Bouchard, G., Boyce, R. F., Boyce, R. M., Callen, et al., The Matter in Extreme Conditions 273
instrument at the Linac Coherent Light Source.J. Synchrotron Radiat.22, 520-525 (2015) 274
[20] Fletcher, L. B., Lee, H. J., D¨oppner, T., Galtier, E., Nagler, B.,et al., Ultrabright X-ray laser scattering for dynamic warm 275
dense matter physics.Nature Photon.9, 274-279 (2015) 276
[21] Gorman, M. G., Briggs, R., McBride, E. E., Higginbotham, A., Arnold, B., et al., Direct observation of melting in 277
shock-compressed bismuth with femtosecond X-ray diffraction.Phys. Rev. Lett.115, 095701 (2015) 278
[22] Gleason, A. E., Bolme, C. A., Lee, H. J., Nagler, B., Galtier, E.,et al., Ultrafast visualization of crystallization and grain 279
growth in shock-compressed SiO2.Nature Comms.6, 8191 (2015)
280
[23] Harmand, M., Ravasio, A., Mazevet, S., Bouchet, J., Denoeud, A., et al., X-ray absorption spectroscopy of iron at 281
multimegabar pressures in laser shock experiments.Phys. Rev. B 92, 024108 (2015) 282
[24] Kraus, D., Ravasio, A., Gauthier, M., Gericke, D. O., Vorberger, J.,et al., Nanosecond formation of diamond and ionsdaleite 283
by shock compression of graphite.Nature Comms.7, 10970 (2016) 284
[25] Rygg, J. R., Eggert, J. H., Lazicki, A. E., Coppari, F., Hawreliak, J. A., et al., Powder diffraction from solids in the 285
terapascal regime.Rev. Sci. Inst.83, 113904 (2012) 286
[26] Coppari, F., Smith, R. F., Eggert, J. H., Wang, J., Rygg, J. R.,et al., Experimental evidence for a phase transition in 287
magnesium oxide at exoplanet pressures.Nature Geo.6926-929 (2013) 288
[27] Lazicki, A., Rygg, J. R., Coppari, F., Smith, R., Fratanduono, D., et al., X-ray diffraction of solid tin to 1.2 TPa.Phys.
289
9
[28] Wang, J., Coppari, F., Smith, R. F., Eggert, J. H., Lazicki, A. E., et al., X-ray diffraction of molybdenum under shock 291
compression to 450 GPa.Phys. Rev. B 92, 174114 (2015) 292
[29] Le Bail, A. L., Whole powder pattern decomposition methods and applications: A retrospection.Powder Diffraction 20, 293
316-326 (2005) 294
[30] Cheng, C., Huang, W. H. & Li, H. J., Thermodynamics of uniaxial phase transition: Ab initio study of the diamond-to-β-tin 295
transition in Si and Ge.Phys. Rev. B 63, 153202 (2001) 296
[31] Gupta, M. C. & Ruoff, A. L., Static compression of silicon in the [100] and in the [111] directions. J. Appl. Phys. 51, 297
1072-1075 (1980) 298
[32] Lewis, S. P. & Cohen, M. L., Theoretical study of high-pressure orthorhombic silicon.Phys. Rev. B 48, 16144-16147 (1993) 299
[33] Funamori, N. & Tsuji, K., Pressure-induced structural changes of liquid silicon.Phys. Rev. Lett.88, 255508 (2002) 300
[34] Daisenberger, D., Wilson, M., McMillan, P. F., Quesada Cabrera, R., Wilding, M. C.,et al., High-pressure x-ray scattering 301
and computer simulation studies of density-induced polyamorphism in silicon.Phys. Rev. B 75, 224118 (2007) 302
[35] Eggert, J. H., Hicks, D. G., Celliers, P. M., Bradley, D. K., McWilliams, R. S.,et al., Melting temperature of diamond at 303
ultrahigh pressure.Nature. Phys.6, 40-43 (2010) 304
[36] Hahn, E. N., Zhao, S., Bringa, E. M. & Meyers, M. A., Supersonic dislocation bursts in silicon.Scientific Reports 6, 26977 305
(2016) 306
[37] Zhao, S., Kad, B., Hahn, E. N., Remington, B. A., Wehrenberg, C. E.,et al., Pressure and shear-induced amorphization 307
of silicon.Extreme Mechanics Letters 5, 74 (2015) 308
[38] Turneaure, S. J., Sinclair, N. & Gupta, Y. M., Real-time examination of atomistic mechanisms during shock-induced 309
structural transformation in silicon.Phys. Rev. Lett.117, 045502 (2016) 310
[39] Strickson, O. & Artacho, E., Ab initio calculation of the shock Hugoniot of bulk silicon.Phys. Rev. B 93, 094107 (2016) 311
[40] Dixit, S. N., Lawson, J. K., Manes, K. R. & Powell, H. T., Kinoform phase plates for focal plane irradiance profile control. 312
Optics Letters 19, 417-419 (1994) 313
III. METHODS
314
Experimental Configuration
315
Experiments were conducted at the Matter in Extreme Conditions (MEC) end station at the Linear Coherent Light
316
Source (LCLS) at SLAC National Accelerator Laboratory. Polycrystalline silicon samples were shock compressed via
317
irradiation with both arms of the nanosecond pulsed Nd:glass laser system. The incident laser light was frequency
318
doubled to 527 nm, and a 20 ns temporally square pulse was combined with phase plate optics producing a
spatially-319
smoothed 250µm spot size on target,[40] to achieve laser intensities on target in the range 2×10¹⁰
-2×10¹¹
W/cm2 .
320
Two experimental geometries were employed in this work: (1) A ‘collinear’ geometry (Supp. Info. Sec I), where the
321
X-ray beam is incident at 11◦ to the target normal, and thus along the direction of shock compression, and, (2) A 322
transverse geometry, whereby the laser beam, and hence direction of shock compression was perpendicular to the
323
X-ray direction (Fig. 1 (a)). In both configurations, the X-ray pulse length was approximately 80 fs, and the jitter
324
between the optical drive laser and the X-ray beam was no more than 20 ps[19].
325 326
(1) Collinear Configuration
327
In this configuration, velocimetry from the sample rear surface was recorded via optical velocimetry (VISAR)
328
simultaneous with X-ray diffraction. The X-ray wavelength was 1.3051(2) ˚A. The beam was focussed to 40µm, and
329
centred on the 250µm laser drive spot. In this configuration, X-rays were timed at 18 ns, 2 ns before the 20 ns laser
330
pulse was turned off. This was to probe the maximum amount of material during a pressure-supported shock wave,
331
before the falling edge of the laser pulse caused pressure to reduce. The rising edge of the pulse was measured to be 0.9
332
ns, and the falling edge was measured to be 2.1 ns. The same laser pulse shape was used in the transverse configuration.
333 334
(2) Transverse Configuration
335
The X-ray wavelength was 1.3007(5) ˚A and X-ray beam was focussed to 10µm, and placed a distance of 50µm into
336
the silicon sample i.e. 50µm from the ablator-silicon interface. This ensured that that the waves within the sample
337
had separated out sufficiently to discriminate each individual wave, yet was close enough to the origin of the shock
338
wave to ensure that wave reverberations and release from the target edges did not play a significant role. For the
339
lowest pressures reported here, the Si targets were ablated directly. The X-ray beam was then placed 50µm from the
340
drive surface. The phase plates were defocussed by 2 mm to a spot size of 380µm so that the entire target package is
341
shock-compressed, maximising the amount of material in the shocked state. However, to reach the highest pressures,
342
the 250µm spot at best focus was used. Images of the laser spot, and VISAR planarity shots are found in the Supp.
343
Info. Here, the position of the X-ray beam was placed at the same position – 50µm – and the timing of the X-rays
rel-344
ative to the drive laser was varied between 14 ns and 18 ns to capture the different multiple waves traversing the target.
Target Design
347 348
Where specified, the polyimide ablators had a 100 nm coating of aluminium on both the drive surface to prevent
349
tamped ablation. The polycrystalline silicon was quasi-single crystal in nature with grain sizes of order 100 µm.
350
Hence, it was significantly larger than the X-ray beam in both configurations.
351
In the collinear configuration, targets consisted of the polyimide ablator, bonded to polycrystalline silicon, 125µm
352
thick in the X-ray and shock direction. Perpendicular to the shock/X-ray direction, the samples were 3×3 mm squares,
353
significantly larger than the laser drive spot, hence limiting edge rarefaction effects at the silicon-vacuum interface.
354
In the transverse configuration, 125µm of polycrystalline silicon was sandwiched between two 100µm thick silicon
355
single crystals ([001] orientation), to provide good impedance matching and hence reduce complex wave interactions
356
between the silicon-vacuum interface at the target edge (perpendicular to the shock direction). The polyimide ablator
357
was bonded across all three layers of the target. Additional target information may be found in Supp. Info. Sec. II.
358
The transverse targets were characterised during laser-only beamtime with the VISAR diagnostic. Supp. Info. Fig.
359
10 a shows VISAR traces from the collinear and transverse configuration targets under identical laser conditions.
360
For a thickness of 100µm, there is no evidence of complex wave reverberations, and similar pressure conditions were
361
achieved with both targets, demonstrating that at a thickness of 50µm where we probed with the X-ray beam, one
362
would not expect reverberations to be significant. Similarly, Supp. Info. Fig. 10 b compares diffraction from the
363
collinear and transverse configurations, with no evidence of peak broadening, and hence pressure gradients, in the
364
sample.
365 366
Diffraction Analysis and Interpretation
367
In our assignment of the high-pressure phases observed we consider that the β-tin, Imma, and simple hexagonal
368
phases may all be described through a common orthorhombic cell, in which the β-tin and simple hexagonal phases
369
are special cases of theImma structure, wherea6=b 6=c. Here, we consider space group 74, with atoms occupying
370
the 4(e) Wykoff positions. Using the non-standard setting where the origin is shifted to (0, -1/4, -∆/2), one may
371
consider theβ-tin structure whena=b6=c, and ∆=0.25. Whena6=b6=c,b/c=√3, and ∆ = 0.50, one obtains the
372
simple hexagonal structure. For the intermediateImma phase,a6=b6=c, and the atomic co-ordinate ∆ has a value
373
intermediate between 0.25 and 0.50. TheImma phase becomes theβ-tin structure whena=b6=c. Whena6=b6=c,
374
b/c=√3, one obtains the simple hexagonal structure. For the intermediateImma phase,a6=b6=c. All diffraction
375
patterns discussed here were analysed both using the Le Bail method,[29] and through least-squares fitting to the
376
observedd-spacings.
377
Data AvailabilityThe data that support the plots within this paper and other findings of this study are available
378
from the corresponding author upon reasonable request