This is a repository copy of A compilation of data on the radiant emissivity of some materials at high temperatures.
White Rose Research Online URL for this paper: http://eprints.whiterose.ac.uk/133266/
Version: Accepted Version Article:
Jones, JM orcid.org/0000-0001-8687-9869, Mason, PE and Williams, A (2019) A compilation of data on the radiant emissivity of some materials at high temperatures. Journal of the Energy Institute, 92 (3). pp. 523-534. ISSN 1743-9671
https://doi.org/10.1016/j.joei.2018.04.006
© 2018 Energy Institute. Published by Elsevier Ltd. This is an author produced version of a paper published in Journal of the Energy Institute. Uploaded in accordance with the
publisher's self-archiving policy. This manuscript version is made available under the Creative Commons CC-BY-NC-ND 4.0 license
http://creativecommons.org/licenses/by-nc-nd/4.0/
[email protected] https://eprints.whiterose.ac.uk/
Reuse
This article is distributed under the terms of the Creative Commons Attribution-NonCommercial-NoDerivs (CC BY-NC-ND) licence. This licence only allows you to download this work and share it with others as long as you credit the authors, but you can’t change the article in any way or use it commercially. More
information and the full terms of the licence here: https://creativecommons.org/licenses/
Takedown
If you consider content in White Rose Research Online to be in breach of UK law, please notify us by
A COMPILATION OF DATA ON THE RADIANT EMISSIVITY OF SOME
MATERIALS AT HIGH TEMPERATURES
J.M Jones, P E Mason and A. Williams*
School of Chemical and Process Engineering, The University of Leeds
Leeds, LS2 9JT, UK
ABSTRACT
1
This paper gives a compilation of experimental data from a variety of sources of the emissivity of 2
materials used in high temperature applications. The data is given in the form of temperature dependent 3
correlation equations which can be used for modelling purposes. The data on refractory materials show 4
the importance of surface properties, the effect of surface coatings and ways in which these can be 5
taken into account for more accurate predictions of emissivity. Information is also given on chars, ash 6
particles and furnace deposits resulting from the combustion of coal and biomass. 7
Keywords: emissivity; metals; refractories; chars; ash deposits. 8
1. INTRODUCTION
10
Radiant heat transfer plays an important role in many engineering applications. An accurate knowledge 11
of the emissivity of all the surfaces at high temperatures in a furnace or processing unit is an essential 12
requirement. For all the materials involved the emissivity varies with temperature and spectrally. 13
However, in many modelling applications such as combustion plant, the complexity of the 14
computations may require an average value of total normal emissivity to be used, although the accuracy 15
is improved if the variation with temperature can be included. 16
Over the last 80 years, the need to have more accurate data on the emissivity of ceramic and metallic 17
solids has mainly been driven by their use for furnace applications in the metallurgical and glass 18
industries. Later developments resulted from the requirements of the space industry, and more recently 19
by CFD modelling of the combustion of coal and biomass by the power industries, for example [1-9]. 20
In these applications details are required of the variation of emissivity with temperature and the nature 21
of the surface. This paper is an updated version of an earlier review [6] for a number of materials of 22
particular interest for high temperature applications. 23
Whilst extensive compilations of thermal radiative data are available for metals and also non-metallic 24
solids, [7,8] this does not include certain engineering materials such as furnace linings and slags 25
produced as the result of combustion or gasification. The nature and optical properties of the surface 26
may change during use and this is especially the case with materials in high temperature furnaces or 27
fires where metals may become coated with oxide, and in the case where ash may melt or sinter to 28
form surface layers. This problem has been intensified because of the desire to increase the productivity 29
of furnace heating applications by the use of ceramic fibre furnaces linings or use of ‘high-emissivity’
30
coatings [9]. The advantages of lining furnaces with ceramic fibre materials are usually stated to be 31
that the low thermal mass of the fibre leads to a reduction in the quantity of heat required to bring the 32
furnace up to temperature and, consequently, to shorter heat up times. The relatively high resistance 33
to thermal shock means that the walls can be heated and cooled rapidly without damage, and the low 34
thermal conductivity of the fibre minimises heat loss through the furnace walls. However, when 35
ceramic fibres have been used to line furnaces whose main mode of operation is continuous heating, 36
the actual energy savings have sometimes been lower than expected. It has been suggested that this 37
results from the low emissivity of the ceramic fibres and that increased heat transfer to the stock can 38
be expected if they are coated with a layer of high emissivity refractory. The use of high emissivity 39
coatings, with or without ceramic fibres has been held to be appropriate because: (i) the high emissivity 40
refractory and prolong its life, and reduce air leakage. In the light of this continuing interest, there is a 42
need for accurate emissivity data for furnace modelling. 43
The world-wide use of pulverised coal firing for electricity generation, and more recently similar plants 44
using 100% biomass or co-firing with coal, has resulted in extensive modelling studies to improve 45
combustor performance. These combustion systems are complex in that they involve burning particles 46
of the fuel. Accounting for spectral variation in the emissivity of the particles and furnace surfaces 47
adds even more complexity, so for most modelling applications ‘averaged’ values of emissivity data
48
have to be employed [10, 11] or at specific wavelengths [12]. 49
Another important application arises from the wide use of radiation thermometers based on semi-50
conductor infra-red detectors, where the temperature deduced is a function of the assumed emissivity 51
of the surface. To infer accurate measurements, it follows that accurate emissivity data are required. 52
Many manufacturers of non-contact infrared measurement equipment give lists of emissivity data with 53
the cautionary statement that this data is to be used as a guide only, as the value changes dependent on 54
the actual surface and conditions. Such data are given at1.0, 1.6 and 8-14 µm.by, for example, by Fluke
55
Process Industries [13]. 56
2. THE DEFINITION OF SURFACE EMISSIVITY
57
The emissivity of a surface is defined as the ratio of the radiance from the surface to that from a black 58
body viewed under identical optical and geometrical conditions and at the same temperature. The total 59
black body radiation flux density, or emissive power at a known temperature, T, is obtained
60
from integration of the black body spectral flux, , over all the wavelengths:
61
(1)
This gives: 62
(2)
The total temperature dependent emissivity of a surface, , may be written in terms of the black
63
body emissive power and spectral flux density of the surface, , as:
64
Integration of over the spectral band limits will yield the spectral emissivity : 65
(4)
where j is the nominal wavelength position which defined by:
66
(5)
and is the black body band emissive power over the same wavelength range. The way in
67
which the emissivity is determined is dependent on the temperature and the spectral range. Thus in the 68
major study of total and spectral emissivity of pure metals and specific inorganic compound published 69
in ‘Thermophysical Properties of Matter’ [7,8], measurements are made over the range of 1-15 µm 70
with the calibrating black body covering the same spectral range. In later work, especially when 71
interest was concentrated on the spectral properties of coal ash, it was found to be more accurate to 72
ratio samples to grey body references, for example [14,15]. When a grey body radiator is used as the 73
reference, the measured sample emissivity is related to the true emissivity by a calibrating function. 74
The total normal emissivity, , is determined by weighting the spectral emissivity, , with the
75
Planck function, ,as in Eq. 6 below.
76
(6)
Since the spectral emissivity is weighted by the Planck function (Planck-weighted) the total normal 77
emissivity calculated in this way is slightly different to Eq. (4). This method of calculating the total 78
emissivity, for example as used in references [16-18], results in slightly different absolute values, 79
although both methods are used in the literature. Application of the Planck correction influences the 80
temperature dependency of the total normal emissivity. In the case of metals the effect is very small at 81
temperatures up to 1000 K, but at 2000 K it increases the emissivity by about 8 %. However Eq. 6 is 82
used when spectral emissivities are measured primarily for coal or biomass ash deposits or particles, 83
and for heavily oxidised metal surfaces. These inorganic species have a spectral region of low 84
emissivity at wavelengths up to 2 or 3 µm followed by a region of high emissivity at longer 85
wavelengths, which is usually strongly banded [19,20]. For fuel ashes the use of Eq.5 rather than Eq.4 86
In the analysis of radiative heat transfer, the definition of emissivity is often used ambiguously. The 88
emissivity of a surface or body is always defined as the ratio of the radiation emitted by the surface to 89
the maximum possible, that is, from a black body at the same temperature. However, since temperature, 90
wavelength and direction may all affect this ratio, they should all be included in a fully comprehensive 91
definition. Arising from this requirement, a number of individual definitions may be encountered in 92
the literature: (i) for radiation from a body at a particular temperature, the directional, monochromatic 93
emissivity relates to radiation at a defined wavelength and direction (usually expressed as an angle, ,
94
to the normal), (ii) if radiation over the whole range of thermal wavelengths but in a specific direction 95
is considered then the appropriate term is the total, directional emissivity, (iii) similarly, if all the 96
radiation emitted at a particular wavelength into the hemisphere beyond the surface is involved, the 97
appropriate definition is that of the monochromatic, hemispherical emissivity. 98
The value used in many analyses of radiative heat transfer in furnace enclosures is the simplest one. It 99
relates to radiation at all wavelengths and in all directions and is the total, hemispherical emissivity. It 100
is the value used to multiply T4 the Stefan-Boltzmann expression, and it is often referred to simply
101
as the emissivity. For real surfaces, the ratio of radiation emitted by the surface to that emitted by a 102
black body at the same temperature is often called the emittance, although the definition is exactly the 103
same as for emissivity for smooth surfaces. In this paper we usually use the term emissivity referring 104
to total normal emissivity rather than emittance, but the latter term is used for non-perfect surfaces 105
such as refractories. Thus depending on the source of information (as is the case in some of the figures 106
here) and since the terms are effectively interchangeable this is adopted here following the approach 107
in previous publications, for example in reference [1]. Indeed most industrial and research workers use 108
it. Some data for total hemispherical emissivity are included in some of the Tables because these values 109
are within about 5% of the total normal emissivity for most real materials as discussed later in the next 110
section. 111
3. EXPERIMENTAL VALUES OF EMISSIVITY
112
Typical values of emissivity for a tungsten filament[7,21] are shown in Fig 1 which illustrates the
113
variation of emissivity with both temperature and wavelength for a metal. The variation in wavelength 114
follows theory for a radiating metal surface. In addition to these factors the emissivity can change if 115
the surface is oxidised or if it is a rough surface. In fact many metals subject to high temperatures in a 116
furnace or fire situation oxidise so they are coated with a metal oxide; the exceptions are the noble 117
metals and to a certain extent some of the stainless steels. Not only does the emissivity change but the 118
have a high emissivity at low wavelengths which decrease with wavelength especially at lower 120
temperatures. As discussed earlier, many inorganic oxides behave in the opposite way especially fuel 121
ashes, eg [19,20]. 122
[image:8.595.54.293.145.319.2]123
Fig 1. Spectral emittance of tungsten. Based on [7, 14].
124
Non-conducting materials, such as ceramics, have more complex spectral behaviour which can be 125
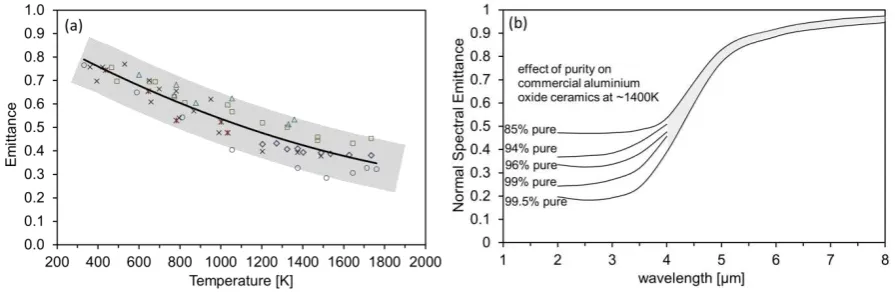
further complicated by surface roughness and purity effects. Fig 2 (a) shows the variation of the 126
emittance with temperature for a pure ceramic, aluminium oxide, and the typical experimental error 127
that can arise which in this case is about ± 0.1 [8]. The errors that arise can come from measurement 128
of the surface temperature which can have a large influence, but it also depends on whether the 129
emissivity has a strong variation with temperature. In the example in Fig 2 (a) this is not the case but 130
variation in surface finish and purity of the sample are important. Instrumental factors such as internal 131
reflectance have to be minimised. Fig 2 (b) shows the effect of the purity on the spectral emittance 132
from commercial aluminium oxide [8]. These plots clearly show the scatter that can arise. Different 133
surface finishes and different experimental methodology can have a major influence on reproducible 134
measurements from different laboratories. 135
The normal emittance curves given in Fig 2 (b) are typical for inorganic oxides, but also for fuel ashes 136
[20] where the composition of the ash can markedly vary from fuel to fuel. Another industrially 137
important example of where slight variations in composition can markedly impact on the spectral 138
emissivities is in the case of Ni and Fe-based boiler tubes in a high temperature oxidising 139
environments. It was found in laboratory experiments [22] that the emissivities of metals containing 140
more than 9 wt% of chromium have the typical behaviour of metals, this resulting from the resistance 141
to oxidation. This is not the case when the Cr content is below 2 wt% when the behaviour become that 142
144
Fig 2. (a) Normal total emittance of aluminium oxide as a function of temperature showing
145
experimental scatter, (b) the effect of purity on the normal spectral emittance of aluminium oxide at 146
~1400 K. Based on [8]. 147
Tables A1 to A3 given in the Appendix list the total normal emissivity, of a wide range of
148
materials as a function of temperature (in Kelvin). These are expressed as least squares polynomials 149
fitted to data from the references listed in the Tables by the expression: 150
(7)
where a, b, c, d are fitted coefficients. Omitted entries should be taken as zero. Extrapolation beyond 151
the quoted temperature range should be undertaken with caution especially for strongly non-linear 152
relationships where the c and d coefficients are non-zero. 153
Table A1 lists the emissivity of various pure metals, alloys and metals coated with oxides [7,23-32], 154
and in this Table many of the constants for the polynomial equation have been taken from Reference 155
[6]. 156
Figs 3 (a) and (b) show plots for selected materials used in high temperature applications, typically in
157
furnaces, or for temperature measurements. Fig 3 (a) shows some of these pure metals such as platinum 158
and others which may become coated with the oxide films, namely, iron/steel [23-26], molybdenum 159
[25], nickel [27], vanadium and tungsten [25] and titanium [28,29], as well as some alloys [30-32]. 160
Because the oxide film is semi-transparent to radiation the spectral radiation properties of oxidized 161
materials are related to the nature and thickness of the oxide film [32]. Fig 3 (b) gives information on 162
solid Fe2O3 which is markedly different to that as a film of oxide on metallic iron shown in Fig 3 (a).
163
Otsuka et al. [25] examined the emissivity of stainless steel and pure metallic molybdenum and 164
tungsten and with protective layers. The emissivity measured at oxidation temperatures of 500–1000oC
165
[image:9.595.55.503.72.218.2]hemispherical total emissivities than polished metals. Fu et al. [26] measured the total hemispherical 167
emissivity of iron-based alloys as well as pre-oxidized samples at temperatures of 400oC and 600oC
168
for several hours. Little happened at 400oC but the emissivities of samples oxidized at 600oC increased
169
significantly with oxidation time. Iuchi et al. [32] developed a spectral emissivity model for metal 170
oxide films, although its application is quite complex. 171
[image:10.595.59.499.190.336.2]172
Fig 3. Total emittance of (a) some metals and (b) some inorganic oxide and refractories.
173
Data for refractory materials and glasses are given in Table A2 [33-46]; again many of the polynomial 174
constants are taken from Reference [6]. Fig 3 (b) shows the complex variation with temperature for 175
refractory materials. The ultra-high temperature ceramics, which are often darker and consist of 176
conducting materials such as carbides, nitrides and borides, have high emissivities over the temperature 177
range. The light coloured aluminium, magnesium and titanium oxides have a high emissivity at low 178
temperatures but decreasing at furnace temperatures to about half their initial value. Zirconium and 179
thorium oxides which become electrically conducting at higher temperatures show a minimum at 180
furnace temperatures. 181
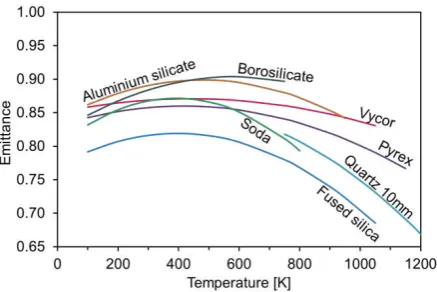
Fig 4 shows data for a number of glasses and which exhibit only small experimental variation and are
182
relatively well defined. The high silica containing glasses have the lower emissivities and the 183
185
Fig 4. Normal total emittance of some glasses as a function of temperature.
186
The differences in the values of the emissivities obtained for a range of refractory furnace lining 187
materials are highlighted in Fig. 5. This is because they are not only dependent on the material but also 188
on their physical characteristics [33-44]. Their properties depend on whether they are covered in 189
deposits such a slag in coal or oil fired furnaces, or sometimes in the case of oil flames with soot or 190
carbon. 191
192
Fig 5. Normal total emittance of refractory materials based on aluminium and silicon oxides: (a)
193
carborundum-based high emissivity coating [41]; (b) permeable ceramic materials [43]; (c) ceramic 194
fibres (normal, [40] and parallel, [40]); (d) silica bricks [43]; (e) Al2O3 mean line from Fig. 2; (f)
195
ceramic fibre board (44); (g) light-weight refractory [41]. 196
Table A3 lists data for surface coatings. These coatings usually consist of a thin layer of protective 197
refractory against the surrounding atmosphere which is usually oxidative. Here there is some overlap 198
with the data in Table A2 where high emissivity furnace coatings are listed. The purpose of these is to 199
increase the emissivity and also to offer some surface protection, but usually the surface layer is not 200
coherent and does not offer full oxidative protection. This topic is discussed more fully in Section 5. 201
Table A4 lists data for biomass, carbons, chars [46-60] and fuel ash deposits [62-67]. The combustion 202
[image:11.595.61.269.375.521.2]chamber or boiler has attracted considerable research on their radiant properties in order to improve 204
their efficiency or minimise pollution. Because the emissivity changes during the combustion process 205
these are set out here. In a pulverised fuel combustor the combustion of solid fuel particles, whether 206
coal or biomass, goes through the following steps: heating up of the fuel particle, devolatilisation, the 207
formation of char followed by the burn-out of the char leaving an ash [52,53]. The fuel, which initially 208
will have complex band spectra [54-56], rapidly undergoes devolatilisation within ~0.1s and forms a 209
carbonaceous char containing ash; then the char then burns out over a period of several seconds at 210
temperatures of about 1800 K finally leaving ash. Solomon at al. [54] investigated devolatilising coal 211
and the char formed finding a value for char of 0.7 at 1000K and that for devolatilising coal less than 212
that. Bhattacharya and Wall [56] found the emittance of coal particles increases, up to a value of about 213
0.83 at 1473K with increase in the extent of devolatilisation, incompletely devolatilised coal is non-214
grey, particularly up to 7 µm wavelength. 215
This transition from a char particle to mainly an ash particle is complex since as the ash becomes the 216
dominant species it may change phase. If the particle is above the ash fusion temperature it becomes a 217
liquid droplet but still containing some unreacted carbon which burns out forming a cenosphere may 218
in turn fragment. The behaviour can in principle be tracked in CFD models. The char will have the 219
grey body spectral behaviour of a carbon. The ash, consisting mainly of an alumino-silicate material 220
containing some calcium and/or iron, behaves like a refractory material following the typical behaviour 221
of the compounds shown in Fig. 5. Their emissivity is a function of the composition, particularly the 222
iron content [3,19,57]. The emissivity of these char/ash particles have been measured in flames as 223
well as at lower temperatures by a number of groups [10,19,55,56, 58-60] and the results are 224
summarised in Table A 4. The low emissivities at high temperature are confirmed by measurements 225
directly in flames [60-62]. 226
The emissivity of a burning coal or biomass char particle changes as it reacts to become an ash particle. 227
The change can be approximated by combining the values of, for example, biomass char and wood
228
ash given in Table A4 as follows: 229
(8)
where the emissivity of the char is assumed to be 0.85 and that of the ash taken to a temperature 230
dependent value from Table A4. Similar expressions can be derived using values for coal chars and
231
The temperature is all important here, because in most furnace applications, it determines the fuel 233
burn-out and hence emissivity, and also the ash deposition on the walls. Molten ash deposition on the 234
refractory walls or boiler tubes is important and data on the emissivity of slag covered walls is available 235
and a summary is given in Table A4. The emissivity varies with the chemical composition of the slag 236
and the iron and silica contents are important, as well as the physical nature of the surface, ie molten 237
or sintered ash and on particle size [3,17,19,64] or whether a phase change takes place [18,66]. The 238
influence of rough surfaces, whether due to dust layers or sintering, is discussed in Section 4. This 239
information is of considerable importance for the design of furnaces [3,15,64,67]. A correlation linking 240
the emissivity to the iron content has been derived [67] based on an earlier correlation by Konopeiko 241
in 1972 (see reference [67]). The thermal radiation from the combustion chamber results from the 242
complex interplay between the hot combustion gases, the furnace walls and any particulate matter 243
arising from the combustion process [1-3]. 244
The directional emissivity, , of a diffuse surface is independent of direction and this is often a
245
reasonable assumption for many real materials [1,5]. Nevertheless, all surfaces exhibit some departure 246
from diffuse behaviour and the general trends for the two special kinds of material discussed already, 247
non-conductors and conductors, may be summarised as follows. For conductors, is approximately
248
constant for < 40, increases up to about 80 and drops to zero at 90. For insulators, is roughly
249
constant for < 70 after which it drops sharply. The net result of these trends is that the hemispherical
250
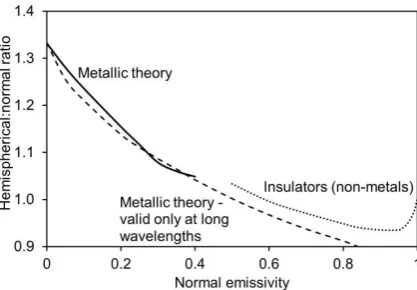
emissivity does not differ markedly from the normal emissivity [1], their ratio being 1.0 to 1.3 for 251
conductors and 0.95 to 1.0 for insulators as shown in Fig 6. 252
254
[image:14.595.59.268.103.248.2]255
Fig 6. Ratio of hemispherical to normal emissivity as a function of normal emissivity for metals and
256
non-metals. Based on [1]. 257
From this data and associated literature it may be observed that: 258
1. The emissivity of clean metallic surfaces is small, being as low as 0.02 for polished gold and
259
silver, although slowly increasing with temperature. 260
2. Oxidation of the metal surface markedly increases the emissivity, up to about 0.8 for heavily
261
oxidised stainless steel for example. 262
3. The emissivity of conductors increases with increase in temperature, that of insulators will
263
generally decrease. Some metal oxides become semi-conductors at high temperatures, and 264
these exhibit a U shaped emissivity curve. 265
4. The total emissivity of ceramics at high temperatures is generally around 0.6 but there is some
266
variation in the values depending on the composition. 267
5. The spectral emittance of most refractory materials is quite low (typically less than 0.6) at
268
wavelengths less than 5-6m so that at higher temperatures over around 1000K, the total
269
emissivity tend to be lower at around 0.4 to 0.3. 270
6. There is a correlation between the variation of emissivity with temperature and wavelength
271
because increasing the temperature of emission is accompanied by a decrease in the wavelength 272
of that radiation. 273
4. EMISSIVITIES OF ROUGH SURFACES SUCH AS REFRACTORIES
275
The surface roughness (r') can be expressed as the ratio of the root mean square depth of the cavities 276
(d) to the wavelength of radiation (r' = d/) [1]. Surface roughness can be placed in two categories
277
according to this criterion, bearing in mind that at very small values of r' the surface will be a smooth 278
specular reflector. 279
With relatively small cavities, the specular reflecting material is converted to a partially diffuse,
280
partially specular reflector. 281
Multiple reflections occur with surfaces possessing relatively deep cavities and the effective
282
emissivity is significantly larger than that of a smooth surface. 283
The first category has been treated by Porteus and Porteus [69], among others. A simple approach to 284
the second category is given by examining a single cavity as shown in Fig. 7. An imaginary plane of 285
area A2 is stretched across a cavity of area A1. The analysis[55] of radiative flux leaving A1 shows
286
that the cavity can be replaced by the plane area A2 with effective emissivity given by Eq.9.
287
(9)
where and refer to reflectivity and emissivity. For a groove of angle 60, for example, the
288
emissivity is increased by varying amounts, depending on the original emissivity, as shown in Table 289
1. Consequently, the apparent emissivity of a diffuse furnace wall can be enhanced by cutting grooves 290
in the surface. 291
292
Fig 7. Representation of a cavity by an imaginary plane surface.
293
294
295
296
Table 1. The effect of surface roughness on enhancing emissivity (groove angle 60). 298
Actual Emissivity Enhanced Apparent
Emissivity 0.1
0.2 0.3 0.4 0.5 0.6 0.7 0.8
0.18 0.33 0.46 0.57 0.67 0.75 0.82 0.89
299
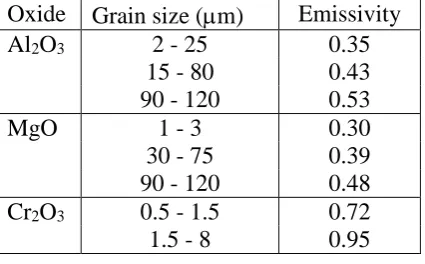
Certain materials which are granular or fibrous are inherently rough. The radiative properties of 300
granular metal oxide refractories and fibrous materials are determined not by the surface layer but by 301
scattering and adsorption by particles below the surface. The calculation of values of emissivity has 302
been made but it is not easy to predict values accurately for real materials. The effect of grain size and 303
material has been indicated by experimental measurements at 1200C as shown in Table 2 [1]. A
304
typical granular refractory brick with a grain size of 60 m would have grooves in the surface with an
305
angle of approximately 60 and an enhancement of emissivity as given by the values in Table 1. A
306
ceramic fibre board would also contain grooves of about 60, whilst some stack-bonded boards would
307
have a greater increase. Rough surfaces should lead to higher emissivities for a particular material. 308
This is particularly true for metals[71]. There is some evidence, from Fig.5, that it is also true when
309
comparing certain refractory materials, but it is difficult to isolate this effect from differences in 310
composition between these materials, even when these are small since minor variations in the amounts 311
of certain compounds can affect emissivity (cf Table A2). However, for the same material composition, 312
it has proved difficult to measure the effects of varying surface emissivity since, by nature, refractory 313
materials are diffuse emitters and reflectors[1,41] and this aspect is not very affected by surface
314
roughness in comparison to metals where the differences in surface behaviour can be greater between 315
polished and oxidised surfaces. 316
317
318
Table 2. Effect of Grain Size on the Emissivity of Selected Oxides measured at 1200ºC, taken from
320
[1]. 321
Oxide Grain size (m) Emissivity
Al2O3 2 - 25 0.35
15 - 80 0.43
90 - 120 0.53
MgO 1 - 3 0.30
30 - 75 0.39
90 - 120 0.48
Cr2O3 0.5 - 1.5 0.72
1.5 - 8 0.95
322
5. SURFACE COATINGS
323
The theory of optical surface coatings is well developed for optical components and for solar radiation 324
applications where surfaces are of a regular shape [5], In the case of non-uniform surfaces such as 325
furnace insulation materials the surface is less well defined. There are a number of applications where 326
surfaces are deliberately coated to increase surface emissivity or for surface protection [1,5]. An 327
important class of the application of surface coatings are those used to enhance surface emissivity in 328
industrial furnaces, and some examples are given in Table A3 and in Fig. 5. Generally, those coatings 329
contain iron or silicon carbide to enhance the emissivity and the effects are shown in the Table. It is 330
not surprising that these coatings also tend to be darker in appearance. However, these coatings are 331
only advantageous in certain furnace applications where the stock is only heated intermittently, for 332
instance in some continuous heating processes, rather than where there is steady state heating, in which 333
case the furnace wall emissivity is immaterial since the furnace behaves as a black body enclosure 334
[41,42, 68]. 335
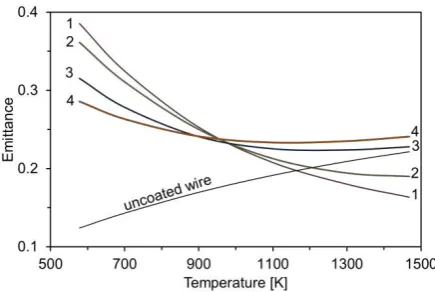
An important example of protection is the use of silica films to prevent catalytic reactions of platinum-336
based thermocouples in flames. The results of such computations for coated wire temperatures of 577, 337
977 and 1450C are shown in Fig. 8, where data for the total hemispherical emittance is given against
338
340
Fig 8. Variation of total hemispherical emittance with temperature for different thicknesses of coating
341
on a thermocouple. Assumed thermocouple diameter 12.7 m: coatings (1) 53.3 m; (2) 38.1 m; (3)
342
22.9 m; (4) 17.8 m. Based on [72].
343
At the lowest temperature there is a continuing rise of emissivity with coating thickness and this is 344
because an appreciable proportion of the radiant energy originates in the silica coating. At 345
temperatures of 977 and 1450C a different effect is observed. A very thin coating gives rise to an
346
increase in emissivity owing to emission from the silica. A further increase in thickness eventually 347
leads to a decreasing emittance owing to the decreasing amount of radiation from the unit area of the 348
outside surface which has originated at the core. This decrease is not compensated by an increased 349
emission from the silica for at higher temperatures black-body emission resides increasingly in the 350
lower wavelength region where the silica is almost transparent. Fig. 8 shows the variation of emissivity 351
with temperature for the different thicknesses of coating. At the lower temperatures the coating 352
produces a marked increase in emittance, but as the temperature increases this effect is reduced. 353
354
CONCLUSIONS
355
The effect of temperature on the emissivity of various materials used in high temperature applications 356
has been compiled. The data shows that the total normal emissivities of the more commonly used 357
materials in furnace construction are typically in the range 0.4 to 0.8. However there can be 358
considerable uncertainty particularly in materials used in engineering applications due to a lack of 359
knowledge of the accurate surface temperature, and the exact physical or chemical surface properties. 360
A considerable body of information is available relating to the combustion of coal and biomass fuels 361
especially particulate fuels. The behaviour of particulate char is complex as it burns out to form an ash 362
ACKNOWLEDGEMENTS
364
The authors are grateful to Dr Edward Hampartoumian, Mr Douglas Hainsworth and Mr John M. 365
Taylor for their work for the original version of this paper. We thank Dr Albino Reis for help in 366
accessing information. We are also grateful to the Reviewers for their helpful comments. 367
REFERENCES
368
[1]. H.C. Hottel, and A.E. Sarofim, Radiative heat transfer, McGraw Hill, New York, 1967.
369
[2]. R. Viskanta, M.P. Mengoc, Radiation heat transfer in combustion systems, Prog. Energy
370
Combust. Sci. 13 (1987) 97-160. 371
[3]. T.F. Wall, A. Lowe, L.J. Wibberly, I. McC. Stewart, Mineral matter in coal and the thermal
372
performance of large boilers, Prog. Energy Cornbust. Sci. 5, (1979) 1-29. 373
[4]. F P Incropera, D.P. DeWitt, T.L. Bergman, A.S. Lavine, Introduction to Heat Transfer.
374
John Wiley 2007 6th edition 375
[5]. M.F. Modest, Radiative Heat Transfer, 3rd Edition 2013 Elsevier Oxford
376
[6]. E. Hampartsoumian, D. Hainsworth, J.M. Taylor, A. Williams, The radiant emissivity of
377
some materials at high temperatures-review, J. Inst. Energy 74 (2001) 91-99. 378
[7]. Y.S. Touloukian, D.P. DeWitt, Thermal radiative properties: Metallic elements and alloys,
379
1970, Vol. 7; in Thermophysical Properties of Matter, TPRC Data Series (edited by Y.S 380
Touloukian, C.Y. Ho) IFI/Plenum Press, New York. 381
[8]. Y.S Touloukian, D.P. DeWitt, Thermal radiative properties. Non-metallic solids, 1971,
382
Vol. 8; in Thermophysical Properties of Matter, TPRC Data Series (edited by Y.S. 383
Touloukian, C.Y. Ho) IFI/Plenum Press, New York. 384
[9]. D.G.Elliston, W.A. Gray, D.F. Hibberd, T-Y Ho, A. Williams, The effect of surface
385
emissivity on furnace performance, J. Inst. Energy (1987) 155-167. 386
[10]. S. Rego-Barcena, R. Saari, R. Mani, S. El-Batroukh, M.J. Thomson, Real time,
non-387
intrusive measurement of particle emissivity and gas temperature in coal-fired power
388
plants, Meas. Sci. Technol. 18 (2007) 3479–3488.
389
[11]. L. Ma, M. Gharebaghi, R. Porter, M. Pourkashanian, J.M. Jones, A. Williams. Modelling
390
methods for co-fired fuel furnaces, Fuel, 88, 2448-2454, 2009. 391
[12]. G. Krishnamoorthy, C. Wolf, Assessing the role of particles in radiative heat transfer during
392
[13]. Fluke Process Industries,
www.flukeprocessinstruments.com/en-us/about-us/infrared-394
technology
395
[14]. A.M. Vassallo, P.A. Cole-Clarke, L. S. K. Pang, A.J. Palmisano, Infrared emission
396
spectroscopy of coal minerals and their thermal transformations, Appl Spectrosc., 1992, 46 397
(1) 73-78. 398
[15]. C.J. Zygarlicke, D.P. McCollor, C.R. Crocker, Task 3.2 – Ash Emissivity Characterization
399
and Prediction, December 1999. U.S. Department of Energy – NETL; Report No.
99-400
EERC-12-05. 401
[16]. S. Bohnes, V. Scherer, S. Linka, M. Neuroth, H. Bruggemann, Spectral emissivity
402
measurements of single mineral phases and ash deposits, Proc. 2005 Summer Heat Transfer 403
Conference, July 17-22 San Francisco, Calif, USA HT2005-72099. pp 175–182.
404
[17]. F. Greffrath, J. Gorewoda, M. Schiemann, V. Scherer, Influence of chemical composition
405
and physical structure on normal radiant emittance characteristics of ash deposits, Fuel 134 406
(2014) 307–314.
407
[18]. J. Gorewoda, V. Scherer, Normal radiative emittance of coal ash sulfates in the context of
408
oxyfuel combustion, Energy Fuels 31 (2017) 4400−4406.
409
[19]. T.F. Wall, H.B. Becker, Total absorptivities and emissivities of particulate coal ash from
410
spectral band emissivity measurements, J Eng Gas Turbines Power, 106 (1984) 771-776. 411
[20]. T.F. Wall, S.P. Bhattacharya, D.K.Zhang, R.P. Gupta, X. He, The properties and thermal
412
effects of ash deposits in coal-fired furnaces, Prog. Energy Combust. Sci. 19 (1993) 487-413
504. 414
[21]. Handbook of Chemistry and Physics (60th Edition), CRC Press, Boca Raton, Florida, 1981.
415
[22]. M. Shimogori, F. Greffrath, V. Scherer, A. Gwosdz, C. Bergins, Spectral emissivities of Ni
416
and Fe based boiler tube materials with varying chromium content at high temperature 417
atmospheres, 27th Annual International Pittsburgh Coal Conference 2010, Istanbul, 418
Turkey, October 2010, 1940-1954. 419
[23]. P. Ratanapupech, R.G. Bautista, Normal spectral emissivities of liquid iron, liquid nickel
420
and liquid iron-nickel alloys, High Temp. Sci., 1981, 14(4) 269-283. 421
[24]. M. Susa, R.K. Endo, Emissivities of High Temperature Metallic Melts, Advances in
422
Materials Research Book Series ( volume 11) 423
[25]. A. Otsuka, K. Hosono, R. Tanaka, K. Kitagawa, N. Arai, A survey of hemispherical total
424
[26]. T. Fu, P. Tan, M. Zhong, Experimental research on the influence of surface conditions on 426
the total hemispherical emissivity of iron-based alloys, Exp. Therm. Fluid Sci., 40 (2012) 427
159–167
428
[27]. T.R. Fu, P. Tan, J. Ren, H.S. Wang, Total hemispherical radiation properties of oxidised
429
nickel at high temperatures, Corros. Sci. 83 (2014) 272-280. 430
[28]. G. Teodorescu Radiative Emissivity of Metals and Oxidised Metals at High Temperature,
431
PhD Thesis Auburn University, 2007 432
[29]. G. Teodorescu, P.D. Jones, R.A. Overfelt, B. Guo, High temperature emissivity of high
433
purity titanium and zirconium. 16th Symposium on Thermophysical Properties Boulder 434
(2006) 435
[30]. B.P. Keller, S.E. Nelson, K.L. Walton, T. K. Ghosh, R.V. Tompson, S. K. Loyalka, Total
436
hemispherical emissivity of Inconel 718, Nuc. Eng. Des. 287 (2015) 11 18
437
[31]. P. Hagqvist, F. Sikström, Anna-Karin Christiansson, Emissivity estimation for high
438
temperature radiation pyrometry on Ti–6Al–4V, Measurement 46 (2013) 871–880.
439
[32]. T. Iuchi, T. Furukawa, S. Wada, Emissivity modeling of metals during the growth of oxide
440
film and comparison of the model with experimental results, Appl. Opt. 42 (2003) 2317–
441
2326. 442
[33]. P.D. Osborn, Handbook of Energy Data and Calculations. Butterworth, London, 1985.
443
[34]. J.D. Jackson, E. Romero, J.J. Norris, Comparison of Techniques for the measurement of
444
the emittance of ceramic materials. Ceramics in Energy Application, The Institute of 445
Energy, London (1994) 133-148. 446
[35]. V.A. Petrov, V.Yu Reznik, Measurement of the emissivity of quartz glass, High
Temp-447
High Press 4 (1972) 687-693. 448
[36]. J.A. Wieringa, J.J.Ph. Elich, C.J. Hoogendoorn, The spectral emissivity of glass furnace
449
roofs and the effect on heat transfer, Ceramics in Energy Applications Conference, 450
Sheffield, IOP Publishing Ltd. (1990) 159-168. 451
[37]. A. Williams, E. Hampartsoumian, B. Simmons. Unpublished data, 1988.
452
[38]. L. Mercatelli, E. Sani, D. Jafrancesco, P. Sansoni, D. Fontani, M. Meucci, S. Coraggia, L.
453
Marconi, J.-L. Sans, E. Beche, L. Silvestroni D. Sciti, Ultra-refractory diboride ceramics 454
for solar plant receivers, Energy Procedia 49 ( 2014 ) 468 – 477.
455
[39]. Zhang, J. Dai, X. Lu, Y. Wu, Effects of temperature on the spectral emissivity of C/SiC
456
[40]. J.D. Fletcher, A. Williams, Emissivities of ceramic fibre linings for high-temperature 458
furnaces. J. Inst.Energy (1984) 377. 459
[41]. E. Hampartsoumian, Spectral emittance measurements of furnace wall materials and
460
coatings. Ceramics in Energy Applications Conference, Sheffield, IOP Publishing Ltd, 461
(1990) 149-157. 462
[42]. I. Alexander, W.A. Gray, E. Hampartsoumian, J.M. Taylor, Surface emissivities of furnace
463
linings and their effect on heat transfer in an enclosure, 1st European Conference on 464
Industrial Furnaces and Boilers, (1988) Lisbon, 59-68. 465
[43]. J.D. Jackson, C-C Yen, Measurements of total and spectral emissivities of some ceramic
466
fibre insulation materials. Ceramics in Energy Applications, The Institute of Energy, 467
London, 1994,159. 468
[44]. J.D. Jackson, P. An, I. Pena-Marco, Measurements of the total and spectral emittance of
469
permeable ceramic materials. Proc. 4th UK National Heat Transfer Conference, C510/132,
470
I. Mech. E. (1995) 561-565. 471
[45]. J.A, Wieringa, Spectral radiative heat transfer in gas-fired furnaces. PhD Dissertation,
472
Technishe Universiteit Delft, (1992). 473
[46]. G. Fisher, Ceramic coatings enhance performance engineering, Ceramic Bull., 65 (1986)
474
283-287. 475
[47]. G. Neuer, G. Jaroma-Weiland, Spectral and total emissivity of high temperature materials,
476
Int. J. Thermophys, 19 (1998) 917-929. 477
[48]. G. Lopez, L.A. Basterra, L. Acuna, M. Casado, Determination of the emissivity of wood
478
for inspection by infra-red, J. Nondestruct. Eval. 32 (2013) 172-176. 479
[49]. T. Matsumoto, T. Koizumi, Y. Kawakami, K. Okamoto, M. Tomita, Perfect blackbody
480
radiation from a graphene nanostructure with application to high temperature spectral 481
emissivity measurements, Opt. Express 21 (2013) 30964-30974. 482
[50]. D.D. Evans, H.W. Emmons, Combustion of wood charcoal, Fire Research 1 (1977) 57-66.
483
[51]. J. Saliero, A. Gomez-Barea, M. Tripiana, B. Leckner, Measurement of char surface
484
temperature in a fluidized bed combustor using pyrometry with digital camera, Chem. Eng 485
J. 288 (2016) 441-450. 486
[52]. R.I. Backreedy, L.M. Fletcher, L. Ma, M. Pourkashanian, A. Williams, Modelling
487
pulverised coal combustion using a detailed coal combustion model, Combust. Sci. 488
Technol. 178 (2006) 763-787. 489
[53]. L. Ma, J.M. Jones, M. Pourkashanian, A. Williams, Modelling the combustion of
490
[54]. P.R. Solomon, R.M. Carangelo, P.E. Best, J.R. Markham, D.G. Hamblen, The spectral 492
emittance of pulverized coal and char, Proc. Combust. Symp. 21 (1986) 437–446.
493
[55]. L.L. Baxter, T.H. Fletcher, D.K. Ottesen, Spectral emittance measurements of coal
494
particles, Energy Fuels 2 (1988) 423–30.
495
[56]. S.P. Bhattacharya, T.F. Wall, Development of emittance of coal particles during
496
devolatilisation and burnoff, Fuel 78 (1999) 511–519.
497
[57]. J. Boow, P.R.C. Goard, Fireside deposits and their effect on heat transfer in a
pulverized-498
fuel-fired boiler: Part lll. The Influence of the physical charcteristics of the deposit on its 499
radiant emittance and effective thermal conductrance. J Inst Fuel 42 (1969) 412–419.
500
[58]. P.R. Solomon, R.M. Carangelo, P.E. Best, J.R. Markham, D.G. Hamblen, The spectral
501
emittance of pulverized coal and char, Proc. Combust. Inst. 21 (1986) 437-446. 502
[59]. P. Graeser, M. Schiemann Char particle emissivity of two coal chars in oxy-fuel
503
atmospheres, Fuel 183 (2016) 405–413.
504
[60]. P. Graeser, M. Schiemann Emissivity of burning bituminous coal char particles-burnout
505
effects Fuel 196 (2017) 336-343. 506
[61]. D. Backstrom, R. Johansson, K.J. Andersson, F. Johnsson, S. Clausen, A. Fateev,
507
Measurement and Modeling of particle radiation in coal flames, Energy Fuels, 28(3) (2014) 508
2199-2210. 509
[62]. S. Yipeng, L. Chun, Z. Huaichun, A simple judgment method of gray property of flames
510
based on spectral analysis and the two-color method for measurements of temperatures and 511
emissivity, Proc. Combust. Inst. 33 (2011) 735–741.
512
[63]. J.R. Markham, P.E. Best, P.R. Solomon, Z.Z. Yu. Measurement of radiative properties of
513
ash and Slag by FT-IR emission and reflection spectroscopy. Trans. ASME 114 (1992) 514
458–464
515
[64]. A. Zbogar, F.J. Frandsen, P.A. Jensen, P. Glarborg, Heat transfer in ash deposits: A
516
modelling tool-box. Prog Energy Combust Sci. 31 (2005) 371–421.
517
[65]. F. Greffrath, J. Gorewoda,M. Schiemann, V. Scherer, Influence of chemical composition
518
and physical structure on normal radiant emittance characteristics of ash deposits. Fuel 519
2014;134:307–14.
520
[66]. J. Gorewoda,V. Scherer,. Influence of carbonate decomposition on normal spectral
521
radiative emittance in the context of oxyfuel combustion, Energy Fuels 30 (2016) 9752–
522
9760. 523
[67]. M. Shimogori, H. Yoshizako, Y. Matsumura, Determination of coal ash emissivity using
524
simplified equation for thermal design of coal-fired boilers, Fuel 95 (2012) 241–246.
[68]. Y.U. Khan, D.A. Lawson, R.J. Tucker, Analysis of radiative heat transfer in ceramic-lined 526
and ceramic-coated furnaces, J. Inst.Energy 71 (1998) 21-27. 527
[69]. H.E Bennet, J.D. Porteus, Relation between surface roughness and specular reflectance at
528
normal incidence, J. Opt. Soc. Am. 51 (1961) 123-129. 529
[70]. W.A. Gray, R. Müller, Engineering Calculations in Radiant Heat Transfer, Pergamon Press,
530
Oxford, 1974. 531
[71]. D.P. De Witt, R.S. Bernicz, Temperature, It's Measurement and Control in Science and
532
Industry, 4, 1 Reinhold Publishing, 1972. 533
[72]. D Bradley, A.G. Entwistle, The total hemispherical emittance of coated wires, Brit. J. Appl.
534
Phys. 17 (1966) 1155-1164. 535
APPENDIX
[image:25.595.58.534.125.608.2]537
TABLE A1 538
Metals a b c temp
range K ref range
Aluminium polished 0.0263 5.01 300 - 900 7 0.04-0.07
oxidised 0.0463 5.01 450 - 900 7 0.07-0.09
lightly oxidised 0.011 21 473 - 873 7 0.11-0.19
Brass polished 0.03 550 1 0.03
unoxidised 0.035 295 1 0.04
oxidised @ 599°C 0.6 573 - 873 1 0.6
Copper polished 0.021 1.98 300 - 1200 7 0.03-0.05
oxidised, red heat 30 min 0.06 15.4 400 - 1050 7 0.12-0.22
oxidised at 1000 K 80 600 - 1000 7 0.48-0.8
thick oxide 0.72 20 400 - 1000 7 0.8-0.92
Gold 0.0432 -8.88 7.15 600 - 1000 7 0.02-0.026
Iron/steel polished 18.2 100 - 1050 7 0.24-0.61
iron oxide, red heat 30 min 0.173 68.6 -25.6 100 - 1050 7 0.24-0.61
molten 0.35 1810 - 1860 23 0.35
heavily oxidised 0.72 20 400 - 1000 7 0.8-0.92
Stainless steels N-155, oxidation retarded 0.0144 17 100 - 1500 7 0.031-0.27
N-155, lightly oxidised -0.0372 27.8 450 - 1300 7 0.09-0.32
oxidised at high temp. 0.42 30 600 - 1400 7 0.60-0.84
heavily oxidised 0.72 20 400 - 1000 7 0.8-0.92
Molybdenum polished 0.0288 12.7 100 - 1800 7 0.04-0.26
oxidised 0.82 600 - 800 7 0.82
Nickel polished 0.014 12.9 100 - 1500 7 0.03-0.21
oxidised 60 400 - 1000 7 0.24-0.6
unoxidised 0.01 13.3 723-1123 27 0.1-0.16
Ni oxidised to various degrees { 0.266 0.4 17.8 24 723-1123 723-1123 27 27 0.43-0.5 0.5-0.6
Nichrome clean 0.65 323 21 0.65
oxidised 0.71 16 773 - 1273 21 0.83-0.91
Palladium polished -0.03 11.7 400 - 1550 7 0.03-0.16
Platinum polished 0.008 10.8 100 - 1500 7 0.02-0.17
Silver electrolytic 0.0119 1.9 400 - 1200 7 0.02-0.035
Titanium 0.913 -96.9 36.5 1373-1673 28,29 0.27-0.31
lightly oxidised 0.2 61 673 - 1023 7 0.6-00.82
Tin polished 0.0085 10.8 300 - 500 7 0.041-0.06
Tungsten polished -0.003 10.5 273-2500 7 0.03-0.26
Zinc polished -0.01 10 500 - 600 1 0.04-0.05
oxidised at 400oC 0.11 673 1 0.11
Inconel-718 0.11 13.2 760-1275 30 0.21-0.28
Ti–6Al–4V 0.165 31.5 -15.5 773-1323 31 0.3-0.33
TABLE A2 540
Non-metals a b c d temp
range K ref range
Alumina 0.98 -53 10.2 300 -- 1800 8 0.83-0.35
Fire brick low Al2O3 content 0.9 -10 673 - 1673 33 0.83-0.73
(Al/Si/Fe/O) medium Al2O3 content 0.84 -20 673 - 1673 33 0.71-0.51
high Al2O3 content 0.8 -20 673 -1673 33 0.64-0.39
Fired-Clay: 63.2% Al2O3, 32.1 SiO2 0.74 133 -268 11.8 300 - 1300 34 0.90-0.55
Glasses Vycor (Corning 7900) 0.85 9.5 -10.8 70 - 1050 8 0.87-0.85
Aluminium silicate 0.84 24.6 -25.7 70 - 950 8 0.89-0.83
Pyrex (Corning 7740) 0.83 14.4 -17.3 70 - 1150 8 0.86-0.8
Borosilicate 0.82 28.7 -24.6 70 - 750 8 0.88-0.86
Soda 0.8 36.6 -46.8 70 - 800 8 0.86-0.68
Fused silica 0.77 24.8 -31.3 70 - 1050 8 0.75-0.71
Quartz, 2 mm thick 0.61 25.8 -31.4 750 - 1200 35 0.65-0.41
Quartz 10 mm thick 0.82 20.7 -27.6 750 - 1200 35 0.84-0.62
Molten glass 0.8 1773 36 0.8
Iron oxide (Fe2O3) -0.01 161 -75 850 - 1300 8 0.75-0.85
Magnesium oxide (MgO) 0.73 11.8 -65 2.48 500 - 2350 8 0.73-0.3
Silicon carbide (SiC) 0.8 15.4 -9.01 400 - 1850 8 0.85-0.78
polished 0.99 298 - 373 37 0.99
oxidised (1h, 1367 K) 0.7 -25 800 - 1600 0.5-0.3
Silicon nitride (Si3N4) 0.86 13.9 -16.3 600 - 1250 8 0.89-0.78
polished 0.98 298 - 373 37 0.98
Thorium dioxide (ThO2) 1.93 -224.1 74.7 1200 - 2250 8 0.32-0.67
Titanium dioxide (TiO2) 0.68 -21.2 850 - 1300 8 0.49-0.4
polished 0.95 298 - 373 37 0.96-0.95
Zirconia (ZrO2) 0.82 6.67 -86.8 4.18 50 - 1600 8 0.82-0.42
Zirconia/MgO (1:1) 0.9 -37 700 - 1700 3 0.64-0.27
polished 0.94 293 - 373 37 0.95-0.92
Zirconium carbide 0.98 -13.9 1200 - 2400 8 0.82-0.66
Zirconium dibromide (ZrB2) 0.14 19 1100-1625 38 0.35-0.45
Hafnium dibromide (HfB2) 0.14 19 1100-1625 38 0.35-0.45
TaB67-ceramics 0.54 10 1100-1625 38 0.65-0.7
C/SiC composites 0.727 15.5 -8.55 1000-2000 39 0.8-0.7
Ceramic fibre Board 45wt% Al2O3,
55wt% SiO2,
0.05wt% Fe2O3
fibres normal to surface 1.27 -48.5 2.84 600 - 1400 40 0.94 - 0.65
parallel bonded fibres 1.47 -91.1 14.4 600 - 1400 40 0.9-0.48
Zirconia coated fibre 1.26 -26.7 1000 - 1300 9 0.99-0.91
Ceramic Fibres
Kaowool 45wt% Al2O3,55wt% SiO2 2.39 -165 923 - 1173 41 0.87-0.40
Zicar 99wt% ZrO2 0.51 1080 41 0.51
Saffil 95wt% Al2O3, 5wt% SiO2 0.49 1010 41 0.49
Microtherm 65wt% SiO2, 3.2wt% TiO2 0.48 950 41 0.48
TABLE A2 (continued) 542
Refractories a b temp
range K ref range Lightweight Refractories
PK 110 20wt% Al2O3, 53wt% SiO2,
4wt% Fe2O3, 16wt% MgO
0.43 14.4 1073-1350 41 0.58-0.62
MPK 125 36wt% Al2O3, 46wt% SiO2, 15wt% CaO 0.53 8 1063-1350 41 0.54-0.64
MPK 140 41wt% Al2O3, 54wt% SiO2 0.21 25.3 1073-1350 41 0.48-0.55
MPK 155HA 61wt% Al2O3, 36wt% SiO2 0.75 -27.9 1063-1350 41 0.44-0.36
MPK 130HSR 36wt% Al2O3, 54wt% SiO2 0.61 1073-1250 41 0.60-0.62
MPK SUPRA 11wt% Al2O3, 75wt% SiO2, 6wt% Fe2O3 -0.16 74 1073-1300 41 0.64-0.81
Refractory Brick
alumina/silica : 330 kg/m3. 45wt% Al2O3, 55% SiO2 33
alumina/silica : 260 kg/m3. 45wt% Al2O3, 55% SiO2 33
alumina/silica : 240 kg/m3. 50wt% Al2O3, 50% SiO2 33
alumina/silica : 210 kg/m3. 50wt% Al2O3, 50% SiO2 33
alumina/silica : 200 kg/m3. 70wt% Al2O3, 26% SiO2 33
alumina/silica : 130 kg/m3. 45wt% Al2O3, 53% SiO2 33 see
alumina/silica : 100 kg/m3. 45wt% Al2O3, 55% SiO2 33 Fig 5
alumina/silica : 100 kg/m3. 100% SiO2 33
alumina/silica : 80 kg/m3. 100% SiO2 33
silica brick 97wt% SiO2, 2.6wt% CaO 35
silica brick, used (as above) 97wt% SiO2, 2.6wt% CaO 35
Zirconia silicate 32wt% SiO2, 63wt% ZrO 35
Furnace Refractory porous 1.2 pores/mm 1.17 -50.6 750-1050 44 0.8-0.65
80-90% Al2O3, 5-9%, SiO2 0.8 pores/mm 1.13 -37.6 650-1050 44 0.88-0.74
0.4 pores/mm 1.09 -29.8 850-1650 44 0.6-0.82
[image:27.595.57.561.87.433.2]TABLE A3 544
Coatings a b c temp range K ref range
High Emissivity Furnace Coatings
Carbide coating (bonded to refractory bricks) 0.97 273 - 1273 46 0.99-0.95
CaO stabilised Zr/Fe/Cr oxides 0.98 1273 46 0.98
Zirconia, unstabilised 0.98 813 - 1373 46 0.98
Carbonundum powder-based 1.56 -60 1023 - 1273 41 0.95-0.8
SiO2 based 0.83 950 - 1373 41 0.84-0.81
ZrO2 based 0.6 1073 - 1350 41 0.55-0.64
Furnace Wall Protective Coating
NOVIT 62wt% ZrO2, 32wt% SiO2 1 -40 1073 - 1373 41 0.56-0.44
X-ray anode coatings
STZ 1.06 260 87.9 47 0.66-0.86
Oxidation Protective Coatings for Reusable Space Vehicles
Polysilazine (Si-C-N) + Si 0.82 1100-1700 47 0.82
Polysilazine (Si-C-N) + SiC 0.75 1100-1700 47 0.75
545
TABLE A4 546
Solid fuels a b temp range K ref range
Carbon Carbon, rough 0.81 300 - 2100 8 0.81
Graphite, polished 0.81 2.2 0 3000 8 0.81-0.88
Graphene Up to 2500 49 0.99
Candle soot 0.95 373-500 1 0.95
Lampblack 0.96 323 - 1273 1 0.96
Biomass Particles
Wood 0.9 295-337 48 0.92-0.86
Biomass charcoal (large surface) 0.85 1328 50 0.85
Beech wood char (in fluid bed combustor) 0.85 898-1223 51 0.85
Biomass char 0.85 1500 0.85
Coal Particles
Devolatilising coal particle 0.6 56 0.6
Coal particle char (0.9% ash) 0.8 400 - 900 1 0.81 - 0.79
Coal particle char 1473 56 0.83
Coal fly ash 500 - 1500
55,56,58-61 0.8-0.3
Ash Particles See text
Coal ash glassy 1 -40 500 - 1500 19 0.8-0.4
(deposited on furnace
surfaces) sintered 0.9 -30 500 - 1500 19 0.75-0.45
powder, 120 µm dia. 0.85 -30 500 - 1500 19 0.7-0.4
powder, 33 µm dia. 0.75 -30 500 - 1500 19 0.6-0.3
powder, 6.5 µm dia. 0.65 -30 500 - 1500 19 0.5-0.2
Wood ash alkali-aluminosilicates 0.95 -30 500 - 1500 estimated 0.8-0.4
[image:28.595.58.527.328.638.2]![Fig 1. Spectral emittance of tungsten. Based on [7, 14].](https://thumb-us.123doks.com/thumbv2/123dok_us/1861247.142991/8.595.54.293.145.319/fig-spectral-emittance-tungsten-based.webp)