Int. J. Electrochem. Sci., 7 (2012) 8408 - 8419
International Journal of
ELECTROCHEMICAL
SCIENCE
www.electrochemsci.orgElectrochemical Stability of Cu, Ni, Co, Pt and Ir Metals Sheet
and Their Composite Electrodes in Potassium Hydroxide
Solution
Mohamed Rozali Othman1,*, Riyanto2
1
Environmental Electrochemistry & Electrosynthesis Laboratory (Room L102),
School of Chemical Sciences and Food Technology, Faculty of Science and Technology, Universiti Kebangsaan Malaysia, 43600 UKM, Bangi, Selangor Darul Ehsan, Malaysia.
2
Universitas Islam Indonesia, Yogyakarta, Indonesia.
*
E-mail: [email protected];[email protected]
Received: 4 July 2012 / Accepted: 30 July 2012 / Published: 1 September 2012
Electrochemical stability of Cu, Ni, Co, Pt, Ir metals sheet and their respective composite electrodes in potassium hydroxide (KOH) solution has been studied using cyclic voltammetry technique. The stability of those electrodes was quantified using Atomic Absorption Spectroscopy (AAS). The metal sheet electrodes were homely prepared in square cut of 1 cm by length and wide respectively. The powder composite electrodes were prepared by mixing together 95:5 (w/w) of the respective metals powder with polyvinyl chloride (PVC) using mechanical alloying technique. The result of the study showed that all metals sheet and their composite electrode except Cu were stable in a KOH solution. To study their stability further, those electrodes was then used in the electrooxidation process of ethanol in KOH solution, and their stability were quantitatively determined based on the analysis of the electrolysis solution using AAS. Base on the current density produced during the electrooxidation process, composite electrode was found to be more sensitive compared to metal sheet electrode.
Keywords: Electrochemical stability, metal sheet, composite electrode, KOH
1. INTRODUCTION
electrosynthetic processes will be in the production of fine and specialist chemicals. Hence, in most cases, the target for an electrosynthesis process is now most likely to be a product required on any scale from 1 to 10.000 tons per year [1]. Electrochemistry provides a very interesting and versatile means for the selective reduction or oxidation of organic compounds [2].
Electrode in electrosynthesis is truly fundamental. Some general guidelines to assit the choice of an electrode material are physical stability, chemical stability, suitable physical form, rate and product selectivity, electrical conductivity and cost particularly lifetime [1]. The need for a suitable combination of mechanical, physical, and chemical stability has already been stressed. It is important to recognize that the stability must be maintained under all conditions met by the electrode material. Other than chemical and electrochemical stability, electrode chosen for industrial use to be relatively inexpensive, highly conducting and good electrocatalytic. An electrocatalytic electrode is one which exhibits a low overvoltage for a given process. In addition, electrocatalysis implies high product selectivity especially importance in the electrosynthesis of organic compounds.
Cyclic stationary-electrode voltammetry, usually called as cyclic voltammetry (CV) is perhaps the most effective and versatile electroanalytical technique available for the mechanistic study redox systems [2]. It is enables the electrode potential to be scanned rapidly in search of redox couples. Once located, a couple can then be characterized from the potentials of peaks on the cyclic voltammogram and from changes caused by variation of the scan rate. CV is often the first experiment performed in an electrochemical study [2]. Cyclic voltammetry can be used for quantitative analysis because it is convenient for the identification of short lived intermediates and for the elucidation of the kinetics of electrodes process. For analytical purposes, one can measure the peak height, which is proportional to concentration, and used the peak potential as a qualitative indicator of the nature of the species [3].
The cyclic voltammetry method was shown to be a good alternative for electrochemical stability analysis in electrosynthesis and electrocatalytics. The cyclic voltammetry method has been used for analysis of electrochemical stability of Ni-polyester electrode in alkaline solution [4]. Electrocatalytic activity of these materials strongly depends on their morphology, surface area and structure, which in turn depend on the preparation methods. One of the techniques of making the porous electrode is by incorporating polymer material like polyvinyl chloride (PVC) with the powder of respected metals [4 - 8].
The present paper aims to describe the electrochemical stability of Cu, Ni, Co, Pt, Ir metals sheet and their composite electrodes for electrooxidation of ethanol in KOH solution. The electrochemical stability was analyzed using cyclic voltammetry. Cyclic voltammetry is very suitable for the study of electrochemical stability [4].
2. EXPERIMENT
2.1. Solutions
and to keep an inert atmosphere over the reaction solution during the oxidation process. Ethanol solution was prepared by dilution of absolute ethanol (BDH laboratory supplies) with deionised distilled water.
2.2. Preparation of an electrode 2.2.1. Preparation of a solid electrode
Solid metal foil (99.98% purity, Aldrich Chemical Company) was used to prepare solid electrode. A 0.5 mm thick Ni foil was cut into approximately 1 cm x 1 cm piece and connected to silver wire with silver conducting paint prior covered with epoxy gum [9].
2.2.2. Preparation of composite electrode
The composite electrode was prepared using mechanical alloying technique (MAT) by mixing together a weighed portion of metal powder (< 2 micron in size and 99.9% purity, Aldrich Chemical Company) and PVC in 4 ml tetrahydrofuran (THF) solvent and swirled flatly to homogeneous followed by drying in an oven at 1000 C for 3 hours [10]. The mixture was placed in 1 cm diameter stainless steel mould and pressed at 10 ton/cm2. A typical pellet contained approximately 95% of metal powder and 5% of PVC polymer. The total weight of pellet obtained is approximately 1.5 g. The same procedure as solid metal foil were later carried out for composite electrode preparation.
2.2.3. Electrochemical stability of the electrodes
Universal Pulse Dynamic EIS, Voltammetry, Voltalab potentiostat (Model PGZ 402) was used for electrochemical stability measurements, data acquisition was accomplished using Voltamaster 4 software. Cyclic voltammetry experiments were performed in a three electrodes system using solid electrode (Cu, Ni, Co, Pt and Ir) and composite electrode (Cu-PVC, Ni-PVC, Co-PVC, Pt-PVC and Ir-PVC) as a working electrode (anode), SCE as reference electrode and platinum wire as the counter electrode. All potentials given are with respect to the SCE reference electrode.
2.2.4. Electrochemical stability of the electrodes
3. RESULT AND DISCUSSION
3.1. Cyclic voltammetry of solid electrodes
-800 -600 -400 -200 0 200 400 600 800 -2 0 2 4 6 8 10 12 C2 C1 A4 A3 A2 A1 C urr en t de nsi ty [m A /cm ²] Potential [mV]
100 200 300 400 500 -3 -2 -1 0 1 2 3 4 5 C1 A1 C urr en t de nsi ty [m A /cm ²] Potential [mV]
0 100 200 300 400 500 -3 -2 -1 0 1 2 3
4 cycle 10
cycle 1 C urr en t de nsi ty [m A /cm ²] Potential [mV]
-600 -400 -200 0 200 400 600
-1.0 -0.5 0.0 0.5 1.0 1.5 2.0 C2 C1 A3 A2 A1 C urr en t de nsi ty [m A /cm ²]
-0.8 -0.6 -0.4 -0.2 0.0 0.2 0.4 0.6 0.8 1.0 -0.1 0.0 0.1 0.2 0.3 0.4 0.5 0.6 0.7 A2 A1 C u rr e n t d e n s ity [m A /c m ²] Potential [V]
-800 -600 -400 -200 0 200 400 600 800 1000 -100 0 100 200 300 400 500 600 700 800 cycle 5 cycle 1 C urrent densit y [ µA/ c m ²] Potential [mV]
-0.2 0.0 0.2 0.4 0.6 0.8 1.0 1.2 1.4 1.6 -1.5 -1.0 -0.5 0.0 0.5 1.0 1.5 C2 C1 A2 A1 C urrent densit y [ m A/ c m ²]
Potential [V] -0.2 0.0 0.2 0.4 0.6 0.8 1.0 1.2 1.4 1.6
[image:5.596.80.519.70.503.2]-1.5 -1.0 -0.5 0.0 0.5 1.0 cycle 10 cycle 1 C urr en t de nsi ty [m A /cm ²] Potential [V]
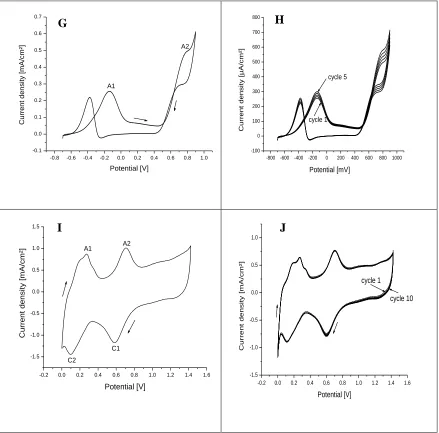
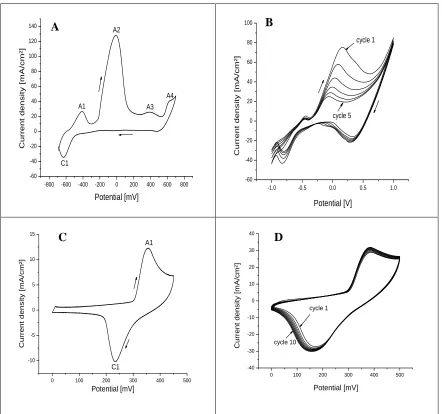
Figure 1. Cyclic voltammograms (A, C, E, G, I) Cu, Ni, Co, Pt, Ir solid electrodes with one cycle, and
(B, D, F, H, J) for Cu, Ni, Co, Pt, Ir solid electrodes with continues cycle at 4 cycle for Cu, 5 cycle for Co and Pt and 10 cycle for Ni and Ir, in 1.0 M KOH. Cyclic voltammograms Pt and Ir electrodes in 0.25 M ethanol + 1.0 M KOH. Scan rate of Cu: 10; Ni:100; Co: 50; Pt: 10 and Ir: 500 mV/sec
Figure 1(A and B) shows the cyclic voltammogram of 1.0 M KOH with the sweep potential from potential -700 up to +700 mV, and than return from +700 mV up to -700 mV using Cu metal electrode. The A1, A2, A3 and A4 peaks represent the anodic peaks. These peaks represents the oxidation of Cu(0) to Cu(I), Cu(I) to Cu(II) and Cu(II) to Cu(III) [11 – 13]. The C1 peak represent the reduction of Cu(III) to Cu(II) while the C2 peak shown the reduction of Cu(II) to Cu(I) or Cu(0) . Figure 1A and 1B shows the cyclic voltammograms of Cu metal foil with one cycle and four cycles (continues cycle), respectively, where the same anodic peaks were recorded for both process. Figure 1A and 1B show anodic and cathodic peaks was observed for Cu metal foil electrodes. The only significant difference between the cyclic voltammograms as shown in Figure 1A and 1B are
G H
degradation of current density. For four cycle voltammogram, higher current density was observed at first cycle followed by decreasing in current density for the second, third and fourth cycle due to unstable of Cu electrode 1.0 M KOH. Cu metal is easily oxidized to form oxide compounds in the alkaline medium, which would formed oxide coating on the surface of the electrode, Cu2O, CuO, and
Cu(OH)2, besides the other species depending on the potential, pH of the solution, the mass-transport
conditions, ageing and surface restructuring processes [14].
Figure 1 C, E, G and I show the cyclic voltammograms using Ni, Co, Pt and Ir solid electrode in 1.0 M KOH (Ni and Co electrode) and in 0.25 M ethanol + 1.0 M KOH (Pt and Ir electrode). Figure 1 D, F, H and J show the cyclic voltammograms to observe the effect of continues cycle using Ni, Co, Pt and Ir solid electrode in 1.0 M KOH (Ni and Co electrode) and in 0.25 M ethanol + 1.0 M KOH (Pt and Ir electrode). Figure 1 D, F, H and J show that Ni, Co, Pt and Ir solid electrodes have good stability for electrochemical oxidation in KOH.
A1 (anodic) peak at Figure 1C represents the oxidation peak of Ni(II) to Ni(III) due to the changing of Ni(OH)2 to NiOOH [14 – 19]. Oxidation of Ni (0) to Ni (II) occurred at more negative
potential or hydroxide region (not shown in this cyclic voltammogram). C1 (cathodic) peak in Figure 1C represents two crystallographic forms of α and β oxyhydroxide [15, 19]. Nickel oxyhydroxide (NiOOH) is capable to oxidize a number of functional groups, for example primary alcohols may be oxidized to carboxylic acids [20]. Nickel has been reported to be a good electrode for the oxidation of various organic compounds. A redox couple of nickel, i.e., nickel hydroxide (Ni(OH)2) and nickel
oxyhydroxide (NiOOH), was shown to be involved in the oxidation of alcohol at nickel electrodes in alkaline media [21]. Nickel oxyhydroxide (NiOOH) involved in the reaction that will oxidize ethanol to acetaldehyde and further oxidized to acetic acid. Most of acetaldehyde was oxidized to acetic acid because its oxidation rate is faster than ethanol. The reaction of organic compounds with the nickel oxides of higher valences is usually the rate determination step.
Figure 1E shows cyclic voltammogram for a Co sheet electrode in 1.0 M KOH. Peaks A1, A2 and A3 represent anodic peaks. Peak A1 represent of chemisorptions of OH- on Co electrodes. Peaks A2 and A3 represent of oxidation of Co(0) to Co(II) and Co(II) to Co (III) respectively [22]. C1 and C2 peaks represent reduction of Co(III) to Co(II) and Co(II) to Co(0) respectively.
ethanol, recorded between 0 V and +1.4 V with a scan rate of 500 mV/sec. In alkaline solutions (Figure 1I and 1J), peak A1 shows measurable chemisorptions of OH- on iridium electrodes to formed Ir-OH [24]. Peak A2 (in Figure 1 I and 1J) shows oxidation potential of ethanol in alkaline solution. Figure 1G (peak A2 at 0.7 V) shows oxidation potential of ethanol in alkaline solution using Ir electrode.
3.2. Cyclic voltammetry of composite electrodes
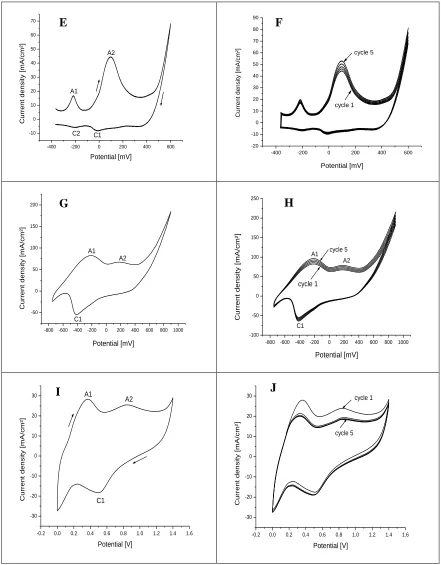
Figure 2 A, C, E, G and I show cyclic voltammograms using Ni, Co, Pt and Ir composite electrode (Cu-PVC, Ni-PVC and Co-PVC composite electrodes) in 1.0 M KOH and in 0.25 M ethanol + 1.0 M KOH (Pt-PVC and Ir-PVC composite electrodes). Figure 2 B, D, F, H and J show cyclic voltammograms to observe the effect of continues cycle using Cu-PVC, Ni-PVC, Co-PVC, Pt-PVC and Ir-PVC composite electrode in 1.0 M KOH (Ni and Co composite electrode) and in 0.25 M ethanol + 1.0 M KOH (Pt and Ir composite electrode).
-800 -600 -400 -200 0 200 400 600 800 -60 -40 -20 0 20 40 60 80 100 120 140 C1 A4 A3 A2 A1 C urrent dens it y [ m A/ c m ²] Potential [mV]
-1.0 -0.5 0.0 0.5 1.0 -60 -40 -20 0 20 40 60 80 100 cycle 1 C urrent densit y [ m A/ c m ²] Potential [V] cycle 5
0 100 200 300 400 500 -10 -5 0 5 10 15 C1 A1 C urrent dens it y [ m A/ c m ²] Potential [mV]
0 100 200 300 400 500 -40 -30 -20 -10 0 10 20 30 40 cycle 10 cycle 1 C urrent dens it y [ m A/ c m ²] Potential [mV]
A B
[image:7.596.79.521.337.751.2]
-400 -200 0 200 400 600
-10 0 10 20 30 40 50 60 70 C2 C1 A2 A1 C urrent dens it y [ m A/ c m ²]
Potential [mV] -400 -200 0 200 400 600
-20 -10 0 10 20 30 40 50 60 70 80 90 C u rre n t d e n si ty [mA/ cm²] Potential [mV] cycle 1 cycle 5
-800 -600 -400 -200 0 200 400 600 800 1000 -50 0 50 100 150 200 C1 A2 A1 C urrent dens it y [ m A/ c m ²]
Potential [mV] -800 -600 -400 -200 0 200 400 600 800 1000
-100 -50 0 50 100 150 200 250 cycle 5 C1 A2 A1 cycle 1 C urrent dens it y [ m A/ c m ²] Potential [mV]
-0.2 0.0 0.2 0.4 0.6 0.8 1.0 1.2 1.4 1.6 -30 -20 -10 0 10 20 30 C1 A2 A1 C urr en t de nsi ty [m A /cm ²] Potential [V]
-0.2 0.0 0.2 0.4 0.6 0.8 1.0 1.2 1.4 1.6 -30 -20 -10 0 10 20 30 cycle 5 cycle 1 C urr en t de nsi ty [m A /cm ²] Potential [V]
Figure 2. Cyclic voltammograms (A, C, E, G, I) Cu, Ni, Co, Pt, Ir composite electrodes with one
cycle, and (B, D, F, H, J) for Cu, Ni, Co, Pt, Ir composite electrodes with continues cycle at 5 cycle for Cu-PVC, 5 cycle for Co-PVC, Pt-PVC, Ir-PVC and 10 cycle for Ni-PVC, in 1.0 M KOH. Cyclic voltammograms Pt-PVC and Ir-PVC electrodes in 0.25 M ethanol + 1.0 M KOH. Scan rate of Cu-PVC: 10; Ni-PVC:30; Co-PVC: 10; Pt-PVC; 20 and Ir-PVC; 50 mV/sec
Figure 2 D, F, H and J show that Ni-PVC, Co-PVC, Pt-PVC and Ir-PVC composite electrodes possess good stability for electrochemical oxidation in KOH solution.
E F
G H
[image:8.596.78.519.69.634.2]
Table 1. Data for activity and stability of solid electrodes
Solid electrodes
Maximum current density (mA/cm2)
Activity Stability
Cu 11.5 Large activity No stability
Ni 4.4 Medium activity Good stability
Co 1.5 Medium activity Good stability
Pt 0.5 Low activity Good stability
[image:9.596.82.515.264.370.2]Ir 1.0 Low activity Good stability
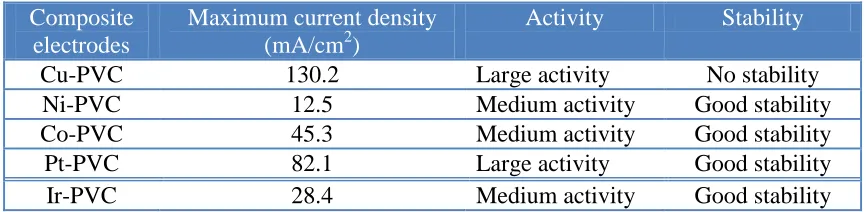
Table 2. Data for activity and stability of composite electrodes
Composite electrodes
Maximum current density (mA/cm2)
Activity Stability
Cu-PVC 130.2 Large activity No stability
Ni-PVC 12.5 Medium activity Good stability
Co-PVC 45.3 Medium activity Good stability
Pt-PVC 82.1 Large activity Good stability
Ir-PVC 28.4 Medium activity Good stability
Table 1 and 2 shows electrochemical activity and stability parameters for solid and composite electrodes in 1.0 M KOH. The result from the cyclic voltammetry shows that the electrochemical activity and stability in alkaline solution using composite electrode is at a higher current density (Table 2) compared to solid electrode (Table 1). This indicates that composite electrode gave a better electrochemical activity and stability for the electrochemical oxidation in KOH compared to solid electrode. The higher current density showed higher electrochemical activity [25]. From these cyclic voltammetry experiments, the composite electrodes are suitable for electrosynthesis and fuel cell purposes. Composite electrodes are more economical and beneficial for the oxidation of materials compared to solid metal electrode due to higher current density; hence more oxidation process will occur.
3.3. Chemical stability of electrodes
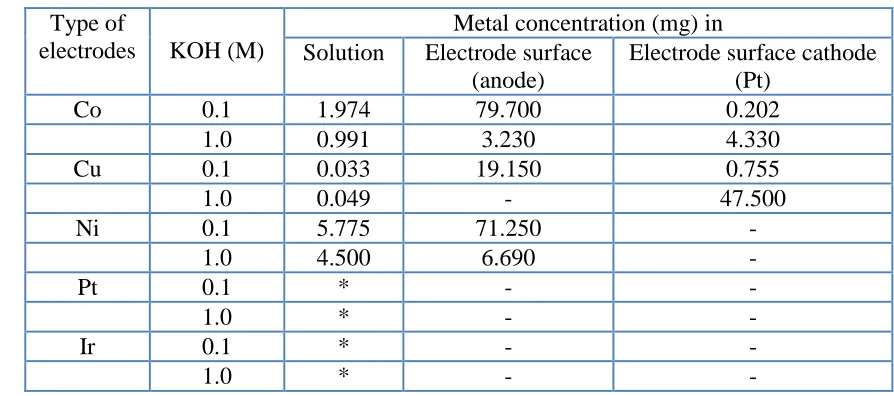
The stability of electrode was analyzed using Atomic Absorption Spectroscopy (AAS). Analysis have been done at three part which is solution, sponge formed on the electrode surface of anode and cathode. Table 3 shows metal concentration in solution and electrode surface (anode and cathode) or sponge using AAS as a result of electrolysis of 0.25 M ethanol by solid electrode for 6 h electrolysis time at constant potential of 1050 mV.
0.1 M KOH forms sponge on electrode surface with a quantity of Co, Ni and Cu are 79.7 mg, 71.25 and 19.150 mg, respectively. For example, if the initial weight of Co electrode is 856.7 mg, after 6 h of electrolysis process the final weight of the electrode will increases 9.32% due to sponge formation. More sponge was formed on the electrode surface during electrolysis of ethanol in 0.1 M KOH rather than 1.0 M KOH. No sponge was formed during electrolysis of ethanol in 1.0 M KOH using Cu electrode while a lot of sponge was form in cathode.
Table 3. Metal concentration in solution and electrode surface (anode and cathode) or sponge as a
result of electrolysis of 0.25 M ethanol by solid electrode, electrolysis time 6 h at constant potential of 1050 mV.
Type of
electrodes KOH (M)
Metal concentration (mg) in Solution Electrode surface
(anode)
Electrode surface cathode (Pt)
Co 0.1 1.974 79.700 0.202
1.0 0.991 3.230 4.330
Cu 0.1 0.033 19.150 0.755
1.0 0.049 - 47.500
Ni 0.1 5.775 71.250 -
1.0 4.500 6.690 -
Pt 0.1 * -
-1.0 * - -
Ir 0.1 * -
-1.0 * - -
Note: (-) not sponge formed, (*) not detected using AAS
Table 4. Metal concentration in solution and electrode surface (anode and cathode) or sponge as a
result of electrolysis of 0.25 M ethanol by composite electrode, electrolysis time 6 h at potential constant 1050 mV using AAS.
Type
electrodes KOH (M)
Metal concentration (mg) in Solution Electrode surface
(anode)
Electrode surface cathode (Pt)
Co-PVC 0.1 0.982 49.700 0.486
1.0 0.671 7.236 7.240
Cu-PVC 0.1 0.874 23.150 2.341
1.0 0.562 - 17.591
Ni-PVC 0.1 3.775 65.452 -
1.0 2.583 11.392 -
Pt-PVC 0.1 0.008 -
-1.0 0.023 - -
Ir-PVC 0.1 nd -
-1.0 nd - -
[image:10.596.69.516.252.450.2] [image:10.596.81.514.544.739.2]
Table 4 shows the result for chemical stability analysis of composite electrode after used for electrolysis of 0.25 M ethanol in 1.0 and 0.1 M KOH with 6 h of electrolysis time at 1050 mV. In general, metal content in the solution are very low for all composite electrodes. However, the sponge formed on the electrode surface of Co-PVC, Ni-PVC and Cu-PVC that may cause the corrosion also affected the composite electrode. A lot of sponge formed during electrolysis of ethanol in 0.1 M KOH especially at electrode surface of Co-PVC, Ni-PVC and Cu-PVC. Composite electrodes have a good stability in alkaline solution. This is proved by low concentration of dissolve metal during electrolysis.
4. CONCLUSIONS
Ni, Co, Ir and Pt metal sheets and their composite electrodes have higher stability compared to Cu metal sheet and its composite electrode. Electrooxidation of ethanol in KOH solution using metal sheets and their composite electrodes have show a good stability based on the analysis using AAS. The composite electrodes have show a higher current density compared to metal sheet electrodes. Base on the metal content in solution the stability of composite electrode is more stable than the metal sheet electrode.
ACKNOWLEDGEMENTS
This research were funded by Universiti Kebangsaan Malaysia (UKM) for the financial research through the projects ST-005-2005, UKM-DLP-2012-024 & DIP-2012-22, Ministry of Higher Education through the project UKM-ST-01-FRGS0043-2006 and Ministry of Science, Technology and Innovation through the project 06-01-02-SF0555.
References
1. A.M. Couper, D. Pletcher and F. Walsh, Chem Rev., 90 (1990) 837
2. P.T. Kissinger and W.R. Heineman, Laboratory Techniques in Electroanalytical Chemistry, 2nd ed, Marcel Dekker Inc., New York (1996)
3. R.D. Levie, Principles of Quantitative Chemical Analysis, McGraw-Hill International Edition, New York (1997)
4. M.M. Davila, M.P. Elizalde and R. Silva, J Mater Sci 32 (1997) 3705
5. M. Gonzalez, M.P. Elizalde, L. Banos, G. Poillerat and M.M. Davila, Electrochim Acta, 45 (1999) 741
6. M.M. Davila, M.P. Elizalde, J. Mattusch and R. Wennrich, Electrochim Acta, 46 (2001) 3189 7. M.M.D. Jimenez, M.P. Elizalde, M. Gonzalez and R. Silva, Electrochim Acta, 45 (2000) 4187 8. M.G. Pereira, M.D. Jimenez, M.P. Elizalde, A.M. Robledo and N.A. Vante, Electrochim Acta, 49
(2004) 3917
9. Riyanto, J. Salimon and M.R. Othman, Sains Malaysiana, 36(2) (2007) 175
10.Riyanto and Mohamed Rozali Othman, The Open Material Science Journal, 2 (2008) 40 11.J.M. Marioli and T. Kuwana, Electrochim Acta, 37 (1992) 1187
15.F. Hahn, B. Beden, M.J. Croissant and C. Lamy, Electrochim Acta, 31 (1986) 335 16.I.G. Casella, M.R. Guascito and M.G. Sannazzaro, J. Electroanal Chem., 462 (1999) 202 17.I.H. Yeo and D.C. Johnson, J. Electroanal Chem., 495 (2001) 110
18.P. Parpot, S.G. Pires and A.P. Bettencourt, J. Electroanal Chem., 566 (2004) 401
19.S.L. Medway, C.A. Lucas, A. Kowal, R.J. Nichols and D. Johnson, J Electroanal Chem., 587 (2006) 172
20.F. Hahn, B. Beden, M.J. Croissant and C. Lamy C, Electrochim Acta, 32 (1987) 1631
21.H. Lund and O. Hammerich, Organic Electrochemistry, 4th ed, Marcel Dekker Inc., New York (1991)
22.J.W. Kim and S.M. Park, J Electrochem Soc., 146 (1999) 1075
23.H. Hitmi, E.M. Belgsir, J.M. Leger, C. Lamy and R.O. Lezna, Electrochim Acta, 39 (1994) 407 24.L.D. Burke and K.J. O’dwyer, Electrochim Acta, 35 (1990) 1829
25.M.A.G. Contreras, S.M.F. Valverde and J.R.V. Garcia, J Alloys Comp., 434-435 (2007) 522