STATISTICAL OFFICE OF THE EUROPEAN COMMUNITIES
m
eurostat
GAS PRICES
1 9 8 0 - 1 9 8 2
eurostat
DE EUROPÆISKE FÆLLESSKABERS STATISTISKE KONTOR STATISTISCHES AMT DER EUROPÄISCHEN GEMEINSCHAFTEN STATISTICAL OFFICE OF THE EUROPEAN COMMUNITIES OFFICE STATISTIQUE DES COMMUNAUTÉS EUROPÉENNES ISTITUTO STATISTICO DELLE COMUNITÀ EUROPEE
BUREAU VOOR DE STATISTIEK DER EUROPESE GEMEENSCHAPPEN
L-2920 Luxembourg - Tél. 43011 Télex: Comeur Lu 3423
Thit publication is also available in French.
NOTE: In the Statistical Annex, the continental practice of using a comma for the decimal point is adopted.
C O N T E N T S
I I I
I I I IV
ν
INTRODUCTION
CONDITIONS ¿ND METHODS 1. Scope and locations
2. Unite of measurement of energy 3· Standard consumers
4· Definition of the price levels recorded UNITS OF VALUE
TAXES LEVIED ON GAS SALES
GAS PRICES IN THE VARIOUS COUNTRIES 1. FR Germany
VI
2. France ]
3. Italy ;
4 · Netherlands ] 5* Belgium ] 6. Luxembourg ] 7* United Kingdom ] 8 # Denmark ] CONCLUSIONS
I a)
1 ^
ι c)
ι
d)
. e) 1 f)
Situation in the gas industry Taxes
Household prices tariffs Household prices analysis Industrial prices tariffs Industrial prices analysis
Statistical Annex Tables
Household and industrial prices by location 1 1 1
12 13 14 15
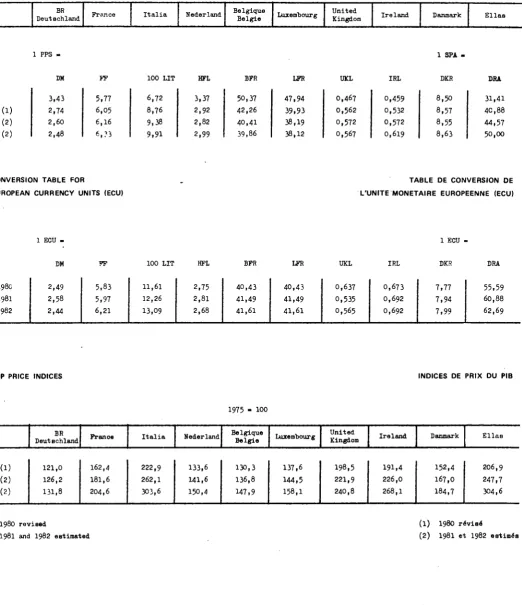
Conversion factors for PPS and ECU, GDP price in Community comparison in ECU (current prices) Community comparison in deflated PPS
I - INTRODUCTION
The present publication is an updating of gas prices in the Community up to and including I982. It follows on from previous publications, which are still available t
GAS PRICES I978 - I98O EUROSTAT I98O internal document GAS PRICES I976 - I978 EUROSTAT 1979 cat. - CA 28-79-326 GAS PRICES I97O - I976 EUROSTAT 1977 cat. - CA 22-77-120
In order to make things easier for users, these volumes form a published series with the same layout. They also have similar definitions, methods and coverage and thus form a homogeneous set.
In order to avoid repetition, only the general outlines of the survey are set out below in the section entitled "Conditions and methods". If
necessary, reference can always be made to the previous publications.
However, a number of changes have been made to the presentation of the text of this updated version.
As in the past, this study considers three aspects 1
- firstly, description of the tariff systems currently in force on which the prices axe based;
- secondly, taxes on gas sales;
- finally, the recording and analysis of price levels, with comments on recent trends.
The whole thing is rounded off by an international comparison, accompanied by a number of conclusions.
I I - CONDITIONS AND METHODS
1. Scope and l o c a t i o n s
The survey covers eight of the Member S t a t e s of t h e Community and t h e p r i c e s were recorded in 19 towns or conurbations s
- Fr Germany t Düsseldorf
- France ι L i l l e , P a r i s ( l ) , Strasbourg, M a r s e i l l e , Lyon, Toulouse ;
- I t a l y : Milan, Turin, Rome; - Netherlands : Rotterdam;
- Belgium t Antwerp, B r u s s e l s , Liège; - Luxembourg : Luxembourg c i t y ;
- United Kingdom t London, Leeds, Birmingham; - Denmark : Copenhagen.
In Greece, there is no piped gas network.
Prioes for Ireland did not arrive in time to be included in this publication.
Three years are covered by this study :
I98O - I98I - 1982.
The prices are recorded and calculated in accordance with the tariffs, conditions and rules in force at the beginning of each year. I98O is included as a link with the previous study, and also enables any necessary corrections to be made to prices.
2. Units of measurement of energy
Four units of measurement are found in the current gas tariffs, i.e. t the Joule (Belgium)
the kilowatthour (FR Germany, France)
the m3 (Italy, Netherlands, Luxembourg, Denmark) (2) the therm (United Kingdom, Ireland).
The use of the calorie and its derivatives is now prohibited.
With a view to standardization and simplification, the Joule (and its decimal multiples) was chosen by the SOEC as the common unit of
measurement·
(1) P a r i s r e g i o n .
The decimal multiples of the Joule are as follows s
Kilojoule fkJÌ 1 000 Joules
Megajoule (MJ) 1 000 000 Joules
Gigajoule (GJ) = 1 000 000 000 Joules
Terajoule (TJ) = 1 000 000 000 000 Joules.
In the present study, gas prices are expressed in terms of monetary units per Gigajoule.
The table below can be used for conversion from one unit of measurement to another :
1 G i g a j o u l e t
1 Gigawatt hour :
1 therm ι
GJ
1
3 600
. 0.1055
GWh
0.0002777
1
0.0000293
t h
9.4781
34 120
1
In addition, as a guide, one Gigajoule of gas may be said to be
approximately eçruivalent to 35 kg of saleable coal and 25 kg of light fuel oil or heating oil.
Finally, the unit of energy used in this study is measured on the basis of the gross calorific value (GOV), as is the practice in the gas
industry and gas tariffs. This method of measurement departs from that used in energy statistics and for other sources of energy, where the net calorific value (NCV), which is closer to the energy that can
actually be used be the consumer, is always used. For gas, the difference between gross and net calorific value is around 10 %. The gas prices
shown in this study in GJ (GCV) can thus be converted into GJ (NCV) by applying a factor of 1.1.
3. Standard consumers
: ; < · >
D
3
Bìt,
D4ANNUAL
8.37 GJ
16.74 GJ
8 3 . 7 GJ
I 2 5 . 6 GJ
1047 GJ
CONSUMPTION
( i . e . 2 326 kWh)
( i . e . 4 652 kWh)
( i . e . 23 260 kWh)
( i . e . 34 890 kWh)
( i . e . 290 750 kWh)
EQUIPMENT
cooking and water h e a t i n g
cooking, water h e a t i n g and
c e n t r a l h e a t i n g
block c e n t r a l h e a t i n g for
at l e a s t 10 dwellings
For industrial uses, an important factor apart from the annual quantity consumed is the regularity with which the consumer takes gas from the network. This is the concept of modulation (or load factor). The daily modulation indicates the number of days it would take to reach the annual
consumption if the maximum were consumed each day. The hourly modulation indicates the number of hours it would take to reach the annual con sumption if the maximum were consumed each hour. These factors thus determine the peaks in consumption or the consumer's maximum daily and hourly offtake.
For example, in the case of a user who consumes 41 86O GJ a year, a load factor of 200 days means that the maximum daily offtake is 209 GJ (4I 86O divided by 200), and a load factor of 1 6OO hours means that the maximum hourly offtake is 26 GJ (4I 86O divided by 1 600).
Seven standard industrial consumers, coded I., to Ι_ and defined as follows, have been taken :
h
h
XV 1 x
v ?
V i
V2
h
ANNUAL CONSUMPTION
4 1 8 .
4 186
41 860
4 1 860
418 600
418 600
4 186 000
6 GJ ( i . e .
GJ ( i . e .
GJ ( i . e .
GJ ( i . e .
GJ ( i . e .
GJ ( i . e .
GH ( i . e .
116 300 kWh)
1 163 000 kWh)
1 1 . 6 3 GWh)
1 1 . 6 3 GWh)
1 1 6 . 3 GWh)
1 1 6 . 3 GWh)
1 163 GWh)
LOAD FACTOR
no l o a d f a c t o r l a i d down
200 d a y s
200 d a y s
25O d a y s
25O d a y s
330 d a y s
330 d a y s
1 600 h
4 000 h
4 000 h
8 000 h
8 000 h
It can be seen that certain standard consumers have the same load factor for different volumes of consumption or, conversely, different load factors for the same volume of consumption; the reason for this is to enable the effect of these conditions of supply on the level of prices to be observed. The higher the load factor (in days or hours) the more regular the offtake of gas, thus in some oases, enabling the consumer to obtain favourable prices.
Moreover, the load factor gives some idea of the use made of
instal-lations consuming gas. Thus, a very high load factor, e.g. of 8 000 hours, is obviously equivalent to an installation functioning practically non-stop, day and night, throughout the 8 760 hours in the year.
All the prices recorded in this study for standard industrial consumers normally relate to non-interruptible supplies, i.e. the seller of gas must supply the quantities demanded by the consumer (whose peaks are determined by the modulation laid down for standard consumers). In some cases there are interruptible contracts, under which the seller of gas can reduce the quantities supplied to the consumer at certain peak times when the network is overloaded. In return for this reduction of supply, the customer pays a reduced price.
It should be noted finally that the standard industrial consumers
referred to in this study include neither power stations nor industries using gas for non-energy purposes, e.g. the chemical industry.
4. Definition of the price levels recorded
The prices include meter rental, the standing charge, the commodity rate, etc. They are shown per unit of gas sold, i.e. per Gigajoule (GJ, GOV). This unit price is obtained by dividing the total amount paid by the user for the level of consumption in question by the number of units (GJ)
of gas consumed.
In each case, three values are shown t
- the price net of tax
- the prioe excluding VAT but including all other taxes - the selling price (inclusive of all taxes).
The taxes referred to above are those levied directly on the sale of gas to the consumer. The taxes levied prior to this, such as direct company tax or income tax (which obviously contribute to the manufacturing costs), are not shown separately in this study.
Further information on taxes is given in chapter IV.
The results for each country are shown in national currencies at current prices, i.e. at face value.
For the purposes of international comparison, it was necessary to use a representative common monetary unit which would create a minimum of distortion in both space and time. Accordingly, the present study uses the purchasing power standard (PPS), which is outlined and explained in the following section.
10
III. UNITS OF VALUE
To enable comparisons between countries, prices expressed in national currencies need to be converted to a common unit. In this study two common units are used : the European Currency Unit (ECU) and the Purchasing Power Standard (PPS).
a) The European Currency Unit (ECU)
The ECU is based on a 'basket' of the currencies of nine of the Member States of the Community, converted at market exchange rates. It is defined as the sum of the following fixed amounts ι DM 0.828 UKL 0.0885 FP 1.15 LIT 109 HFL 0.286 BFR 3.66
LFR 0.14 DKR 0.217 IRL O.OO759. Greece is due to be intro duced into the ECU by the end of I985.
The conversion rates for ECU are given in a table in annex.
The ECU reflects fluctuations in exchange rates and is well adapted to measure foreign trade prices and the values of international flows. A comparison in ECU, therefore, takes the viewpoint of a tourist who buys goods and services in a foreign country, after changing his money at a bank. This differs from the SPA viewpoint which is one of a con sumer who buys goods and services in his own country with the national currency.
The ECU also has the inconvenience that its definition changes when a new currency is introduced and that it is not coherent with the Gross Domestic Product price index, which makes it difficult to deflate.
b) The Purchasing Power Standard (PPS)
The PPS is a reference unit for which the ratios between the different national currencies are proportional to the purchasing power parities
(PPP) between these currencies.
11
It should be noted that the level at which the PPS is fixed does not influence the comparison between countries. When prices are con-verted to PPS using the GDP parity the following judgement is possible»
if one Gigajoule of energy costs 10 PPS in country A and 5 PPS in country B, this means that after eliminating the differences between the general level of prices in the two countries, this Gigajoule of energy is twice as expensive in country A than in country B.
This judgement is independant of market exchange rates and therefore, is not influenced by fluctuations in the same, brought about by move-ments of capital, speculation, political decisions, etc.
The conversion rates for the years covered by this study are given in a table in annex.
c) Prices in "constant" PPS
When current prices for a given year are converted to PPS with the
help of the current PPP for the same year, comparisons between countries have the significance mentioned above (point b ) ; however, the compari-son in time which one can derive for each country has little interest.
Firstly, it should be noted that the current parities for each year between each currency and the PPS are the result of an extrapolation
obtained by multiplying the parities for the base year by the GDP price index for each country and dividing them by the community GDP index.
The latter being incorporated in the extrapolated parity for each country, it may be eliminated without affecting the result of the comparison between countries.
By eliminating the community index, the application of the extra-polated parities means that for each country the prices for each year are divided "by the GDP price index of the country (i.e. the prices are deflated) and are converted to PPS using the parity for the base year.
Therefore the comparison between countries is not affected by elimi-nating the community GDP index, and comparisons in time have taken on a new and interesting significance.
In effect, when the price of a product in a given year, deflated by the GDP price index for the same country and converted to PPS using the parity for the base year, is divided by the price in the base year also converted to PPS using the same parity, a relative price index is obtained, i.e. the ratio between the index of the price concerned and that of the GDP.
12
d) Price series
On the basis of the preceding descriptions, the results of this survey of Community prices are given in three forms t
1) a series at current prices in the national currency for each oountry;
2) a series in current ECU using the average conversion rates for January of the year concerned;
13
IV - TAKES LEVIED ON GAS SALES
1. VALUE-ADDED TAX (VAT)
In seven of the countries of the Community gas sales are subject to VAT. As can be seen in the following table the rates vary widely from one country to another :
# of price before VAT
F.R. Germany France
Italy (households) Italy (industry) Netherlands Belgium Luxembourg Denmark
Jan. I98O
13
17.6
6
14
18
6
5
20.25
Jan. 1981
13
17.6
8
15
18
16
5
22
Jan. 1982
13
17.6
8
15
18
Π
5
22
Gas sales in the United Kingdom and Ireland are zero-rated.
14
2. OTHER TAXES a) Italy
Natural gas sold for household uses is subject to a consumption tax. At the beginning of March I98O the rate of this tax was reduced from LIT 36.5O per m? to LIT 30 per m?.
This tax is also applied to manufactured gas in proportion to the percentage of natural gas used in its manufacture.
The consumption tax on the manufactured gas included in this study is as follows :
Milan Rome
Jan. I98I 12.17 IO.52 LIT/m3
Jan. 1982 12.31 IO.52 LIT/m3
The differing rates are due to the different compositions of the gases.
Since November I98O (law no. 784) domestic consumers in the south of Italy ("Cassa per il Mezzogiorno" zone) are exempt from this consumption tax.
This tax ie included in the price on which VAT is levied.
b) Netherlands
A special environment levy is charged on all consumption at a rate of 0.03 cent per m3 in I98I and 0,05 cent per m3 in I982.
This tax is also subject to VAT.
c) Denmark
In August 1979 a consumption tax on piped gas with a gross calorific value of less than 23 MJ/m3, which is the case in this study, was introduced. The original rate was 20 /ire per m3 but this was reduced to 16 ¿re per m3 from 30th June I98O.
15
16
1. FR GERMANY
a) Situation in the gas industry
Several hundred gas undertakings operate in the FR Germany and may be classified into three categories :
number producers of natural gas
gas transporters (Ferngasgesellschaften) gas distributors
4
9
463
The producers and transporters sell gas to certain large consumers and also supply the distributors.
The latter are therefore mainly retailers, although 90 of them also produce gas.
Gas sales are made up as follows :
%
SELLERS
N a t u r a l gas
p r o d u c e r s
Gas t r a n s p o r t e r s
D i s t r i b u t o r s
TOTAL
B U Y E R S
I n d u s t r y and power s t a t i o n s
7
30
26
6 3 ^
House h o l d s
24
24
Commerce and h a n d i c r a f t s
0
5
5
Government d e p a r t
ments
0
4
4
H e a t i n g s t a t i o n s and o t h e r s
0
0
4
4 ■
TOTAL
7
30
63
100
(l) Including 30$ power stations.
In I98O the number of gas consumers was as below
Households,
of which: t a r i f f s
s p e c i a l c o n t r a c t s
Commerce, s m a l l i n d u s t r i e s
Government d e p a r t m e n t s
I n d u s t r y
O t h e r s
1 OOOn
7 600 (4 500)
( 3 100)
31
35
17
3
S t a n d a r d consumers
D1D2 D3D4
h
J2
17
FR GERMANYIn addition, more than 500 000 households were heated by heating stations run on gas.
The majority of customers receive gas via the distributors. The producers and transporters supply only a small number of large consumers directly: 50 power stations, 1 400 industrial companies and around 1 000 govern-ment departgovern-ments.
In I98O natural gas dominated the market with 97% of consumption, as against 3$ for manufactured gas (not including coke-oven and blast-furnace gases, which are used by their manufacturers). This study therefore refers only to natural gas prices.
As regards the sources of supply of natural gas, the following table shows the decline in supplies from the Netherlands to the benefit of imports from third countries :
domestic production
imports from the Netherlands imports from the USSR
imports from Norway
1979 34$ 38$ 16$ 12$ 100$
I98O 30.5$ 37$ 17$ 15-?* 100$
1981 33$ 32$ 20$
JL5Ì.
100$
b) Taxes
Taxes are treated separately in Chapter TV.
c) Household prices - tariffs
In accordance with German law, several two-part tariffs are offered to the smallest household consumers (types D.. Dp in this study), with an increasing standing charge and a decreasing commodity rate. These tariffs are published.
By way of example, the tariffs applied in Düsseldorf are as follows :
Beginning
of I98I
Beginning
of 1982
Standard consumer
D
l
D
2
D
l
D
2
Standing charge
DM/year
54
150
70.20
195
Commodity rate
DM/m
3O.90
0.54
1.17
O.70
FR GERMANY 18
The largest household consumers (types D~ and D. in this study) are supplied under the system of special contracts 4(Sondervertrage). For example, in Düsseldorf these contracts are based on an annual standing charge and a single commodity rate for individual heating (standard consumer D,), whereas for collective heating (D.) the standing charge is replaced by a charge proportional to the rating^of the boiler.
By analogy with the regulations applying to electricity prices, there is a minimum price limit which cuts across the degressivity curve. In Düsseldorf this price limit, which amounted to 69 Pf/m3 in I982, applies
to standard consumer D«, · 3b
The contracts for all household uses are annual ones, renewed by tacit agreement. In Düsseldorf, for example, the meters are read once a year and a final invoice is sent. The customer, who has already made five lump-sum payments - one every two months - then pays the balance.
The tariffs and the terms of the contracts are amended at the instigation of the distribution companies.
As a rule, the changes are made in October or November.
d) Household prices - analysis
The prices for Düsseldorf are given in Table 1 in the annex. For various reasons it was not possible for the survey to include all of the towns covered by the previous studies. It is hoped that this shortfall will be made up in the next study.
Domestic consumers in Düsseldorf were subjected to large price rises bet ween I980 and I982, ranging from 57·5 $ increase for the smallest to 80 $ for the largest. This is not surprising as, before I98O, the pre-VAT price of gas in Düsseldorf had not increased since 1976. These varying price increases have led to a decrease in tariff degression. This degression (reduction in unit price as consumption increases from 8.37 GJ/year to 1 O47 GJ/year) was 58 $ in I982, compared with 64 $ in I98O.
A comparison between the selling price of gas and the Gross Domestic Product (GDP) price index shows that since 1975 gas prices have risen by considerably more than prices for all goods and services, despite being almost stagnant for 4 years.
1980 1981 1982
GDP price index
121.0 126.2 * I3I.8 *
Dl 134-9 163.4 212.5
D2 140.5 170.4 212.1
sell ing price D3 142.3 I84.7 230.2
1975 «
D3b 139-2 I85.7 238.O
= 100
D4 146.4 214.8 263-4
19 FR GERMANY
e) Industrial prices - tariffs
Except in the case of the smallest non-domestic consumers (standard consumer I- in this study), who have two—part tariffs similar to those for households, there are no published tariffs for industry in the FR Germany. Supplies are made under the contract system.
These contracts are based on three components :
— fixed annual standing charge, independent of consumption (Messpreis); — offtake charge, which generally depends on the maximum daily offtake
(Le i stungspre is);
— commodity rate, in most cases a single price per unit consumed (Arbeitspreis).
More than one commodity rate may be charged, depending on the total volume of consumption during the year.
The contracts run for a year and are renewable by tacit agreement. The terms can be modified at the instigation of the gas sellero As a rule, any changes are made in October or November.
There are also "interruptible" contracts for large industrial consumers (type I.). The gas supply is interrupted by the seller, who must give prior notice.
To give some idea of the terms of these special contracts, in Düsseldorf supplies may be interrupted for between 20 and 30 days a year» In return, the consumer is exempted from paying the offtake charge. For standard
consumer I. 0, for example, this represents a reduction of around 10$ in 1982. A~2
f) Industrial prices - analysis
The prices are given in Table 1 in the annex. In Düsseldorf large price rises are noted between I980 and I982, ranging from an increase of around 67 $ for the small industrial consumers to over 72 $ for the largest consumers. For contract consumers the increases were greater during I98I than during I98O. Degression has been reduced slightly. The reduction in unit price as consumption increases from 4I8.6 Gj/year to 418 6OO GJ/year i.e. 1 000 times greater ,was 31 $ in I98O and 29 $ in 1982.
For industrial consumers in Düsseldorf, improving the modulation
(reducing the maximum daily offtake) has a better effect on prices than increasing the volume consumed. For example, for a consumer with a consumption of 4I 86O GJ per year, an increase in modulation from 200 days to 250 days will result in a 3·6 $ price reduction, whereas
FR GERMANY 20
A comparison between the selling price of gas in Düsseldorf and the Gross Domestic Product (GDP) price index reveals that since 1975 gas prices for industry have risen by considerably more than prices for all goods and services. In real terms therefore gas has become more expensive.
1975 = 100
1980 1981 1982
G.D.P. Price index
121.0 126.2 * I3I.8 *
h
II9.5 I58.7 200.4
selling
h
I79.I 218.0 299-5
price
h-i
I75.9 215.4 299-5
in Düsseldorf
h-2
I73.7 214.9 297-4
Vi
200.2 247-6 343-6
V2
I99.2 248.8 343.8
21
FRANCE
a) Situation in the gas industry
In France gasworks gas has virtually disappeared from the market and this study therefore covers only natural gas.
The breakdown of natural gas sales in I98O and I98I is as follows:
$
CUSTOMERS
Domestic uses (individual and collective)
Industry
Public power stations (EDP)
Commercial uses and other uses
TOTAL
(1) Gaz de France
33.2
36.9
0
12.0
82.1
(2) Private companies
and •regies'
1.2
O.4
mm
0.8
2.4
SELLERS
(3)
Société Gaz du Sud Ouest
5.7
0
57
(4)
CEFFM CEFEM
5.I
0
5.I
(5)
SNRA (P)
.
1.5
3.2
4.7
TOTAL
344
496
3.2
12.8
100
(1) Represented in this study by Toulouse (except I I,.), Lille, Paris, Lyon and Marseille
(2) Represented in this study by Strasbourg
(3) Represented in this study by Toulouse (I. I) (4) CEFEM * Compagnie française du méthane
FRANCE 2 2
The national enterprise Gaz de France thus dominates the domestic and industrial market. Its direct sales of gas are broken down as follows}
I98O I98I Standard consumers
Domestic uses: heating tariffs
Domestic usest other tariffs
Collective heating
Commercial and similar uses
Industry
26.8
4-9
9-9
15.0
43.4
100
26.0
3-6
10.2
14.6
45-6
100
D3
Dl
D4
h
h
D3b
D2
h
h
τ5
The total number of customers is 8 200 000, broken down as follows 1
( households ι heating tariffs 3 200 000
> households 1 other tariffs 4 65O 000 ( commercial and similar uses 300 000 > industry 16 000
Supplies of natural gas are diversifying as regards both origin and point of entry:
I98O I98I
National production (Sud-Ouest (Netherlands
^FR of Germany Imports (USSR
> Norway (Algeria
b) Taxes
Taxes are dealt with in Chapter IV.
28.1
37.5
3.913.2
9.3 7.925.5
31.0
3.815.0
9.8
14.9
23
FRANCEc) Household prices - tariffs
The tariffs for 'retail' or 'semi-wholesale' sales are of the simple two/part type with a standing charge and a rate for the gas consumed. The standing charges are standardised throughout the country. The
commodity rate is uniform for the smallest household consumers
(cooking and hot water) and has a limited number of levels for larger consumers (heating), depending on the region. As an example, the table below shows the tariff components applicable in January 1982 in the cities chosen for the survey (Paris, Lille, Lyons, Marseilles, Toulouse) which are supplied by Gaz de Francet
Standard consumer
, Dl D2
D3 D3b
D
4
Tariff
Bo
3 Gb
B2
heating
Standing charge FP/year
168.12
959.4O
1 936.08
Commodity rate C/kWh
20.57
12.97
12.59
FF/GJ
57.I4
36.03
34.97
For the tariffs 3Gb and B„ - heating higher commodity rate levels are applied in certain regions which are some distance away from the
transport grid connecting the country's natural gas supply points:
Tariff 3 Gb (FF/GJ)
Tariff Ba - heating
(FF7GJ)
Clermont-Ferrand, Limoges, Montpellier
Besançon
36.64
37.58
35-75
36.53
Tariff B0 applies to collective domestic heating (block central
FRANCE
24
d) Household prices analysis
The prices are given in tables 2 4 in the Annex. Between I98O and 1982 Gaz de France domestic prices inoreased by between 34 $ for the smallest consumers and 57 % for the largest consumers. Strasbourg suffered larger increases, from 48 $ for the smallest consumers to 79 $ for the largest, which has left Strasbourg more expensive than the rest of Franoe, for all standard consumers. Tariff degression for Gaz de France has decreased from 59.4 $ in I98O to 52.3 $ in I982.
A comparison between the selling price of gas, and the Gross Domestic Product (GDP) price index gives the following results:
1980 1981 1982
GDP
price index
162.4 I8I.6* 204.6*
D
l
I58.6 I79.4 212.2
Selling D2
160.1 I83.2 219.O
price
D3
220.1 259.I 322.4
Paris
1975
D
3b
I8I.6 2173 274.9
100
D
4
166.6 198.O 261.8
* estimated
It can be seen that prices for small consumers (D., Dp) developped more or less in line with the GDP price index, which means that price
increases only compensated for monetary devaluation. However this is not the case for those who use gas for heating (standard consumers D~ and D . ) ; their gas prices always increased by more than the GDP
price index, which means that gas has become more expensive not only in current terme but also in real terms.
e) Industrial prices tariffs
For the cities chosen for this study the tariffe differ with the seller:
Lille, Paris, Lyons, Marseilles (I. to I,.), Toulouse (I., Ip, I , ) :
Toulouse (I., i j « Strasbourg:
Gaz de France
Société du Gaz du SudOuest municipal company
Gaz de Strasbourg
Gaz de France has two types of tariff, namely type B? heating for * semiwholesale ' sales (I. , I_) and type S or subscription tariffs for large industrial consumers (I,, I
3' V
V·
25 FRANCE
The tariffs for large industrial consumers (I,, I., I,-) have a more complex structure than those described above: they are the subscription tariffs, known as S tariffs.
The S tariffs which are now in force were introduced as from January 1979· They now cover virtually all industrial customers.
These subscription tariffs are made up of three components:
- an identical annual subscription charge for every point on the grid;
- a monthly standing charge based on the daily demand (kWh/day) which the customer has requested;
- a commodity charge per kilowatt hour, with differing rates for two blocks of consumption.
These tariffs have two versions corresponding to the type of network to which the customer's installations are connected, namely the SR tariff
for installations connected to the public distribution network and the ST tariff for installations connected directly to the transmission grid.
A single tariff is applied to the major interconnected transmission routes linking the country's sources of gas; prices for the minor routes are obtained by adding the charges specific to each one to this tariff (system of tolls).
The tariffs refer to an index N which applies to all the tariff components.
The index N ie given by the formula:
N
-
50
h
+ 50
i
with Co - 204, Fo - 119.10 (values of C and F on 31 January 1959).
C represents the wholesale price of French raw coal as published by the Institut National de la Statistique et des Etudes Economiques (INSEE);
F represents the price in Francs per tonne of N° 2 heavy fuel oil calculated as follows:
F - 375.32 Fu/283.
Fu refers to the index of Ne 2 heavy fuel oil prices, published in the
Bulletin Officiel du Commerce et de la Concurrence, for the last day of the month to which N applies.
FRANCE
26
According to the eoonomic conditions of January 1982, the value of N is 905.5. However, actual prices are not the result of the free
application of this index, but result from registered price lists. For example in January I982, actual prices are obtained by applying to the elements of the tariff (N«426) the applied value Na » 608.6 plus an increase of 2.4I7 c/kWh on the commodity rates (i.e. 6.7139 FF/GJ). The applied price resulting from this must never be greater than the price which would result from the free application of the terms of the contract.
If Pref is defined as the reference price (N inequality must always be observed:
Pref
Na
4%
+ inorease / P r e f χ
426~Ν
426), the following
This is the "ceiling" system of the subscription tariffs. The prices actually charged depend therefore on the index Na and the absolute
increase, provided that the ceiling price calculated on the basis of Ν does not come into play.
The table below shows the basic prioes of the tariff components per Gigajoule for the Paris region:
Ν = 426
Standard consumer
ι« 1,
Tariff
SR
ST
Annual sub scription charge in FF
24 000
24 000
Monthly standing charge FF/GJ (1)
43.39 33.67
Commodity rate First block
13.22 I3.O8
remain der 12.67 12.53
(1) Per GJ of maximum daily offtake
27 FRANCE
By applying the index Na and the commodity rate increase the tariff has following values for January I982.
Standard
consumer Tariff Annual sub-scription charge in FF
Monthly standing charge
(see above) FF/GJ
Commodity rate in FF/GJ
First block remainder
h h
SR ST
34 287 34 287
61.99 48.10
44.49 25.40
24.82 24.62
In the other regions, these basic prices may differ as a result of the system of tolls.
Industrial supply contracts, like all contracts are signed for a period of 3 years.
There are also interruptibe contracts, likewise signed for three years, which cover approximately 30 $ of Gaz de France's sales to industry. The terms of these contracts are as follows:
the customers must possess an installation capable of using a type of fuel other than gas;
as a general rule at least 80 $ of the colantities stipulated in the contract must be consumed in this way, except in the case of an interruption of supply;
the supplies are interrupted by Gaz de France, with prior notice of between 24 hours and 15 days;
the price charged results, according to the supply conditions,
FRANCE
28
f) Industrial prices - analysis
The prices are given in tables 2^4 of the annex. The small industrial consumers I, and Ip are charged under the same tariff system as domestic heating and have evolved along similar lines, i.e. increases of 54 $ and 59 $ respectively over the reference period.
For Gaz de France's larger industrial consumers (I-, I , I_) increases were fairly uniform throughout the country, from 5&fo for the I- to 62$ for I . Industries supplied by Gaz du Sud Ouest suffered smaller
increases, from 59$ for I. to 49$ for I .
Tariff degression for Gaz de France customers has therefore not varied much over the two year period, e.g. in Paris -36 $ in I98O compared with -33$ in I982.
The modulation has a small influence on prices, i.e. prices are reduoed by around 2.5 when modulation increases from 200 to 250 days (I,) and by around 2 $ when it passes from 250 to 330 days (I.)·
A comparison between the Gross Domestic Product price index (GDP) and the selling prices of gas gives the following results:
GDP
price index Selling price - Paris
3-1
3-2
4-1
4-2
I98O I98I 1982
162.4
181.6 *
204.6 *
163.8 156.4
193.9 I86.4
253.O 248.3
170.3 I88.7 208.3 2IO.4 224.4
204.6 227.O 252.O 255.O 272.I
268.4 298.5 334.6 339.4 362.5
* estimated
29
3.ITALY
a) Situation in the gag industry
The structure of the gas industry, which has a considerable influence on price formation, has two levels :
- SNAM, a company of the ENI group, which has a virtual monopoly (about 98$) on the transport and wholesale distribution ot natural gas. In particular,.SKAM supplies gas to industries consuming over
1 000 000 m a year (i.e. approximately 38 Tj/year) and to the distribution companies (l).
- the gas distributors, whose function is to distribute gas to small consumers. They receive natural gas from SNAM and resell it either as it is or mixed with other gases. These distributors (l 335 local networks) are either municipal undertakings, concessionary companies or local authorities.
SNAM applies a standard national tariff. On the other hand, each
distributor issues its own tariffs according to a method introduced in 1975 and modified in I98O by the Interministerial Price Committee (CIP), which takes into account not only the costs of raw materials but also a series of other factors which vary from one local authority to
another. This leads to a profusion of tariffs, which would be impossible to describe in this study and which explains the differences in prices for small consumers from one location to another.
In I98I gas resources comprised 99$ natural gas (produced domestically or imported) and 1$ works gas (excluding coke-oven gas and
blast-furnace gas, which the works retain for their own use).
(l) Exceptionally, one or two large industrial consumers may be
ITALY
30
Katural gas sales are mad· up by the following:
SKAM direot sal··
Γ industries
i.e.
<
power stations
1 chemical synthesis
SHAM sales to distributors
.
Γ household uses
\
nonhousehold usee
Sales as motor fuel
%
57
(42)
!
V
( 8)
42
P«
1
Standard consumers
h
?ì
h
\
S
B
3
B4
In I98O the number of consumere was broken down as follows!
Supplied by SHAH
4 608
" industry
chemical synthesis
other
distribution companies
7
2 926
22
325
1 335
734 004
113 440
83 446
Supplied via distributors
7 930 890
household (l)
commerce
small industries
(l) Including collective heating
Over the past few years national production has maintained its share
of natural gas resources:
Imports
National production
Netherlands
URSS
Libya
I98O
47$
24$
24$
5$
1981
47$
26$
27$
3 1 ITALY
b) Taxes
This subject is dealt with in chapter 17.
c) Household prices tariffs
Each distribution undertaking calculates a basic price in accordance with a complex formula, laid down in law by the Interministerial Price Committee (for further details see CIP Regulations Κ·β 17 and 28/198O, I2/198I and 8/1982). The prices charged to consumers vary around this basic price, decreasing according to the ratio between fixed costs and commodity costs.
This leads to two part tariff formulae with:
a standing charge (which includes from now on the meter rental) a commodity rate (sometimes in block form).
For individual domestic consumers (D. D_ D,) the standing charge is LIT 6OO per month. For the other small consumers it depends on the number of "flames" which is determined freely by each distribution
company, within certain statutory limits. The "flames" represent the user's equipment and, therefore, consumption capacity. For these
consumers the standing charge is calculated on the basis of LIT 50 per month and per flame.
The prioe to the final consumer of natural gas is affected by SHAM's tariff for sales to distributors. The commodity rate in this tariff variée according to the selling prioe of heating oil (agreement of
5th October 1979(*), which provide« for LIT 0.53 per m3 to be passed on to the price of natural gas for each lira increase in the freeto coneumer price per kg of heating oil.
d) Household prices analysis
Tables 5 and 6 in the annex give the prices recorded. No prices are given for Genoa and Naples.
The differing tariff systems throughout the country have lead to
different trends in prices. In Turin price increases have been more or less uniform at around 47 $ for all standard consumers, over the two year period. In Milan, where manufactured gas is still distributed, the increases were lees, ranging from 29 $ to 39 $, with the larger
consumere bearing the larger increases. In Rome both natural gas and manufactured gas are distributed. Natural gas consumers suffered larger
increases (46 $ to 85 $) than consumers of manufactured gas
(37$ to 66$) but natural gas remains considerably cheaper, 20 $ lees than the prioe of manufactured gas for the small consumers D, and Dp, and 25 $ lees for the others. In Rome it is the small consumers who have borne the brunt of price increases, those using gas for heating got away more lightly.
ITALY
32
Because of this, tariff degression increased in Rome, and decreased in Turin and Milan.
The price differences noted between one location and another are largely due to the different types of gas, although differing overheads obviously play a role.
For the comparison with the Gross Domestic Product (GDP) price index, Rome natural gas prices have been used, these being in the middle of the price range.
1975 - 100
1980 1981 1982
* est
GDP prioe index
222.9 262.1 * 303.6 *
imated
D
l
287.4 499.7 532.0D
2
366.6 570.8 6I4.4Selling prices
D3 D3b
515.2 695.8 759.3
533.5 714.O 78O.2
Ι
553.9 755-4 827.2It can be clearly seen that gas prices have progressed at a rate far exceeding the general rate of inflation as represented by the GDP price index, making natural gas in Rome in real terms muoh more expansive than it was in 1975*
e) Industrial prices - tariffs
A distinction must be made between the two systems of gas supply!
1) Small industrial consumers (I, , 1.) who are supplied by the urban networks of the local distribution companies and for whom the tariffs differ from city to city. The tariffs are of the two part type, similar to those applied to households, with a standing
charge which depends on the number of flames (around 100 for I, and 5OO for I.) and a commodity rate, often in block form.
2) Other industrial consumers (I·,, I., I,-) who are supplied almost exclusively by SHAM, which applies a standardized national tariff.
33 ITALY
Consumption blook
4 1 000 000 m3/year
1 - 3 000 000 m3/year
3 - 25 000 000 m3/year
</ 25.000 000 m3/year
Price/ m
P. - 1.12 χ Ρ P2 - 1.10 χ Ρ
P3 - 1.06 χ Ρ
Ρ
where Ρ - 0.845 x 1.077 (07 PATZ + 0.3 P W Z + Τ) LIT/m3
(PATZ » the average ex-internal refinery prioe (AGIP list prices) of ordinary fuel oil during the preceding month, including fabrication tax and l/l2 of the basic short term interest rate.
PBTZ m idem for low sulphur fuel oil. Τ « 6 until 30th April I982.) 1 m3 - 38 100 kJ (OCT).
The value of Ρ calculated from this formula is subjeot to certain reductions, or discounts, as follows
4.70$ for the period 1.1.81 - 30.4.81 3.50$ for the period I.5.8I - 3I.8.8I 3.00$ for the period I.9.81 - 31.12.81 1.00% for the period 1.1.81 - 30.4.8I
The values of Ρ used to calculate the prices given in this study are:
I98I: Ρ . 175.67 1982: Ρ . 223-47
including the period reduction above.
On an experimental basis an annual "regularity" factor based on R is applied
k-«- D summer consumption
winter consumption '
summer being the six month from April to September.
The value of R varies between 0.75 to 1.
The regularity factor varies, linearly, from 0 $ for R - 0.75 to 6$ for R « l . This factor is applied only to consumption up to 12 million m per year.
ITALY M
The regularity factor was not applied to the standard consumers in this study.
For interruptibie supplies the prioe results from the formula
Ρ - PATZ χ 0.91
and had the values
Ρ - 172.97 in I98I Ρ - 213.15 in 1982
These tariff formulae do not apply to either supplies to power stations (EKEL tariff) or deliveries to local gas distribution undertakinge.
The prioe of gas for chemical synthesis (use for non-energy purposes) is aligned on that of the tariff for non-interruptible types of
industrial consumption, except for gas to be used in the manufacture of fertilizer for the domestio market, for which the price was fixed at LIT 78.5/e from June I98O (as against LIT 58.50 at the beginning of the same year).
f) Industrial prices - analysis
The results are given in tables 5 and 6 in the annex. The small
industrial consumers I, and I_ are supplied by the local distribution companies and prices vary as for households. In Rome and Turin prices for these consumers rose by around 60$ but in Milan by only 44$. For all locations there is very little difference in prioe between the two standard consumers, although I_ consumes ten times as much as I,.
For the larger consumers, supplied by SHAM, prices are uniform for the whole country. Between I98O and 1982 SKAM prices increased by between 87$ and 96$, the smaller consumers suffering greater prioe rises than the larger consumers. Load factor or modulation has no effect on prices.
Tariff degression has increased slightly, but is still low. In I98O when consumption increased one hundred fold from I to I,, the price reduction was 5$* This has now been increased to 9%.
35
ITALY1980 1981 1982
* estiai
GDP price index
222.9 262.1 * 303.6 *
at ed
Selling prices Rome
411.1 404.5 605.5 596.9 659-8 651.0
Selling prices
-Γ
3
h
4O3.6 4O7.8 620.2 6I4.4 789.O 78I.4 SHAM
Σ5
407.2 600.0 763 2
36
4· NETHERLANDS
a) Situation in the nas industry
The gas industry has three lévele : 1) natural gas production (NAM)
2) transporting, importing and selling to very large consumers connected to the main transmission grid (GASUNIE)
3) distribution (local societies or communal enterprises).
Direot sales by GASUNIE represent arount 41$ of the volume of gas sold (30$ of which goes to power stations), the remaining 59$ is supplied to the public via the distribution companies.
GASUNIE supplies 136 distribution companies, 29 power stations and 384 large industrial enterprises.
For the distribution companies the number of customers and gas sales may be broken down as follows :
- Small Consumers
s^21 GJ/year
i . e .
21-6000 GJ/year
reduoed t a r i f f s
(of whioh domestic
consumers)
- Large Consumers
( > 6 0 0 0 GJ/year)
TOTAL
Customers
1 000 η
4 578
596
3 979
3
(4 366)
12
4 597
Sales
$
66
1
64
1
(56)
Λ
100
Standard consumers
D
1
D2
D
3
D4
XX
h
-» Χ - -» -» 4
X
3
\ Η
Although the distribution system is decentralised, the tariff system is uniform (with reductions, however, in the areas close to the Groningen
gas fields) and prices indicated for Rotterdam are representative for the whole country.
^^
37
NETHERLANDSThese i m p o r t s from Norway reached : i n I98O - 133 000 TJ
i n I 9 8 I - 118 000 TJ j 9 * o f i n l a n d consumption.
b ) Taxes
Taxes are treated separately in chapter IV.
o) Household prices - tariffs
All small consumers (domestic, commercial, industrial, etc.) with an annual
consumption of up to 17O 000 m3 are charged according to a simple two-part
t a r i f f system, the rates of whioh are revised periodically. The general
tariff, whioh applies to standard consumers D., Dp and D,, i s as follows :
Bate
January 198I
January I982
Standing Charge HFL/year
48
48
Commodity Rate cents/m3
39.9
46.9
There i s also a tariff for collective central heating
(Blokverwarmings-t a r i e f ) , which applies (Blokverwarmings-to s(Blokverwarmings-tandard consumer D :
Date
January I98I
January 1982
Standing Charge HFL/year
15 n (minimum I80 HFL)
15 n (minimum I80 HFL)
Commodity Rate cents/m3
39.9
46.9
n m number o f appartments
NETHERLANDS 38
d) Household prices - analysis
The prices are given in table 7 in the annex.
Domestio gas prices in the Netherlands increased by between 36 $ and 60 $ during the period I980 to 1982, the major part of which occurred during 1980. The larger increases are borne by the larger standard oonsumers, resulting in a reduction in tariff degression. In faot, the reduotion in unit prioe ae consumption increases from 8.37 GJ per year to 1 047 OJ per year was - 29 $ in I982, compared with - 40 $ in I980.
A comparison between the selling prioe of gas and the Gross Domestic Product (GDP) prioe index gives the following results :
1975 - 100
1980 1981 1982
GDP prioe index
133.6 I4I.6 * I5O.4 *
\
I35.7 165.7 I85.O
D2
I32.I I69.O 192.6
S e l l i n g price
D3
175.7 237-4 277.I
V>
184.1 250.0 292.4
D
4
205.6 281.0 329.8
* estimated
It can be clearly seen that gas prices have risen by more than the price of goods and services in the Netherlands as represented by the GDP index, i.e. domestic gas is now more expensive in real terms.
e) Industrial prioes - tariffs
The tariff system introduced on 1 January I978 is still in force, with a number of minor changea. The tariff is based on blocke of consumption and indexed to fuel oil prices.
Blocks of annual consumption 0 - 170 000 m3
I70 0 0 0 - 1 million m3
1 - 1 0 " m3
I O - 5 O " m3
; > 50 " m3
Price in cents/m I98I and 1982 ■ household t a r i f f
2.8 + C 2.2 + C 1.4 + c 0.0 + c
39
NETHERLANDSC is the coefficient of adjustment which is linked to the price of fuel oil : τ,
C - 40 χ 500
Ρ is the average price per quarter of fuel oil with a viscocity greater than 65 Cst at 50° C and a net calorific value of 41*45 KJ/kg, for deliveries of at least 2 000 tonnes per quarter.
Ρ is calculated by the Central Statistical Office (CBS), and is published during the second month of the following quarter.
As from the first quarter of I98I gas prices are calculated on the basis of the average of the definite values of Ρ for the two previous quarters. All contracts are concluded on the basis of these tariff formulae, which result in a degressive price depending on the volume of consumption and do not include a component bas?d on the regularity of offtcie.
f)lndustrial prices - analysis
The prices are given in table 7 in the annex.
As taxes have not changed significantly during the period 1980 to I982 the evolution of prices before and after tax has been the same.
Prices for the smaller industrial consumers I. and Ip, developped along the lines of domestic prices (same tariff) with an overall rise of around 61 $, 38 $ of which was during I98O and 17 $ during I98I. For larger consumers I,, I and I , prices are linked to fuel oil prices and developped accordingly? The overall increases for these consumers were around 70 $ with slightly larger increases for January I982 than for January I98I. The I98I price would have been higher but for a rebate of 1 cent per m3f a result of market forces at that time.
Modulation (maximum daily offtake) does not affect prices.
A comparison between the selling price of gas and the GDP price index shows that gas prices to industry have increased by much more than prices for all goods and services. In fact, in real terms gas prices have doubled since 1975·
1980
1981
1982
GDP p r i c e index
133.6
I4I.6 *
150.4 *
h
198.6
272.2
319.5
S e l l
J2
204.6
281.9
331.1
ing price
I 9 6 0
252.9
340.1
1975 = 100
h
196.4
251.4
333.6
J
?
227.4
294.4
386.9
<>
40
BELGIUM
a) Situation in the gas industry
The general structure of the gas industry has two l e v e l s :
- Import, transmission, d e l i v e r i e s to general d i s t r i b u t i o n organizations and t o large industrial consumers ( > 33 500 GJ/year) by the company D i s t r i g a z ;
- general d i s t r i b u t i o n (households and non-domestic consumers up t o 33 500 GJ/year - and even up t o I40 700 GJ/year by agreement with D i s t r i g a z ) by municipal undertakings, e i t h e r i n d i v i d u a l l y or grouped together t o form a s s o c i a t i o n s , with or without the p a r t i c i p a t i o n of private companies, t o manage operations.
The breakdown of natural gas d e l i v e r i e s i s as f o l l o w s :
- DISTRIGAZ
Industry, firm and erasable supplies
Industry, interruptible supplies
Public power s t a t i o n s
- PUBLIC DISTRIBUTION Household uses (heating t a r i f f s ) (other t a r i f f s )
Non domestic uses
TOTAL
1979
62
34*5
12.8 I4.6
.28
26.7
(24.9) ( 1.8)
11.3
100
1980
58JB
34*0
13*3 11*5
£j£
28*5 (26.8)
( 1.7)
12.8
100
I98I
5¿2¿
34.8
10.2 10.3
44.7 30.5 (28.6)
( 1.9)
14.2
100
standard consumer
X
3
h h
D3D4 D1D2
Natural gas i s supplied from several Dutch and Norwegian f i e l d s . Imports intended for the belgian market are broken down as f o l l o w s :
41 BELGIUM
b ) Taxes
Taxes are treated separately in chapter IV.
c) Household prices-tariffs
Gas prices for deliveries to households vary according to two indices : Iga, whioh takes into account the frontier price of natural gas; and Igd which takes into account the average wages of workers in the private gas and electricity industry. The values of these indices are as follows:
January I98I January I982
Iga I.9796 3.2293
Igd I.O490 I.0947
The tariffs applicable in 198I and I982 are as follows:
Standard consumer
Dl D2
D3 D4
T a r i f f
A
B C
Standing charge BFR
35.2 x Igd/month
2718 χ Igd/year η χ 139 x I g d /
month
Commodity r a t e cent ime s/MJ - 1st block ( l )
B r u s s e l s / L i e g e / p \
5.9524 Iga + 24.5290 Igd Antwerp 5-9524 Iga + 23*0866 Igd - Remainder 5*9524 Iga + I6.407O Igd 5.9524 Iga + 7.267O Igd
5.9524 Iga + 4*3739 Igd
n ■ number of dwellings, minimum 10
(1) S i z e of f i r s t b l o c k : B r u s s e l s , Liège = 15 474 Mj/year Antwerp = 17 936 MJ/year
(2) Following a recommendation of the Gas and E l e c t r i c i t y Control Committee t h i s was reduced t o 23.0866 from l e t January I 9 8 2 .
BELGIUM
42
d) Household prices - analysis
Tables 8 and 9 in the annex contain the results.
Sinoe 1st January I982 tariffs have been the same for all three looations, the only difference being that in Antwerp the size of the first tariff block is larger than in Liège and Brussels, to compensate for the extra cost involved in reading gas meters at monthly intervale instead of annually. This leads to small price differences for
standard consumer D» only, differences of the order of 1 $.
Between 198O and I982 prices for domestic small consumers rose by around 40 $, whereas customers using gas for heating suffered much larger increases, of the order of 80 $ for D. and even 100 $ for D.. Part of these large increases is due to the increase in the rate of TAT, from 6 $ to 16 $ during 198O, and to 17 $ during I98I.
Tariff degression has decreased sharply; standard consumer D., who in I980 paid per unit only 36 $ of the price paid by D-, now pays just over half the price paid by D. per unit.
A comparison may be made between selling prioes and the Groes Domestic Product (GDP) price index.
1975 - 100
1980 1981 1982
• est
GDP price index
130.3 136.8 * 147.9 *
iaated
\
126.0 I49.7 I76.3
Selling price
D2 B3
127.6 152.5 181.8
I3O.O I72.3 234*2
- Brussels
B3*
I44.4 I93.2 265.3
D
4
167.0 231*8
333.7
Prices for the smaller consumers D. D^ and D~ were more or loss in line with inflation in I98O, but since then have risen by more than the general oost of living, making gas for theee small consumers more expensive in real terms in I982 than it was in 1975* For the larger consumers D~, and D. priese have risen much more sharply so that for