This article was downloaded by: [University of Strathclyde] On: 25 November 2011, At: 06:59
Publisher: Taylor & Francis
Informa Ltd Registered in England and Wales Registered Number: 1072954 Registered office: Mortimer House, 37-41 Mortimer Street, London W1T 3JH, UK
Production Planning & Control
Publication details, including instructions for authors and subscription information: http://www.tandfonline.com/loi/tppc20
Implementing the Lean Sigma framework in an Indian
SME: a case study
M. Kumar a , J. Antony b , R. K. Singh c , M. K. Tiwari d & D. Perry a a
Division of Management, Caledonian Business School, Glasgow Caledonian University, Cowcaddens, Glasgow G4 0JF, UK
b
Centre for Research in Six Sigma and Process Improvement (CRISSPI), Caledonian Business School, Glasgow Caledonian University, Cowcaddens, Glasgow G4 0BA, UK
c
Department of Production Engineering, Birla Institute of Technology, Mesra, Ranchi-835 215, India
d
Department of Forge Technology, National Institute of Foundry and Forge Technology, Ranchi-834 003, India
Available online: 21 Feb 2007
To cite this article: M. Kumar, J. Antony, R. K. Singh, M. K. Tiwari & D. Perry (2006): Implementing the Lean Sigma framework in an Indian SME: a case study, Production Planning & Control, 17:4, 407-423
To link to this article: http://dx.doi.org/10.1080/09537280500483350
PLEASE SCROLL DOWN FOR ARTICLE
Full terms and conditions of use: http://www.tandfonline.com/page/terms-and-conditions
This article may be used for research, teaching, and private study purposes. Any substantial or systematic reproduction, redistribution, reselling, loan, sub-licensing, systematic supply, or distribution in any form to anyone is expressly forbidden.
Implementing the Lean Sigma framework in an
Indian SME: a case study
M. KUMAR
y
, J. ANTONY*
z
, R. K. SINGH
x
, M. K. TIWARI
{
and D. PERRY
y
yDivision of Management, Caledonian Business School, Glasgow Caledonian University, Cowcaddens, Glasgow G4 0JF, UK
zCentre for Research in Six Sigma and Process Improvement (CRISSPI), Caledonian Business School, Glasgow Caledonian University, Cowcaddens, Glasgow G4 0BA, UK
xDepartment of Production Engineering, Birla Institute of Technology, Mesra, Ranchi-835 215, India {Department of Forge Technology, National Institute of Foundry and Forge Technology,
Ranchi-834 003, India
Lean and Six Sigma are two widely acknowledged business process improvement strategies available to organisations today for achieving dramatic results in cost, quality and time by focusing on process performance. Lately, Lean and Six Sigma practitioners are integrating the two strategies into a more powerful and effective hybrid, addressing many of the weaknesses and retaining most of the strengths of each strategy. Lean Sigma combines the variability reduction tools and techniques from Six Sigma with the waste and non-value added elimination tools and techniques from Lean Manufacturing, to generate savings to the bottom-line of an organisation. This paper proposes a Lean Sigma framework to reduce the defect occurring in the final product (automobile accessories) manufactured by a die-casting process. The proposed framework integrates Lean tools (current state map, 5S System, and Total Productive Maintenance (TPM)) within Six Sigma DMAIC methodology to enhance the bottom-line results and win customer loyalty. Implementation of the proposed framework shows dramatic improvement in the key metrics (defect per unit (DPU), process capability index, mean and standard deviation of casting density, yield, and overall equipment effectiveness (OEE)) and a substantial financial savings is generated by the organisation.
Keywords: Six Sigma; Lean; Case study; Framework; SME
1. Introduction
The last two decades has witnessed an increased pressure from customers and competitors for greater value from their purchase whether based on quality, faster delivery, or lower cost (or combination of both) in both manufacturing and service sector (Basu 2001, George 2002). This has encouraged many industries to adopt either Six Sigma (as their process improvement and problem solving approach) or Lean Manufacturing (for improving speed to respond to customer needs and overall cost) as part of management strategy to increase
the market share and maximise profit. All the large companies such as Toyota, Danaher Corporation, General Electric, Motorola, Honeywell, and many others, have achieved dramatic results by implementing either Lean or Six Sigma methodologies in their organisation (Womack and Jones 1996, Harry 1998,
Basu 2001, Murmanet al. 2002, Sharma 2003, Arnheiter
and Maleyeff 2005).
Shah and Ward (2003) accentuated the importance of plant size, plant age, and union status on the likelihood of implementing 22 manufacturing practices that are key facets of the Lean production system. The core thrust of Lean production is that it works synergistically to create a streamlined, high quality system that produces *Corresponding author. Email: [email protected]
Production Planning and Control
ISSN 0953–7287 print/ISSN 1366–5871 onlineß2006 Taylor & Francis http://www.tandf.co.uk/journals
DOI: 10.1080/09537280500483350
finished products at the pace of customer demand with little or no waste. Lean strategy brings a set of proven tools and techniques to reduce lead times, inventories, set up times, equipment downtime, scrap, rework and other wastes of the hidden factory.
The statistically based problem solving methodology of Six Sigma delivers data to drive solutions, delivering
dramatic bottom-line results. Linderman et al. (2003)
accentuated the importance of social and psychological considerations in understanding Six Sigma phenomena and how effective use of goals helps alter the behaviour of organised members and their perceptions about how much change is possible. Authors further emphasised on the understanding of the technical aspect as well as behavioural insight for successful deployment of Six Sigma. Sodhi and Sodhi (2005) illustrated how a global manufacturer of industrial equipment applied Six Sigma to its price setting process for one product line. In this study, Six Sigma has transformed the tenor of the relationship between the pricing and sales staffs from adversity to relative harmony for making joint decisions that are aligned with strategic objectives of the business. Each methodology proposes a set of attributes that are prerequisites for effective implementation of the respective program: top management commitment, cultural change in organisations, good communication down the hierarchy, new approaches to production and to servicing customers and a higher degree of training
and education of employees (Salzman et al. 2002,
Antonyet al. 2003).
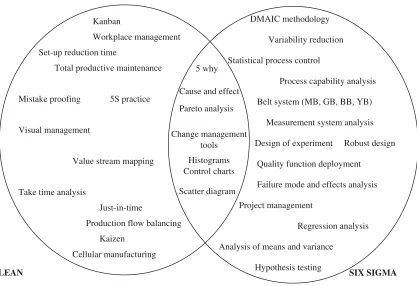
Companies across the spectrum have found the most effective way to eliminate the flaws that lead to rework and scrap, and create one unified idea of continuous improvement, is the integration of Lean Manufacturing and Six Sigma (Smith 2003). The integration of the two systems can achieve much better results than either system can achieve alone. While, Lean strategies play an important role in eliminating waste and non-value-added activities across the organisation, Six Sigma, through the use of statistical tools and techniques, takes an organisation to an improved level of process perfor-mance and capability. The two methodologies empha-sise the unfathomable involvement of top executives and communication with the bottom line to develop robust products and processes in their organisation.
Most companies using the integrated approach apply basic Lean tools and techniques at the beginning of their program, such as current state map, basic house keeping using 5S practice, standardised work, etc. After imple-menting the above tools and techniques some wastes are eliminated from the system. Now, the tools and techniques of Six Sigma are used to offer powerful solutions to chronic problems. The comprehensive set of tools, techniques and principles that can be employed in
the integrated approach of Lean and Six Sigma business strategies is delineated in figure 1. Figure 1 is based on the previous works of experts in Lean and Six Sigma (Womack and Jones 1996, James-Moore and Gibbons 1997, Hoerl 1998, Rother 1998, Breyfogle III 1999, Harry and Schroeder 1999, Emiliani 2000, Hines and
Taylore 2000, Pyzdek 2000, Antony et al. 2003, Snee
and Hoerl 2003). The use of the comprehensive set of tools mentioned above can help to reduce all kinds of waste (rework, over production, waiting, material, human skills, transportation and unnecessary
move-ment) from the organisation (Ohno 1988, Womacket al.
1990, Shingo 1992, Hines et al. 1998, Liker 1998).
This paper presents a case study undertaken by implementing a Lean Sigma framework into an Indian small- to medium-sized enterprise (SME) in order to reduce the defects which occur in the final product manufactured by the company and thus satisfy their customers. The company was regularly receiving com-plaints from its customers on crack propagation in the automobile accessories manufactured by the company. This was the major cause of customer dissatisfaction and was putting customer loyalty at risk. To retain its customers, the management realised the importance of removing operational inefficiencies and wastes from the organisation. The goal of the organisation was to reduce the defects in the product, work-in-process inventory, scrap and rework cost.
The rest of the paper is arranged as follows: Section 2 provides an insight into the die-casting process, the prob-lem encountered by the company and the rationale behind selecting Lean Sigma methodology to tackle the problem. The reasons for using Lean Sigma as a continuous improvement methodology for this case study is cited in section 3. Section 4 elucidates the steps involved in implementing the proposed framework to identify the root cause of the problem and propose corrective action to minimise the impact of the problem on customer satisfaction. The effectiveness of proposed Lean Sigma framework is discussed in section 5. Section 6 throws light on some of the difficulties encountered while implementing the proposed frame-work. The paper is concluded in section 7.
2. Company background
The die-casting unit under study was established in 1978 with 150 employees, which comes under the category of SME as per the classification given by Indian Trade Industry. The organisation is engaged in designing and manufacturing various types of precision machined components using pressure and gravity die-casting processes. The main customers of the company are
ordinance factories, the automobile industry, and textile machine manufacturers. The company manufactures around 250 000 units of die casting products per year to cater for the needs of its customers. The employees work in three shifts per day, each shift of 8 hours, and six days a week to meet the market demand.
The die-casting process starts with placing Al-alloy
(AlSi9Cu13) ingots in the furnace and heating them for a
sufficient duration. When the metal melts and achieves a suitable temperature in the casting furnace, it is inserted into the dies by plunger pressure. As the metal solidifies the cast product is taken out with the help of an ejector pin and placed in a trolley. The cast product then goes to the trimming and fettling shop where extra projections are removed. The trimmed product is moved to the drilling section (MC1) where the different holes and grooves are made as per the dimensions in the drawing. In the next step, semi-finished products go to the de-burring unit (MC2) where the external and internal holes are cleaned and burrs are removed. It is then moved to the chamfering and threading unit (MC3) where fine cutting at different angles along the surface and the making of external and internal threads are performed. Cleaning and polishing operations are per-formed subsequently in the next stage. Finally, the finished product is stored in the dispatch department
from where it is sent to the customer according to an agreed schedule. Customer orders are taken care of on the basis of first come first serve (FCFS). Quick turnaround orders (QTA) are taken care of by rescheduling the batch processing as decided by the production manager.
3. Rationale for implementing Lean Sigma
The application of different quality programmes to reduce the operational inefficiencies and wastes requires top management involvement and commitment in order to provide appropriate resources and training. The top level management in the SME were proponents of Lean and used to practice TPM, Kaisen, and 5S systems in the organisation. Management showed confidence at the beginning of the initiative and supported the quality and production managers with the variety of resources and training required for successful deployment of Lean principles. As a result, there was less work-in-process inventory with reduced scrap and rework cost.
Management interest in the quality initiatives under-taken started waning as the demand from its customers increased. The wish to maximise return on investment and the fear of not meeting the customer demand
Kanban
Workplace management Set-up reduction time
Total productive maintenance
Mistake proofing 5S practice
Visual management
Value stream mapping
Take time analysis
Just-in-time
Production flow balancing Kaizen
Cellular manufacturing
5 why Cause and effect Pareto analysis Change management
tools Histograms Control charts Scatter diagram
LEAN SIX SIGMA
DMAIC methodology Variability reduction Statistical process control
Process capability analysis Belt system (MB, GB, BB, YB)
Measurement system analysis Design of experiment Robust design
Quality function deployment Failure mode and effects analysis Project management
Regression analysis Analysis of means and variance
[image:4.609.95.512.69.355.2]Hypothesis testing
Figure 1. The tools and techniques of Lean and Six Sigma.
compelled the management to concentrate more on production than on quality of the product. This resulted in an increase in work-in-process inventory, scrap and rework cost, and more defects (external and internal casting defects like foliation, cracks, cold shut, pinhole porosity, etc.) in the final product. There were many hidden wastes embedded in the manufacturing process that were ignored by the company because their manufacturing capacity was higher than their produc-tion requirements. Problems were tackled by increasing the work-in-process inventory leading to higher inven-tory carrying cost. In the last six years, demand for their product became high due to globalisation and the boom in the automobile sector. In order to meet the customers’ demand, production of automobile accessories was given top priority, irrespective of the quality of product. The management was able to meet the customer demands by putting the quality of product at risk. This resulted in a number of customer complaints from different parts of the country.
This intimidating situation led management to ponder over redeploying the quality initiatives taken at the beginning. As most of the customer complaints were related to crack propagation in the final die-casting product (resulting in improper functioning of the automobile engine), management formed a team to identify the root cause of problems. Moreover, there was a constant increase in in-process inventory, machine downtime, idle time at different workstations, and there was also concern about the health and safety issues of the employees as the average number of accidents on the shop floor were increasing each year.
The management, after a thorough brainstorming session with the senior managers of different depart-ments, generated a list of 15 possible projects that could enhance customer satisfaction. Multi-voting was then used among its cross-functional team to narrow down the projects list to a smaller list of the top priorities or to a final selection. Multi-voting allows the item that is favoured by all, but not the top choice of any, to rise to the top (Tague 2004). In order to ensure greater decision-accuracy, the voting was done by weighting the relative importance of each choice. Further, the outcomes from the multi-voting was debated by team members to avoid errors from incorrect information or understanding about each project. One of the questions raised during brainstorming was related to the selection of a continuous improvement method from a range of existing quality improvement programmes. The team decided to implement the Lean Sigma methodology to eliminate defects, reduce variation and reduce inventory and overall complexity from the system. While Lean streamlines processes and eliminates waste (idle time,
machine downtime, in-process-inventory), reduces
overall complexity, and helps to uncover the value-added activities of a process, Six Sigma can solve complex cross functional problems where the root causes of a problem (in this case, crack propagation) are unknown and help to reduce undesirable variations in processes. The integration of two approaches elimi-nates the limitations of individual approach. The team members decided to adopt Six Sigma over TQM because of the following reasons:
. TQM focuses on long-term results and expected
pay-off is not well defined. Six Sigma creates a sense of urgency by emphasising rapid project completion within 6 months.
. Improvement results from TQM initiatives are
small and do not bring rapid changes. The die-casting company under investigation is an SME and cannot afford to visualise tangible benefits after a period of 1 year.
. TQM provides a vast set of tools and techniques
with no clear framework for using them effectively, whereas Six Sigma uses DMAIC methodology for problem solving which successfully integrates a set of tools and techniques in a disciplined fashion.
. TQM is motivated by quality idealism, whereas
Six Sigma is driven by tangible benefits for all major stakeholders (customers, shareholders, and employees).
It was decided that Lean would be used to create a foundation that allows the tools of Six Sigma to yield greater benefits, faster. Similar work was carried out
by Cua et al. (2001), who investigated the practice of
TQM and Lean simultaneously and the results revealed that that manufacturing performance is associated with the level of implementation of both socially-and technically-oriented practices of the aforementioned programs. After a number of discussion sessions a framework was developed between the team members and the facilitators, the latter being the authors of this article. The details of the framework are discussed in the next section.
4. Framework for Lean Sigma implementation: a case study
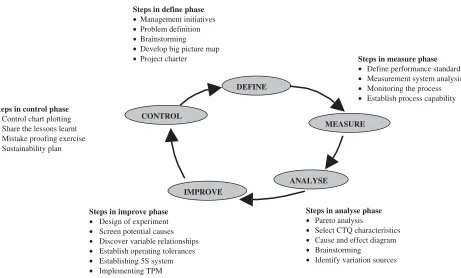
A model or framework is proposed by authors to implement Lean Sigma in the organisation and is delineated in figure 2. The framework is developed by authors after a number of meetings with top and middle level management. The facilitators meticulously studied the whole die-casting process, met up with the employ-ees working on the shop floor and enquired about the key parameters associated with each process,
scrupulously studied the documents of the production and quality departments to check on the defective products manufactured each day. This helped develop the Lean Sigma framework for implementation on the shop floor. In the proposed framework, Lean tools are used within the Six Sigma (DMAIC) problem-solving methodology to reduce the defects occurring in the final product.
4.1. Define
4.1.1. Management initiatives. An emergency meeting was called by top level management with operators, engineers and senior managers of different departments to discuss the restructuring required in the current practices for enhancing the market share and customer satisfaction. In order to instigate enthusiasm and motivation among employees for bringing about the required changes, senior management decided to com-municate not only the successes but also the problems encountered while implementing Lean Sigma frame-work. This helped in identifying the mistakes committed in other projects and learning from such mistakes. A cross-functional team was formed consisting of the operators, engineers from production, quality, and marketing department, and senior managers. This team
spent many hours on the shop floor observing, in order to collect data and understand the different processes associated with the die-casting unit.
4.1.2. Problem definition. A number of brainstorming sessions of team members were conducted to identify critical to quality (CTQ) characteristics based on the voice of customer (VOC) input. In the meeting the problem of the die-casting unit, the size of the problem, the impact of the problem, etc., were discussed among the team members and it was apparent that most of the customer complaints related to crack propagation in the automobile accessories manufactured by the company. The goal of the team members was to identify the root cause of problem and reduce the defects occur in the product.
4.1.3. Current state map. In order to have an insight into the current state of the die-casting unit, a current state map is developed which gives a closer look at the process so that opportunities for improvement can be identified. The movement of materials through different processes/facilities during manufacturing is shown in the current state map (figure 3).
As shown in the current state map, the manufacturing process starts with die casting and extends all the way through to shipping. Below each process, process cycle
DEFINE
IMPROVE
ANALYSE
MEASURE CONTROL
Steps in define phase
•Management initiatives •Problem definition •Brainstorming •Develop big picture map
•Project charter Steps in measure phase
• Define performance standards • Measurement system analysis • Monitoring the process • Establish process capability
Steps in analyse phase
• Pareto analysis
• Select CTQ characteristics • Cause and effect diagram • Brainstorming
• Identify variation sources
Steps in improve phase
• Design of experiment • Screen potential causes • Discover variable relationships • Establish operating tolerances • Establishing 5S system • Implementing TPM
Steps in control phase
[image:6.609.74.535.69.347.2]• Control chart plotting • Share the lessons learnt • Mistake proofing exercise • Sustainability plan
Figure 2. Proposed framework for Lean Sigma implementation in the organisation.
STORE
DIE
CASTING
FETLING/ Trimming
press
Drilling unit
De-burring
unit
Chamfering
and
threading
unit
POLISH-ING/
cleaning
DISPATCH
CT = 32 sec
CT = 11 sec
CT= 14 sec
CT = 17 sec
CT = 14 sec
CT = 13 sec
C/O = 20
C/O = 20m
C/O = 4 min
C/O = 6 min
C/O = 6 min
C/O = 6 m
U/T = 90%
U/T = 85%
U/T= 85%
U/T = 85
U/T = 90%
U/T = 90%
NO. OF
SHIFTS = 3
NO. OF
SHIFTS = 3
NO. OF
NO. OF
NO. OF
SHIFTS = 3
NO. OF
SHIFTS = 2
DEFECT =
5%
DEFECT =
DEFECT =
2%
DEFECT =
DEFECT =
1%
DEFECT =
0.2%
2.36 days
1 day
0.5 day
1 day
0.5 day
0.4 day
7 days
32 sec
11 sec
14 sec
17 sec
14 sec
13 sec
Al manufacturer
Ingot
One month
3 month forecast Monthly order Production control
Customer
250 000 pieces/year
Tray of 14
Forecast
Weekly schedule
Shipping schedule
Weekly/ monthly
Monthly
1.3%
SHIFTS = 3
SHIFTS = 3
0.5%
Figure
3.
Current
state
map.
Lead
time
¼
5.76
days,
Value
added
time
¼
101
sec.
time (CT), machine uptime (U/T), the number of shifts, the changeover time (C/O), and the percentage defect are listed. It should be noted that data are collected based on interactions with the workers at different work stations. During the development of these state maps it was found that the defect rate was high and was unacceptable.
4.2. Measure phase
The team was divided into small groups to monitor the defects occurring in each process involved in the manufacturing of die-casting product. The team had been collecting data of defective products for the last 2 years and had identified the critical processes where maximum defects were occurring, but no action was taken. In order to validate the historic data, the team members decided to collect the data of defective product for the following 6 days of production from their respective work stations. The collected data was ana-lysed and it was found to match with the historic data, showing that the maximum numbers of defects were coming from the die-casting machine, de-burring oper-ation (MC2), and chamfering and threading operoper-ation (MC3).
The next step was to determine a performance standard based on customer requirements. A data collection plan was established to focus on the project output and also to carry out the standard setting exercise for the same. A Gauge repeatability and reproducibility (R&R) study was conducted to identify the sources of variation in the measurement system and to determine whether it was accurate or not. A study was performed to check the accuracy of gauges used for the measurement of characteristics as well as the reproducibility of the worker in performing operations on the machine. The Gauge R&R study performed on the system showed a variation of 8.01%, which implied that the measurement system was acceptable. Using high performance and accurate equipment, we were able to secure the correct measurements of the die-casting parameter values and react in time for the necessary corrective actions for the experimental procedure. What the customers want is a sound casting with measurable characteristics, such as the density of the casting. Therefore the ultimate goal of the team was to increase casting density.
The company was operating at a baseline capability of 0.12 with defects per unit (DPU) being 0.18. The desired specification limit of casting density was 2.73–2.78 g/cc and the casting produced before the implementation of Lean Sigma had an average density of 2.45 g/cc.
4.3. Analyse phase
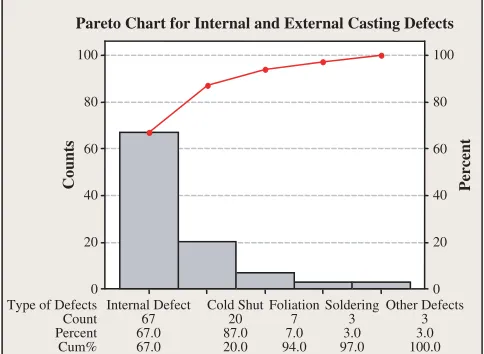
The objective of the team members was to determine the root causes of defects and identify the significant process parameters causing the defect. Out of six casting defects, air inclusion, shrink holes, and gas holes porosity are internal defects whereas cold shut, foliations, and soldering are surface defects. The internal defects are formed during the casting process as the metal solidifies. The micro holes created inside the casting are due to air or gas entrapment and result in crack propagation due to differential pressure and force created inside the casting. This crack propagation impedes the proper functioning of the final product and thus is very significant to overall performance of the machinery where die-casting parts are fitted. The Pareto chart shown in figure 4 illustrates the percentage contribution of internal and external defects in the process. It can be concluded from table 1 and figure 4 that internal defects are the result of poor casting density and amounts to 67% of total defects in the process. Other defects occur in the de-burring, chamfering and threading operations due to tooling and clamping problems.
All the defects mentioned above decrease the sound-ness of the casting, i.e. decrease the density of the casting. After conducting several brainstorming ses-sions, the team members concluded that the density of the casting is the most important critical quality characteristic in the die-casting process as it was related to many internal defects (air entrapment, gas holes porosity, shrink holes, etc.). The objective of the die-casting process was to achieve ‘better die-casting density’ while minimising the effect of uncontrollable param-eters. To have a clear picture of the process parameters
Counts Percent
Type of Defects Count Percent Cum%
Other Defects 3 3.0 100.0 Soldering
3 3.0 97.0 Cold Shut
20 87.0 20.0 Internal Defect
67 67.0 67.0 100
80
60
40
20
0
100
80
60
40
20
0
Pareto Chart for Internal and External Casting Defects
[image:8.609.316.558.509.686.2]Foliation 7 7.0 94.0
Figure 4. Pareto chart for the internal and external casting defects.
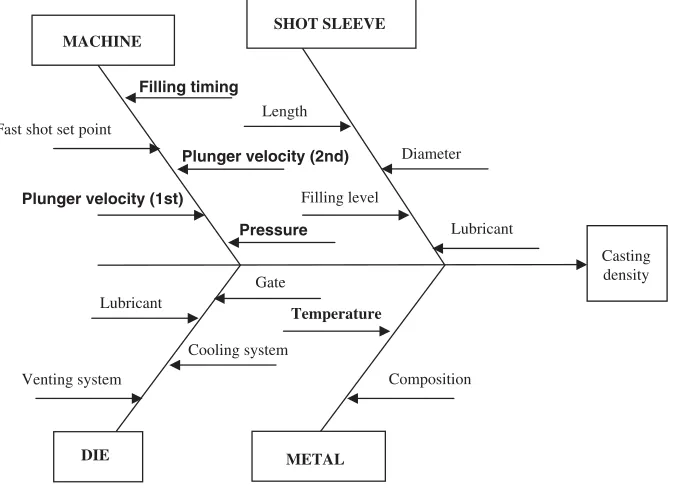
affecting the density of casting, a ‘cause and effect’ diagram was constructed and is shown in figure 5.
The cause and effect diagram shows that the most important process parameters that affect the casting density are: piston velocity at first stage, piston velocity at second stage, metal temperature, filling time and hydraulic pressure. From experience, it was revealed that non-linear behaviour of the parameters of the die-casting process can only be determined if more than two levels are used. The parameters along with their settings are given in table 2.
At this stage, it was essential to identify significant parameters so that they are tuned properly to achieve the desired range of casting density.
4.4. Improve phase
[image:9.609.51.558.84.251.2]4.4.1. Design of experiment. In the improve phase, the team decided to carry out a designed experiment to identify the significant process parameters affecting the casting density. The most appropriate orthogonal array Table 1. Classification of defects and their contribution to total defect.
Total defects from 5/01/04–10/01/04
De-burring unit—195 Chamfering and threading unit—81
Casting—177 (all casting defects) Casting defects—160 Other defects—35 Casting defects—65 Other defects—16
Defects due to poor casting—402 (out of 523)
Internal defect External defect
Air inclusion 50 Cold shut 10
Shrink holes 80 Foliations 20
Gas holes 130 Soldering 12
Porosity 90 Other defect 10
Total 350 52
Percentage of internal defect—67% of total defect
MACHINE
SHOT SLEEVE
DIE METAL
Fast shot set point
Plunger velocity (1st) Filling timing
Plunger velocity (2nd)
Lubricant
Venting system
Gate
Cooling system
Temperature
Composition Lubricant Diameter Length
Filling level
[image:9.609.138.475.290.535.2]Casting density Pressure
Figure 5. Cause and effect diagram.
(OA) design to meet the experimental requirement
is a 27-trial experiment (L27 OA) and the
exper-imental layout is depicted in table 3. The company was initially operating with the following settings:
A1, B1, C1, D2, E3.
The casting density is a ‘larger the better’ type of quality characteristic. Thus, the S/N ratio used is given by:
S=N ratio¼ 10 log 1
n Xn
i¼1
1 y2
i
" #
ð1Þ
whereyiis the casting density for a trial condition. Each
trail condition was repeated three times (i.e. n¼3).
The S/N ratios are computed for each of the 27
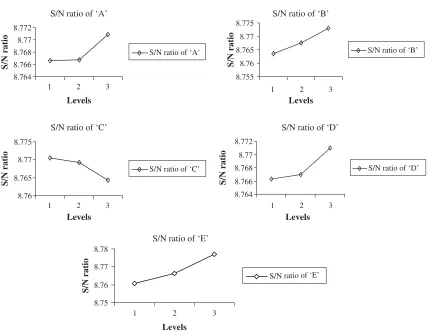
trial conditions. The average values of the S/N ratios for each parameter at different levels for all the trials are listed in table 4 and plotted in figure 6. The influence of interactions on the casting density was negligible based on the analysis and was thus omitted from the table and figure.
[image:10.609.85.523.85.163.2]From figure 6, it is clear that casting density is at maximum when the process parameters A, B, D and E are kept at level 3 and parameter C at level 1. Once the optimum settings of process parameters were identified, the team members decided to implement 5S system and total productive maintenance (TPM) to establish a clean environment within the shop floor and also to reduce the idle time of machine and employees on the shop floor.
Table 2. Process parameters with their ranges and values at three levels.
Parameter destination Process parameters Range Level 1 Level 2 Level 3
A Metal temperature (C) 610–730 610 670 730
B Piston velocity 1st stage (m/s) 0.02–0.34 0.02 0.18 0.34
C Piston velocity 2nd stage (m/s) 1.2–3.8 1.2 2.5 3.8
D Filling time (ms) 40–130 40 85 130
E Hydraulic pressure (bar) 120–280 120 200 280
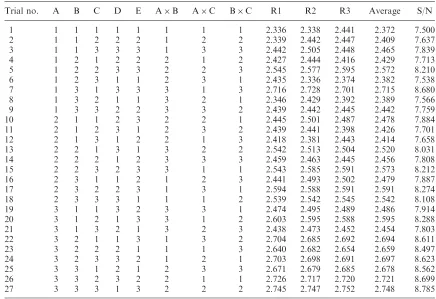
Table 3. Results of L27OA.
Trial no. A B C D E AB AC BC R1 R2 R3 Average S/N
1 1 1 1 1 1 1 1 1 2.336 2.338 2.441 2.372 7.500
2 1 1 2 2 2 1 2 2 2.339 2.442 2.447 2.409 7.637
3 1 1 3 3 3 1 3 3 2.442 2.505 2.448 2.465 7.839
4 1 2 1 2 2 2 1 2 2.427 2.444 2.416 2.429 7.713
5 1 2 2 3 3 2 2 3 2.545 2.577 2.595 2.572 8.210
6 1 2 3 1 1 2 3 1 2.435 2.336 2.374 2.382 7.538
7 1 3 1 3 3 3 1 3 2.716 2.728 2.701 2.715 8.680
8 1 3 2 1 1 3 2 1 2.346 2.429 2.392 2.389 7.566
9 1 3 3 2 2 3 3 2 2.439 2.442 2.445 2.442 7.759
10 2 1 1 2 3 2 2 1 2.445 2.501 2.487 2.478 7.884
11 2 1 2 3 1 2 3 2 2.439 2.441 2.398 2.426 7.701
12 2 1 3 1 2 2 1 3 2.418 2.381 2.443 2.414 7.658
13 2 2 1 3 1 3 2 2 2.542 2.513 2.504 2.520 8.031
14 2 2 2 1 2 3 3 3 2.459 2.463 2.445 2.456 7.808
15 2 2 3 2 3 3 1 1 2.543 2.585 2.591 2.573 8.212
16 2 3 1 1 2 1 2 3 2.441 2.493 2.502 2.479 7.887
17 2 3 2 2 3 1 3 1 2.594 2.588 2.591 2.591 8.274
18 2 3 3 3 1 1 1 2 2.539 2.542 2.545 2.542 8.108
19 3 1 1 3 2 3 3 1 2.474 2.495 2.489 2.486 7.914
20 3 1 2 1 3 3 1 2 2.603 2.595 2.588 2.595 8.288
21 3 1 3 2 1 3 2 3 2.438 2.473 2.452 2.454 7.803
22 3 2 1 1 3 1 3 2 2.704 2.685 2.692 2.694 8.611
23 3 2 2 2 1 1 1 3 2.640 2.682 2.654 2.659 8.497
24 3 2 3 3 2 1 2 1 2.703 2.698 2.691 2.697 8.623
25 3 3 1 2 1 2 3 3 2.671 2.679 2.685 2.678 8.562
26 3 3 2 3 2 2 1 1 2.726 2.717 2.720 2.721 8.699
27 3 3 3 1 3 2 2 2 2.745 2.747 2.752 2.748 8.785
[image:10.609.85.521.209.508.2]4.4.2. Confirmatory test. In order to validate the results obtained from the improve phase, a confirmatory experiment was performed using the optimal setting of process parameters A, B, D and E at level 3 and C at level 1. The average value of casting density was computed as 2.75 g/cc. This resulted in an increase of casting density by over 12%. In order to check that the results were valid and sound, it was decided to observe the value of casting density for the next three days of production.
4.4.3. 5S system. 5S was developed by Toyota to
eliminate the hidden factory waste by describing a set
of actions to maintain an organised work place (Monden 1998). The following are the Japanese words
that describe those actions—Seiri (sort), Seiton (set in
order), Seiso (shine), Seiketsu (standardise), Shitsuka
[image:11.609.126.486.87.143.2](sustain) (Mastroianni and Abdelhamid 2003). Top level management decided to implement the 5S system in order to establish a standard approach to housekeeping within the organisation and help reduce the non-value-added time for employees (Dale 1994, Womack and Jones 1996). Moreover, there was also concern about the health and safety issues of the employees as the average number of accidents on the shop floor were increasing per year. The 5S training pillars were Table 4. The average values of S/N ratios for each process parameter at different levels.
Factor A B C D E
Level 1 7.827 7.803 8.087 7.960 7.923
Level 2 7.951 8.138 8.076 8.038 7.966
Level 3 8.420 8.258 8.036 8.201 8.309
S/N ratio of ‘A’
8.764 8.766 8.768 8.77 8.772
1 2 3
1 2 3 1 2 3
1 2 3
1 2 3
S/N ratio
S/N ratio of ‘A’
8.755 8.76 8.765 8.77 8.775
S/N ratio
S/N ratio of ‘B’
8.76 8.765 8.77 8.775
S/N ratio
S/N ratio of ‘C’
8.764 8.766 8.768 8.77 8.772
S/N ratio
S/N ratio of ‘D’
8.75 8.76 8.77 8.78
S/N ratio
S/N ratio of ‘E’ Levels
S/N ratio of ‘C’
Levels
S/N ratio of ‘E’
Levels
Levels
S/N ratio of ‘D’
Levels
S/N ratio of ‘B’
Figure 6. Average value of S/N ratio for the five parameters at three levels.
[image:11.609.91.520.179.513.2]implemented on the shop floor which helped the organisation in the following ways:
. A day to day floor cleaning programme was
initiated and it was ensured that the employees had sufficient lighting on the shop floor to work in the afternoon and night shifts.
. In order to minimise the idle time at each process,
operators were provided with a rack to place the items correctly in the respective block provided in the rack.
. The trimming unit was moved nearer to the
die-casting machine so that time was saved in trans-portation from die-casting machine to trimming press.
. The cleaning of dust particles, grease, and oil from
the machines to ensure the health and safety of employees.
The implementation of the 5S System helped to organise the work environment, standardise the work flow and assign clear ownership of processes to employ-ees. It also helped in increasing the productivity by reducing idle time of some processes.
4.4.4. Total productive maintenance (TPM). A TPM programme was introduced to the organisation in the late 1990s and was a complete fiasco due to lip service provided by management without showing any interest in actual implementation of programme. TPM was only used for documentation purposes and for attracting customers. Tough competition within the market place forced the management to rethink on proper implemen-tation of the TPM programme within the Lean Sigma framework to markedly increase production and, at the same time, increase employee morale and job satisfac-tion. There was a constant increase in in-process-inventory, machine downtime and idle time at work stations which was easily be tackled by proper imple-mentation of TPM programme (Dale 1994, Womack and Jones 1996).
The steps taken by management to facilitate effective implementation of TPM are listed below.
. Periodic maintenance of machines, i.e. cleaning,
lubrication, inspection, and corrective action on all machines on the shop floor.
. Collection and analysis of data on downtime of
machine and remedial action to increase the overall equipment effectiveness (OEE) and thus the overall plant efficiency (OPE).
. Creating an equipment improvement team and
TPM area co-ordinators to monitor the proper implementation of the programme.
. Involving employees at all levels of organisation
to achieve zero defects, zero breakdown, and zero accidents in all functional areas of the organisation.
. Accentuating the training programme for effective
implementation of programme.
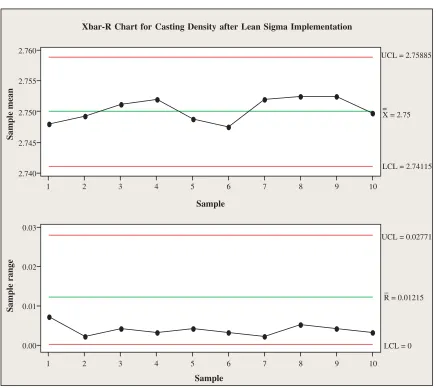
4.5. Control phase
4.5.1. Sustainability. The main purpose of the Six Sigma methodology is not only improving the process performance but also having the improved results sustained in the long run. Hence, the standardisation of the optimal process parameters setting is required. From time to time, control charts are plotted, as shown in figure 7, to check that the product is meeting the desired specification. The die-casting process has been improved by optimising the critical process parameters
A, B, C, D and E to around 730C, 0.34 m/sec,
1.2 m/sec, 130 ms, and 280 bar respectively. For measur-ing accurate values of above process parameters, differ-ent sensors (pressure sensors, temperature sensors, and position and velocity sensors) are used. The implemen-tation of the aforementioned suggestions resulted in enhanced profitability of the organisation.
4.5.2. Mistake proofing exercise. A mistake is a devi-ation from an intended target. Human error,
malfunc-tioning of machines, or improper environmental
conditions are examples of mistakes that can lead to a defect. A mistake may consist of performing a prohib-ited action, not performing a required action, or performing a required action incorrectly (Dale 1994). A mistake proofing exercise was performed to reduce the number of defects occurring in the process.
Management decided to accentuate the following points in order to prevent the occurrence of other defects at different stages of production:
. Checking the defects at the preliminary design
phase so that defects are not passed to the production stage.
. Failure mode and effect analysis (FMEA), in-house
scrap and rework data, inspection data, and analysis of customer complaints were used to pinpoint potential problems that could be resolved by mistake proofing.
. Cross-functional teams were formed to discuss the
manufacturing and design problems that are likely to cause mistakes/defects/failures.
. Sharing of information related to company
perfor-mance with its employees.
. Training people on the shop-floor regarding details
of production and quality issues as well as other
activities such as problem solving and team building.
. Use of control charts and graphs at each processing
stage to keep the employees aware of the real time performance at the respective stages of production.
. To motivate and recognise employees
contribu-tion in establishing best practices within the organisation.
. To reward and recognise the employees involved in
the project.
5. Effectiveness of the proposed Lean Sigma framework
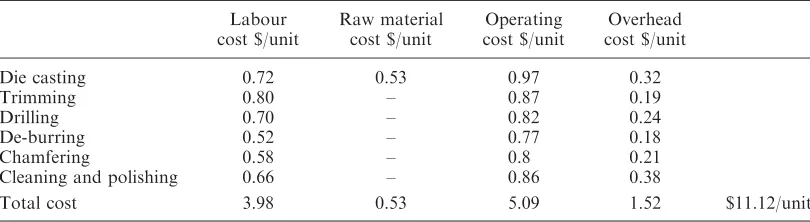
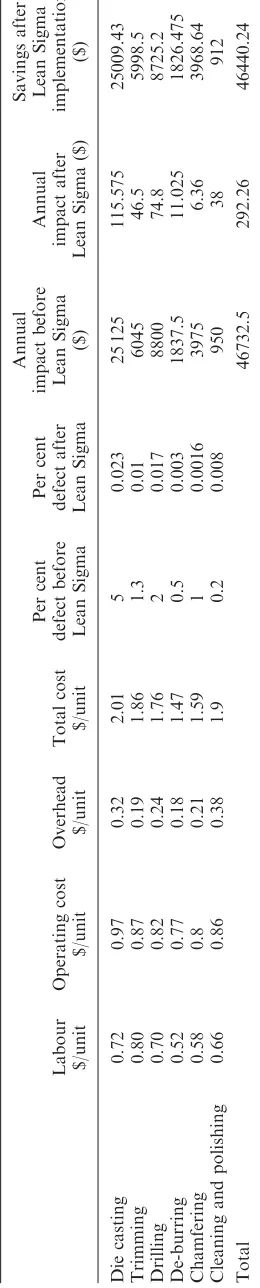
The team evaluated the financial benefits generated by sustaining the Lean Sigma project. The cost incurred by the company in manufacturing die-cast products was divided into four categories: labour cost, raw material cost, operating expenses, and other overhead costs.
All these costs were incurred in the manufacture of the product and it passing through various processing stages. A break up of all these costs in manufacturing a single unit that passes through six sections is listed in table 5.
Some value is added at every stage of production as the raw material is processed through various machines. Therefore, the occurrence of a defect at any stage of production must be considered a loss to the organisa-tion. The implementation of the Lean Sigma framework resulted in a colossal reduction in defects occurring at each stage of production. Table 6 gives the details of savings generated by the organisation when the defect is detected at a particular stage.
It is shown in table 6 that the number of defects as a percentage coming in each stage has decreased consid-erably. The savings generated due to reduction in defects was estimated around $46 500 per year.
Sample mean
10 9
8 7
6 5
4 3
2 1
2.760
2.755
2.750
2.745
2.740
10 9
8 7
6 5
4 3
2 1
0.03
0.02
0.01
0.00
_
R = 0.01215 UCL = 0.02771
LCL = 0 Xbar-R Chart for Casting Density after Lean Sigma Implementation
Sample
UCL = 2.75885
X = 2.75 =
LCL = 2.74115
Sample range
[image:13.609.88.524.65.453.2]Sample
Figure 7. Control chart for casting density after implementing Lean Sigma strategy.
The implementation of Lean Sigma framework also helped in:
. reducing the machine downtime;
. establishing a standard housekeeping procedure;
. increasing the confidence level among employees;
. instigating a sense of ownership among employees
for their work;
. enhancing OPE and OEE;
. rectifying the customer complaints;
. reducing inventory;
. reducing machine set up time;
. reducing the number of accidents at workplace.
The savings generated by the organisation by achiev-ing improvements in aforementioned areas are as follows:
. The decrease in machine downtime from 1% to 6%
helped in increasing the OPE and OEE. This resulted in estimated savings of over $40 000 per year.
. Work in process inventory reduced by over 25%
and resulted in estimated savings of over $33 000 per year.
. Standard housekeeping procedures helped to
reduce the number of accidents at work
place significantly. This reduced the amount of compensation the management needed to pay to injured employees (around $20 000 on average per year).
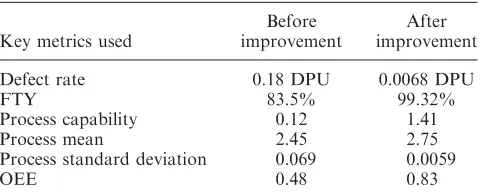
Thus, there was an improvement of around $140 000 per year in monetary terms for the company after implementation of the Lean Sigma strategy. Table 7 presents the significant improvements in the key perfor-mance metrics after implementation of Lean Sigma methodology. The key metrics used for comparing the results after implementing the Lean Sigma framework included: Defect per unit (DPU), process capability
index (Cp), mean and standard deviation of casting
density, first time yield (FTY), and OEE.
The following equations are used to calculate the defect per unit (DPU), FTY, and OEE:
DPU¼ Number of defects found
Number of units processed ð2Þ
FTY¼eDPU ð3Þ
OEE¼AEQ ð4Þ
where A stands for availability of machine; E connotes performance rate; and Q symbolises the quality rate (percentage of good parts produced out of total production) or yield of die-casting product.
It can be inferred from the table that there was significant improvement in the key performance metrics achieved by the company. This motivated the manage-ment for horizontal deploymanage-ment of the Lean Sigma approach in other areas of the organisation such as transactional processes, service-related processes, etc., and to share the benefits generated with its employees.
6. Difficulties encountered in implementing the Lean Sigma framework
For any continuous improvement programme, it is important to discuss the difficulties encountered while implementing the programme. It provides valuable lessons learned from previous projects that should be taken care of while starting the new project. In this case, convincing top management was the most arduous task as management was not ready to compromise on production to improve the quality of the final product manufactured. The top management people felt that investing in quality means increasing the cost of production, which they cannot afford to do when faced with stiff challenges from its competitors. The management teams were convinced by citing examples of some Indian companies that have reduced their
[image:14.609.102.507.85.196.2]production cost significantly and enhanced their
Table 5. Total cost incurred in manufacturing a unit product.
Labour cost $/unit
Raw material cost $/unit
Operating cost $/unit
Overhead cost $/unit
Die casting 0.72 0.53 0.97 0.32
Trimming 0.80 – 0.87 0.19
Drilling 0.70 – 0.82 0.24
De-burring 0.52 – 0.77 0.18
Chamfering 0.58 – 0.8 0.21
Cleaning and polishing 0.66 – 0.86 0.38
Total cost 3.98 0.53 5.09 1.52 $11.12/unit
Table
6.
Break
up
of
cost
saving
at
each
stage
of
production.
Labour $/unit
Operating
cost
$/unit
Overhead $/unit
Total
cost
$/unit
Per
cent
defect
before
Lean
Sigma
Per
cent
defect
after
Lean
Sigma
Annual
impact
before
Lean
Sigma
($)
Annual
impact
after
Lean
Sigma
($)
Savings
after
Lean
Sigma
implementation
($)
Die
casting
0.72
0.97
0.32
2.01
5
0.023
25
125
115.575
25009.43
Trimming
0.80
0.87
0.19
1.86
1.3
0.01
6045
46.5
5998.5
Drilling
0.70
0.82
0.24
1.76
2
0.017
8800
74.8
8725.2
De-burring
0.52
0.77
0.18
1.47
0.5
0.003
1837.5
11.025
1826.475
Chamfering
0.58
0.8
0.21
1.59
1
0.0016
3975
6.36
3968.64
Cleaning
and
polishing
0.66
0.86
0.38
1.9
0.2
0.008
950
38
912
Total
46732.5
292.26
46440.24
[image:15.609.244.374.75.719.2]bottom-line results using the application of Lean and Six Sigma principles.
It is quite natural to encounter resistance from employees if you try to introduce and implement some new business strategies in any organisation. The employees of the organisation under observation thought that implementation of the new strategies could endanger their job opportunities and poor per-formance result in them losing their jobs. This attitude was corrected by top management, convincing the employees that their jobs would not be in danger and that they would be rewarded for better performance. This gradually boosted confidence in the employees and eventually they were ready to embrace the proposed framework in their processes.
Moreover, resistance from management was also noticed when the team had decided to implement the 5S system in the organisation in order to ensure proper housekeeping and to reduce accidents in the factory by ensuring a safer environment. The management thought that ergonomics would have no impact on the perfor-mance of the employee and, ultimately, production. The management teams were convinced by showing them the savings that can be generated if accidents are avoided ‘right first time’ (RFT) and how proper housekeeping can reduce the idle time of the operator and machine. These were some of the difficulties encountered by the Lean Sigma team while implementing the proposed framework.
7. Conclusion
The following conclusions are drawn from this case study:
1. The implementation of Lean Sigma framework provided an impetus for establishing best practice within the company. Moreover, it also provided the company with a performance benchmark on
which they could base future performance
enhancement programmes.
2. The optimal settings of the process parameters have improved the casting density of the die-casting process by over 12%.
3. A significant improvement was observed in the key performance metrics (e.g. DPU, process capability, first time yield, etc.) after implementation of the Lean Sigma strategy.
4. The implementation of the Lean Sigma strategy has resulted in savings of around $140 000 per year.
5. Successful implementation of the proposed inte-grated framework of Lean and Six Sigma provided an impetus for bringing a cultural change in the company with systematic implementation of the integrated approach throughout the organisation. The proposed framework for Lean Sigma implemen-tation needs to be validated in different scenarios for establishing its validity. This can be considered as one of the limitations of the proposed framework. Moreover, in general there is no standard framework for Lean Sigma implementation. In addition to this, there is no clear understanding on the usage of tools and techniques within the Lean Sigma framework. This is perhaps an area of future research for the authors. It has also been observed by the authors that there is no clear guidance within the framework as to which strategy (Lean or Six Sigma or Lean Sigma) should be selected at the early stages of a project. Further research is also required in identifying the critical success factors (CSFs) of Lean Sigma. The authors are extending and improving the proposed framework by implementing the framework in different manufacturing industries in India. More new tools and techniques will also be added to the existing framework as part of further research into the area of study.
References
Antony, J., Escamilla, J.L. and Caine, P., Lean Sigma.
Manufacturing Engineer, 2003,82(2), 40–43.
Arnheiter, E.D. and Maleyeff, J., The integration of Lean management and Six Sigma. The TQM Magazine, 2005, 17(1), 5–18.
Basu, R., Six Sigma to fit Sigma.IIE Solutions, 2001,33(7), 28–33.
Breyfogle III, F.W., Implementing Six Sigma: Smarter Solutions Using Statistical Methods, 1999 (John Wiley & Sons: New York, NY).
[image:16.609.54.294.94.192.2]Cua, K.O., McKone, K.E. and Schroeder, R.G., Relationship between the implementation of TQM, JIT, and TPM and manufacturing performance. J. Op. Manage., 2001, 19(6), 675–694.
Table 7. Comparison before and after improvement based on key metrics.
Key metrics used
Before improvement
After improvement
Defect rate 0.18 DPU 0.0068 DPU
FTY 83.5% 99.32%
Process capability 0.12 1.41
Process mean 2.45 2.75
Process standard deviation 0.069 0.0059
OEE 0.48 0.83
Dale, B.,Managing Quality, 1994 (Prentice Hall International (UK) Limited: London).
Emiliani, M.L., Cracking the code of business.Manage. Dec., 2000,38(2), 60–79.
George, M., Lean Six Sigma: Combining Six Sigma Quality with Lean Speed, 2002 (McGraw-Hill: New York, NY). Harry, M. and Schroeder, R.,Six Sigma—The Breakthrough
Management Strategy Revolutionising the World’s Top Corporations, 1999 (Doubleday: New York, NY).
Harry, M.J., Six Sigma: a breakthrough strategy for prof-itability.Quality Progress, 1998,31(5), 60–64.
Hines, P. and Taylore, D., Going Lean, 2000 (Lean Enterprise Research Centre, Cardiff Business School: Cardiff, Wales, UK).
Hines, P., Rich, N., Bicheno, J., Brunt, D., Taylore, D., Utterworth, C. and Sullivan, J., Value stream management.
Int. J. Logist. Manage., 1998,9(1), 25–42.
Hoerl, R.W., Six Sigma and the future of the quality profession.Quality Progress, 1998,33(4), 35–42.
James-Moore, S.M. and Gibsons, A., Is Lean manufacture universally relevant? An investigative methodology.Int. J. Op. & Prod. Manage., 1997,17(9), 899–911.
Liker, J.K., Becoming Lean, 1998 (Productivity Press: Portland, OR).
Linderman, K., Schroeder, R.G., Zaheer, S. and Choo, A.S., Six Sigma: a goal-theoretic perspective. J. Op. Manage., 2003,21, 193–203.
Mastroianni, R. and Abdelhamid, T., The challenge: the impetus for change to Lean project delivery. Available online at: http://strobos.cee.vt.edu/IGLC11/PDF%20Files/ 51.pdf (accessed on 6 August 2005).
Monden, Y., Toyota Production System: An Integrated Approach to Just-In-Time, 1998 (Engineering and Management Press: IEE Norcross, GA).
Murman, E., Allen, T., Bozdogan, K. and Cutc, J., Lean Enterprise Value: Insights From MIT’s Lean Aerospace Initiative, 2002 (Palgrave: New York, NY).
Ohno, T., Toyota Production System: Beyond Large-Scale Production, 1988 (Productivity Press: Portland, OR). Pyzdek, T., Six Sigma and Lean production. Quality Digest,
2000, January, p. 14.
Rother, M., Crossroads: Which Way Will You Turn on the Road to Lean, Becoming Lean, pp. 477–495, 1998 (Productivity Inc.: Portland, OR).
Salzman, S., Rabeneck, L.T. and Rabeneck, S.K.,
Comprehensive Six Sigma Reference Guide, Corporate Document Services, 2002 (Corporate Document Services: Kansas City, MO).
Shah, R. and Ward, P.T., Lean Manufacturing: context, practice bundles, and performance. J. Op. Manage., 2003, 21, 129–149.
Sharma, U., Implementing Lean principles with the Six Sigma advantage: how a battery company realised significant improvements. J. Org. Excel., 2003, 22(3), 43–52.
Shingo, S.,The Shingo Prise Production Management System: Improving Process Function, 1992 (Productivity Press: Cambridge, MA).
Smith, B., Lean and Six Sigma—a one-two punch. Quality Progress, 2003,36(4), 37–41.
Snee, R.D. and Hoerl, R.W.,Leading Six Sigma – A Step by Step Guide Based on Experience at GE and Other Six Sigma Companies, 2003 (FT Prentice-Hall: NJ).
Sodhi, M.S. and Sodhi, N.S., Six Sigma pricing.Harv. Business Rev., 2005,May, 135–142.
Tague, N.R.,The Quality Toolbox, 2nd ed., pp. 359–361, 2004 (ASQ Quality Press: Milwaukee, WI).
Womack, J.P. and Jones, D.T.,Lean Thinking: Banish Waste and Create Wealth in Your Corporation, 1996 (Simon and Schuster: London, UK).
Womack, J.P., Jones, D.T. and Roos, D.,The Machine That Changed The World, 1990 (Macmillan: New York). www.qualitydigest.com/jan00/html/sixsigma0100.html
(accessed on 21 March 2005).
Maneesh Kumaris currently pursuing his PhD studies at Glasgow Caledonian University after the successful completion of a BTech in Manufacturing Engineering in May 2004 from the National Institute of Forging and Foundry Technology, Ranchi University in India. He is working on Six Sigma implementation in SMEs as part of his doctoral studies. He has published eight referred papers and seven conference papers in the area of Six Sigma, Taguchi methods, multi response optimisation, supply chain, and artificial intelligence. He has published articles in journals such as
Journal of Operations Research Society,International Journal of Production Research,International Journal of Systems and Logistics Management, International Journal of Quality and Reliability Management, Institute of Mechanical Engineer Part-B, Journal of Manufacturing Technology Management, andManagerial Auditing Journal.
During his undergraduate studies in India, he had carried out a real life Six Sigma project with a leading automotive manufacturer in India, which resulted in savings of $100 000 for the organisation. His research potential was used during his undergraduate course to draft an eligibility criteria document proposed for Technical Education Quality Improvement Program and, based on a strict evaluation process of the project, $16 million was sanctioned. He was heavily involved in organising three national and international conferences on Six Sigma.
Dr Jiju Antonyis currently leading the Centre for Research in Six Sigma and Process Improvement (CRISSPI) at Caledonian Business School, Glasgow Caledonian University, Scotland. He received a BE in Mechanical Engineering from the University of Kerala, South India, a MEngSc in Quality and Reliability Engineering from the National University of Ireland and a PhD in Quality Control for Manufacturing from the University of Portsmouth, UK. His work experience includes 2 years as a maintenance engineer, 3 years as a quality/reliability manager and 7 years as a quality engineering consultant for a number of multinational companies such as Nokia, Parker Pen, Vickers Systems, Siemens, Rolls-Royce, Bosch, Motorola, Philips, Motorola and a large number of local SMEs. He has published over 100 refereed papers and three textbooks in the areas of reliability engineering, design of experiments, Taguchi methods, Six Sigma, total quality management and statistical process control. He has conducted training programmes in design of experiments, Taguchi methods and Six Sigma for a number of companies in the UK and abroad. He is currently working on his fourth book entitledWorld Class Applications of Six Sigmawhich was published in June 2005 by Butterworth Publishers. He successfully launched the first International Journal of Six Sigma and Competitive Advantagein August 2004. He chaired the First International Conference on Six Sigma in December 2004 in Glasgow, Scotland. Dr Antony is also leading a ‘Lean Sigma and Quality Improvement Network’ for local companies in Glasgow. He has been considered forWho’s Who in the Worldby Marquis and will appear in the 2006 edition as an acknowledgement of his contribution to the field of quality management and Six Sigma.
Ritesh Kumar Singhis Senior Lecturer in the Department of Production Engineering, Birla Institute of Technology, Mesra, Ranchi, India. He has 6 years of teaching and research experience. His PhD dissertation is concerned with waste minimisation strategies in manufacturing industries. His research interests include continues improvement philosophies such as lean manufacturing, theory of constraints, Six Sigma, reconfigurable manufacturing systems and supply chain management, etc.
He has developed diverse decision support heuristics for multi-criteria group decision making in order to resolve the complex issues of waste identification in manufacturing industries, machine selection problems, and various reconfigurable manufacturing system design problems. He has authored nearly 20 technical papers in peer-reviewed journals, and at various international and national conferences. His contributions have appeared in various reputable journals such as
International Journal of Production Research, International Journal of Advance Manufacturing Technology, etc. He also acts as a referee for a few reputable international journals.
Manoj Kumar Tiwarireceived his BE degree from VRCE, Nagpur and ME degree from MNREC, Allahabad, India. He completed his PhD at Jadavpur, India. He was with NERIST, India (Mechanical Engineering Department) for 8 years as a senior lecturer. He has been with NIFFT Ranchi since 1998 as an assistance professor and professor respectively. He is currently associated with Research Promotion Cell (RPC) NIFFT and also contributed in running TEQIP a project, sponsored by NPIU, Noida, India.
Dr Tiwari has contributed more than 100 articles in various leading international journals of repute and international conferences that includeEuropean Journal of Operation Research(EJOR),
International Journal of Production Research(IJPR),Journal of Engineering Manufacture,Part-B, etc. He reviews articles for 18 international journals and serves as an editorial board member for two international journals. He has been pursuing collaborative research with several faculty members working in various universities such as Loughborough University, University of Wisconsin at Madison, University of Missouri Rolla, Rutgers University, Kansas State University, Bath University, Caledonian Business School, University of Windson, University of Hong Kong, etc. He is well known for training bachelor students in several research areas and involves them in meaningful research. Some of his students are pursuing doctoral and post doctoral work in at least 10 reputed universities.
Daniel Perryis currently a lecturer at Glasgow Caledonian University within the operations and quality management team. Before joining the university he was employed as a research engineer by Ferodo (Federal-Mogul) and UMIST whilst conducting his doctoral research (currently being written up). The research was sponsored by the company and the EPSRC. The research involves the relationship of high and low level systems of control within the manufacturing and business environment. Prior to this he was employed by the Ministry of Defence working within an embedded unit in the RAF which involved a variety of capital infrastructure and engineering projects.