Int. J. Electrochem. Sci., 12 (2017) 4677 – 4691, doi: 10.20964/2017.06.18
International Journal of
ELECTROCHEMICAL
SCIENCE
www.electrochemsci.org
An All-Solid-State Phosphate Electrode with H
3PO
4Doped
Polyaniline as the Sensitive Layer
Yuanfeng Huang1, Ying Ye1, Guochen Zhao1, XiaominWu1, Yating Kan1, Luis Mur3, JiwanHan3, Huawei Qin2,*
1
Ocean College, Zhejiang University, Zhoushan, 316021, China
2
The Institute of Mechatronic Engineering, Hangzhou Dianzi University, Hangzhou 310018, China
3
Institute of Biological, Environment and Rural Sciences, Aberystwyth University, Wales, SY23 3DA, UK
*
E-mail: [email protected]
Received: 16 December 2016 / Accepted: 18 March 2017 / Published: 12 May 2017
We here describe the construction of a highly sensitive and selective all-solid-state phosphate electrode based on polyaniline and H3PO4 doped polyaniline. The polyaniline layer was electroplated on the gold
substrate with Chronoamperometry method and was in-situ doped by H3PO4. The Scanning Electron
Microscopy-Energy Dispersive X-ray Spectroscopy (SEM, EDS) and contact angle measurement was taken to explain the difference of the two layers. This electrode can be used in both freshwater and seawater systems. In both of the two systems, the electrode exhibits linear response in the concentration range 10-1 to 10-6 M with detection limit of 10-6 M. and response time of <1 seconds. The selectivity of the electrodes was also studied in 10-1-10-5 M KH2PO4 solutions containing either
0.01 M sulfate, nitrate, chloride as the interference ions. During 12 hours continuous monitoring in 10-3 M KH2PO4 with 3.5% NaCl the potential drift was 0.05 mV/h and the lifetime of the electrode was
over 40 days when preserved in this solution.
Keywords: Phosphate, All-solid-state electrode, Polyaniline, H3PO4 doped polyaniline, Artificial
seawater
1. INTRODUCTION
body, the phosphate will cause huge damage to liver, kidney and other organs[3]. Therefore, the measurement of phosphate is essential to many environment applications.
There are many methods to measure phosphate concentrations. Among them, the Molybdenum Blue Method[4] was the first reported and has been become a widely used standard approach. However, in recent years, there have been many improvements and applications based on, such as the Spectrophotometric determination with the auto-flow injection analysis system[5], and robotic equipment[6, 7]. In addition, the ion chromatography method[8], the atomic absorption spectrometric method[9], the surfactant-sensitized malachite green method[10], and the capillary electrophoresis method[11] have been used alone or combination to measure the phosphate in natural waters, waste waters and urine samples. Although such methods have many merits like high selectivity and sensitivity, but they cannot be employed for longtime in situ monitoring. There is therefore a requirement for the development of a robust phosphate ion-selective electrode to allow such monitoring to be carried out.
The classic ion-selective electrode (ISE) is composed of the electrolyte and the ionophore. According to the status of electrolyte, ISE types can be sub-divided into ionic liquid-based electrode and solid electrolyte electrode. The liquid-based membrane electrode is difficult to integrate with the transducer and the long-term potential stability of the inner interface is still suspect[12, 13], so the solid-state electrodes tend to be preferred by researchers. Silicone rubber[14], pyrolytic graphite[15], carbon nanotubes[16], polyacrylonitrile[17], PVC[18], polythiophene[19], polypyrrole[20], polyaniline[21] and many chemically modified polymers are the common used solid electrolytes. Amongst these, the polyaniline has the better conductivity because of its low impedance [21].
In recent years, researchers have used kinds of different ionophores to fabricate the solid-state phosphate electrode[22]. These include mixtures of aluminium powder, aluminium phosphate and powdered copper[23], the etched cobalt wire as the inorganic phosphate selective membrane[24], bisthiourea[25] organic tin compounds combined with NaTFPB[26] and rubbery membranes containing heterocylic macrocycles as sensors covalently bound to a cross-linked polystyrene-block– polybutadiene-block–polystyrene (SBS) polymer[27]. However, phosphate doped polyaniline has never previously been used as the phosphate sensitive membrane.
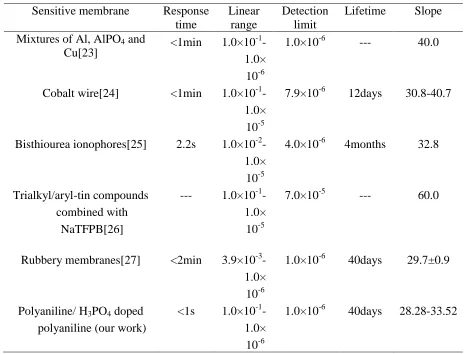
Table 1. The characteristic comparison of phosphate electrodes between the previous works and our work
Sensitive membrane Response time
Linear range
Detection limit
Lifetime Slope Mixtures of Al, AlPO4 and
Cu[23] <1min 1.0×10
-1
-1.0× 10⁻⁶
1.0×10⁻⁶ --- 40.0
Cobalt wire[24] <1min 1.0×10⁻¹ -1.0× 10⁻⁵
7.9×10⁻⁶ 12days 30.8-40.7
Bisthiourea ionophores[25] 2.2s 1.0×10⁻² -1.0× 10⁻⁵
4.0×10⁻⁶ 4months 32.8
Trialkyl/aryl-tin compounds combined with
NaTFPB[26]
--- 1.0×10⁻¹ -1.0× 10⁻⁵
7.0×10⁻⁵ --- 60.0
Rubbery membranes[27] <2min 3.9×10⁻³ -1.0× 10⁻⁶
1.0×10⁻⁶ 40days 29.7±0.9
Polyaniline/ H3PO4 doped
polyaniline (our work)
<1s 1.0×10⁻¹ -1.0× 10⁻⁶
1.0×10⁻⁶ 40days 28.28-33.52
2. EXPERIMENTAL
2.1 Apparatus and reagents
The workstation used to fabricate and calibrate the electrode was the CHI660E workstation (Chenhua, Shanghai, China), the auxiliary electrode was a 10 mm×10 mm×0.1 mm Pt (99.99%) plate electrode (CAS: 7440-06-4, Alfa aesar), the reference electrode was an Ag/AgCl reference electrode (CHI111, Chenhua, Shanghai, China). Gold wire (99.9%, 0.5 mm in diameter) was obtained from the Sinopharm Chemical Reagent Co., Ltd, China. The alumina, absolute ethanol, hydrochloric acid, aniline hydrochloride, phosphoric acid, sodium chloride, potassium sulfate, potassium nitrite, potassium chloride and potassium dihydrogen phosphate were all obtained from Sigma-Aldrich.
2.2 Preparation of the phosphate electrode
[image:3.596.65.530.112.466.2]
hydrochloric acid and deionized water. Then, the substrate was electrodeposited with polyaniline (in 0.5 M aniline hydrochloride solution) and doped with phosphate (in 0.5 M phosphoric acid solution) in sequence.
The electrodeposition and doping process were implemented with Chronoamperometry method by the three-electrode system of the CHI660E workstation, with the gold wire as the working electrode, the CHI111 Ag/AgCl electrode as the reference electrode and the Pt plate as the counter electrode. The two procedure were operated at room temperature with constant potential of 0.8 V for 100 s and 300 s, respectively.
2.3 Characterizations
2.3.1. Scanning Electron Microscopy-Energy Dispersive X-ray Spectroscopy (SEM, EDS) and contact angle measurement
The field emission scanning electron microscope (JEOL JSM 6500F, Japan) and the Energy Dispersive X-ray Spectroscopy (Oxford X-Max SDD) were used to analyse the surface morphology and the elementary composition of the PANI layer and the phosphate doped PANI layer. The water contact angle was measured with 5μL purified water droplet using GBX Digidrop Contact Angle Meter at room temperature. The Drop Snake plugin of ImageJ (software) was used to measure the value of contact angle[29]. The values reported below are the average result of three measurements and the average value of the contact angle on the left and right side of the water droplet.
2.3.2. Electrode calibration and characterization
The KH2PO4 solution made up in deionized water consisted of 1.3609 g KH2PO4, and made up
to 100 mL to obtain a 10-1 M KH2PO4 solution. This was diluted with deionized water stepwise to
obtain 10-2, 10-3, 10-4, 10-5, 10-6 M KH2PO4.
The KH2PO4 solution made up in artificial seawater was derived by dissolving 35 g NaCl in
deionized water to yield 1 L 3.5% NaCl solution. This solution was used as the solvent to prepare the 10-1-10-6 M KH2PO4 concentration range.
To make the KH2PO4 solution with interference ions, 0.01 M K2SO4, KNO3, KCl solutions
were prepared in advance, and was used instead of deionized water to make the 10-2-10-6 M KH2PO4
concentration range of solutions.
All the potentiometric measurement were obtained with the CHI660E workstation at room temperature. The corrosion method at open circuit was used with the 2-electrode system: the phosphate electrode as the working electrode and the CHI111Ag/AgCl electrode as the reference electrode. The calibration period for each decade was 300 s.
3. RESULTS AND DISCUSSION
[image:5.596.119.452.240.737.2]
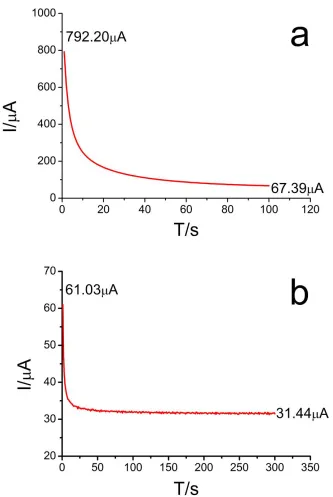
Fig.1a and Fig.1b are the real-time current of the two steps. The initial current when depositing the polyaniline is 792.20 μA, with the reaction area of 8.20×10⁻² cm2(the diameter of the gold wire was 0.5 mm, and the length of coating was 1 cm). Thus, we obtained the current density of 9.66 mA/cm2. In the first 20 seconds the current was reduced to 100 μA and then kept stable at 67.39 μA, with the current density of 0.82 mA/cm2, which allowed the conductive green polyaniline membrane to be derived. Fig.1b reflected the process of phosphate doping polyaniline, the curve has the similar trend as Fig.1a. The current density is 0.74 mA/cm2 at the beginning and the reaction performed fastest in the first 20 s, then the current density keeps at 0.38 mA/cm2. The surface of the electrode became dark green after doping.
3.2 SEM, EDS and contact angle measurement
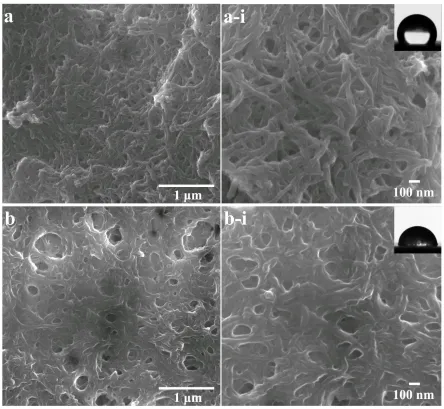
[image:6.596.76.520.253.662.2]The deposited polyaniline is loosely distributed on the surface of the gold substrate. Its fibrous structure is clearly shown in Fig.2a and Fig.2a-i, only the tips of the streaks were contacted with each other, and the whole coating was distributed loosely on the substrate. After doped with phosphoric acid, the fine fibers combined together to generate the compact reticular structure, as shown in Fig.2b and Fig.2b-i.The phosphate doped polyaniline net formed the conducting channel, which was expected to improve the conductivity and the sensitivity of the electrode[30].
Figure 2. The SEM photographs of polyaniline (a, a-i) and phosphate doped polyaniline (b, b-i) with magnification of 25000 and 50000
[image:7.596.87.507.216.410.2]
It can be inferred that, for both of the two layers, the content of carbon is highest in addition to gold. As in the molecular structure of polyaniline, a benzene ring is linked to a single nitrogen atom, so the number of carbon is far greater than the nitrogen element. The polyaniline is partly doped by hydrochloric acid, so chloride can be found in polyaniline. In the phosphate doped polyaniline, the presence of phosphorus and oxygen in substitution of the chloride ions proved that the doping of the phosphoric acid was successful.
Table 2. The elemental analysis of polyaniline and phosphate doped polyaniline.
Elemental Analysis of Polyaniline Elemental Analysis of Phosphate Doped Polyaniline
Element Weight% Atomic% Element Weight% Atomic%
Au 59.35 8.49 Au 67.74 12.05
C 32.35 75.90 C 22.65 66.10
N 7.40 14.90 N 4.19 10.49
Cl 0.89 0.71 O 4.93 10.80
P 0.49 0.56
Totals 100 100 Totals 100 100
After measured by Drop Snake, we got the contact angle of 115.5ºfin Fig.2a-i, and 78.9º in Fig.2b-i, which means the polyaniline layer is hydrophobic and the phosphate doped polyaniline layer is hydrophilic. The wettability has influence on the performance of the electrode: the better the affinity of water, the higher the sensitivity and shorter the response time of the electrode. This was proved in 3.4.4.
Figure 3. The molecular configurations of polyaniline (a) and three possible molecular configurations of the H3PO4 doped polyaniline (b), (c),(d).
In the process of doping polyaniline, the total electronic number does not change. The hydrogen ion and the anion (e.g., chloride, sulfate, phosphate, etc.) of the protonic acid are grafted into the main chain. When deposited polyaniline in hydrochloride acid system, the chloride ions joins up with the main chain, and the chloride ions is replaced by hydrogen and dihydrogen phosphate when electroplating in phosphoric acid (the molecular configurations of polyaniline and H3PO4 doped
polyaniline are as shown in Fig.3). Phosphate group acted as cross-linker doped between polyaniline chains. The grafted hydrogen and anion combined with the nitrogen atoms in the amine and imine groups to form polaron and dipole, which delocalized to the P button of the whole molecular chain, thus conferring high conductivity to the polyaniline. Further, the existence of the anion ions means that polyaniline has a good selective sensitivity to the target ions in solution.
3.4 Analytical performance of the phosphate electrode
Figure 4. The calibration process of two phosphate electrodes (NO.1, NO.2) in KH2PO4 prepared in
freshwater.
After fabrication, the phosphate electrodes was firstly calibrated in the KH2PO4 solution made
up in deionized water (the calibration of two electrodes is shown in Fig.4). The Nernst slopes of 10 electrodes are between 28.28 and 33.52, which means that each of the freshly prepared electrodes had individual differences, the Nernst slopes and intercepts have little differences with each other. That is likely to be due to the oligomer polyaniline detained in the plating solution, and the retention rate being difficult to control. The slopes of the electrode should be around 59 according to the Nernst equation, in 10-1-10-6 M KH2PO4 solution with H2PO4- as the main ions. This phosphate electrode is
likely to be sensitive to all of the three phosphates, so it doesn’t exhibit idealist Nernstian response. Other researchers also made phosphate electrodes with slopes of 35[23] and 96[31]. The lifetime test in 3.4.6 showed that the slopes of the electrodes kept stable for 40 days, so we just need to calibrate it before use. The stability of the electrodes were very good with the regression coefficients of the Nernst equation all over 0.99. The linear range of the electrodes were 10-1-10-6 M, and the detection limit is 10-6 M. The potential drifts of each decades were less than 2 mV during the calibration time (300 s/decade).
[image:9.596.121.458.88.280.2]
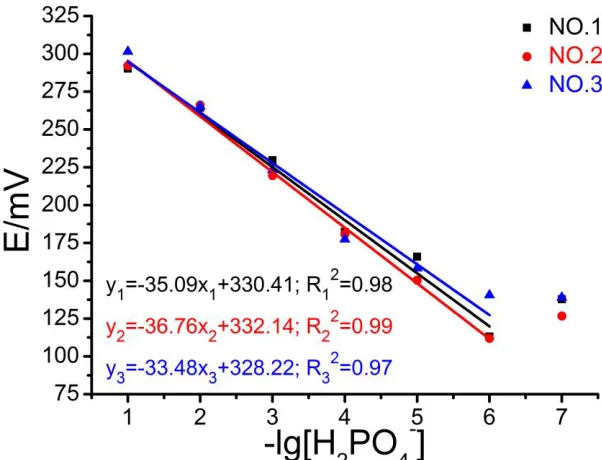
Figure 5. The calibration curves of three electrodes (No.1, 2 and 3) in KH2PO4 solution made of 3.5%
NaCl
To expand the utility of the electrodes to seawater condition we needed to demonstrate good anti-interference ability against chloride ions. Therefore, we derived standard solutions of 10-1-10-7 M potassium dihydrogen phosphate with 3.5% sodium chloride solution as the solvent. The results of three electrodes are as shown in Fig.5, the Nernst slopes were 33.48, 35.09 and 36.76, which were higher than that in freshwater system. The interference of chloride ions could have influenced the slope as the ionic strength is stronger than that in freshwater, which will also have effect on the Nernst slope. In artificial seawater system, the linear range of the electrodes is 10-1-10-6 M, the detection limit is 10-6 M. The repeatability of this method was good.
3.4.3 Selectivity
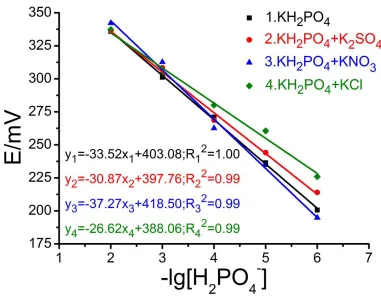
All the ion selective electrode was also sensitive to some other ions to some extent. sulfate, nitrate, chloride ions are the main interfering ions of the phosphate ion selective electrode[27]. The experimental results in Fig.6 show the Nernst response curves of the phosphate electrode in 10-6-10-2 M KH2PO4 solutions made of freshwater but these solutions were divided into 4 groups; one control
Figure 6. The selectivity result of the phosphate electrode under the interference of 0.01 M sulfate, nitrate and chloride.
The linear regression coefficients of the four calibration systems all reached 0.99. However, the Nernst slopes were different from each other. As shown in Fig.6, the slopes are 33.52, 30.87, 37.27, and 26.62, respectively. This result indicates that, our phosphate electrode has an excellent selectivity of phosphorus, but it should be calibrated both in freshwater and in sample solution before use.
3.4.4 Response time, sensitivity
The phosphate electrode was tested in different concentrations of KH2PO4 solution (10-6-10-1
M) for 300 s, the points were acquired every 10 s. The response time of the phosphate electrode was shown in Fig.7 and clearly demonstrated its sensitivity. After inserted into the testing solution, the electrode immediately provided appropriate signal. There was no obvious signal drift when changing the concentration of solution. In 10-1 to 10-6 M KH2PO4 solutions, the phosphate electrode could
[image:11.596.93.474.95.391.2]
Figure 7. The response time of the phosphate electrode when calibrating in different concentration of KH2PO4 solution
3.4.5 Stability
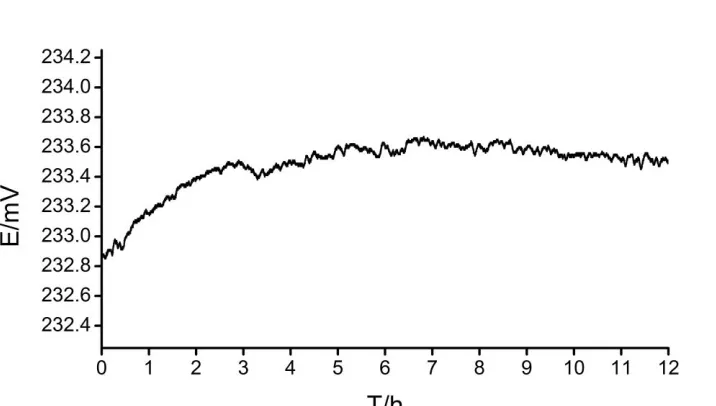
Figure 8. The continuous observation for 12 hours in 10-3 M KH2PO4 with 3.5% NaCl
The phosphate electrode was monitored continuously in 10-3 M KH2PO4 solution which
[image:12.596.114.472.436.639.2]
0.6 mV, and reached 233.5 mV. For the next 10 h, the potential remained around 233.5 mV, with a maximum drift of 0.2 mV. The average potential drift over 12 h was calculated to be 0.05 mV/h.
3.4.6 pH dependency study
Since this electrode is sensitive to all of the three phosphates, so the Nernst slope will differ when used at different pH, as the ratio of the three phosphate will change. But the pH dependency is essential for evaluating phosphate electrode. So we studied this dependency by measuring the stability of the potential signal when calibrating the electrodes in buffer of pH 4-10 containing 0.001 M KH2PO4. Three phosphate electrodes were used for this experiment. And all the calibrations were did
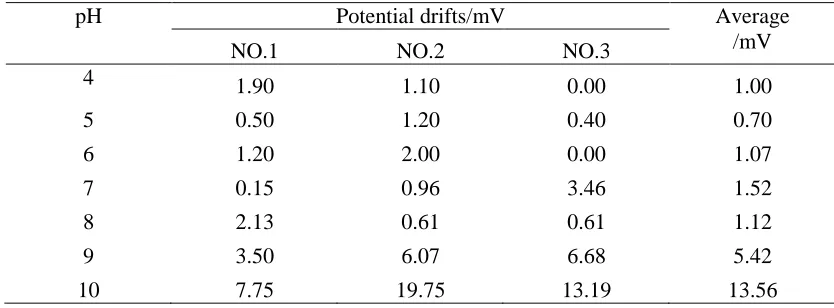
[image:13.596.88.505.401.555.2]at room temperature of 20 ℃. Table.3 shows the potential drifts of each electrode when calibrating in solutions with pH range of 4-10. All the values were calculated with the maximum potential minus the minimum potential. The calibration time was 200 s of each decade. As is shown in Table.3, the potential drifts are lower than 2 mV during 200 s monitoring in pH 4-8. Thus, the electrode is suitable to use in pH of 4-8, but cannot get the stable signal in alkaline solution of pH 9-10. The pH of seawater is around 8, so this phosphate can be used to monitor the environment of seawater.
Table 3. The potential drifts of phosphate electrodes when calibrated at different pH.
pH Potential drifts/mV Average
/mV
NO.1 NO.2 NO.3
4 1.90 1.10 0.00 1.00
5 0.50 1.20 0.40 0.70
6 1.20 2.00 0.00 1.07
7 0.15 0.96 3.46 1.52
8 2.13 0.61 0.61 1.12
9 3.50 6.07 6.68 5.42
10 7.75 19.75 13.19 13.56
3.4.7 Lifetime
Table 4. Lifespan of the phosphate electrode (calibration in 10-1-10-5 M KH2PO4 solution with 3.5%
NaCl)
Date of calibration The first day After 40 days Temperature
19.2℃ 19.5℃
Calibration Data
Concentration /M
E/mV
NO.1 NO.2 NO.1 NO.2
[image:13.596.87.506.652.769.2]
10-4 182.28 180.76 187.45 174.08 10-5 165.87 150.38 166.18 152.70 Nernst
Equation
Slope -33.08 -36.88 -32.23 -36.50
Intercept 325.72 332.41 324.22 329.45
R2 0.98 0.99 0.98 0.99
Lifetime is another index of ion selective electrode when applied into practical monitoring. In this experiment, we immersed the electrodes in 10-3 M KH2PO4 (with 3.5% NaCl) solution at room
temperature for 40 days. As shown in Table.4, the Nernst slopes and intercept of the two electrodes hardly changed after the 40 days. Furthermore, the linear regression coefficients were kept as before. These results indicated that the lifespan of the phosphate electrodes is at least 40 days.
4. CONCLUSIONS
In this paper, an all solid phosphate ion selective electrode with phosphoric acid doped polyaniline as the sensitive membrane was fabricated. The electrode was prepared by electrodeposition of the hydrochloric acid aniline and phosphoric acid solution, in turn on to a gold substrate. The scanning electron micrographs showed that phosphoric doped polyaniline had a regular network structure on the surface. The presence of phosphorus and oxygen elements was proved by EDS. The water contact angle test demonstrated the change of surface wettability, from hydrophobic to hydrophilic resulted from doping phosphorus. These factors contributed to the good sensitivity and selectivity of the electrode.
The electrode could be used in both the freshwater and seawater systems, with a linear range of 10-1-10-6 M, detection limit of 10-6 M, and response time of less than 1 seconds. However, the electrode had different slopes when calibrating in different systems. There were also some individual differences between the electrodes prepared in the same batch. The electrode had good selectivity over sulfate, nitrate, and chloride, but the slopes differ in different interference solutions, which suggested further calibration should be done before use.
The practical advantages of this all-solid-state phosphate ion selective electrode are its high sensitivity and good stability. The response time was less than 10 seconds. The drift value of the electric potential in the 12 hours continuous observation was 0.05 mV/h, and the lifetime was more than 40 days. Therefore, the electrode is appropriate to be used in one-off sampling or long-term in situ monitoring of industrial water, groundwater, river water and natural seawater.
ACKNOWLEDGEMENTS
References
1. F.A. Khan and A.A. Ansari, Botanical Review, 71 (2005) 449. 2. V. Smil, Annual Review of Energy & the Environment, 25 (2003) 53.
3. N.D. Toussaint, E. Pedagogos, S.J. Tan, S.V. Badve, C.M. Hawley, V. Perkovic and G.J. Elder, Nephrology, 17 (2012) 433.
4. J. Murphy and J.P. Riley, Analytica Chimica Acta, 27 (1962) 31.
5. C.X. Galhardo and J.C. Masini, Analytica Chimica Acta, 417 (2000) 191. 6. E.A. Nagul, I.D. Mckelvie and S.D. Kolev, Talanta, 133 (2015) 155.
7. L. Rong, R. Ishimatsu, M. Yahiro, C. Adachi, K. Nakano and T. Imato, Talanta, 132 (2015) 96. 8. C. Xie, J. Xu, J. Tang, S.A. Baig and X. Xu, Communications in Soil Science & Plant Analysis,
44 (2013) 2535.
9. T. Nasu and M. Kan, Analyst, 113 (1988) 1683.
10. X.L. Huang and J.Z. Zhang, Analytica Chimica Acta, 580 (2006) 55.
11. S.Y. Chang, W.L. Tseng, S. Mallipattu and H.T. Chang, Talanta, 66 (2005) 411. 12. C. Wardak, Electroanalysis, 26 (2014) 864.
13. E. Bakker, Analytical Chemistry, 88 (2016) 395.
14. E.B. Buchanan and J.L. Seago, Analytical Chemistry, 40 (1968) 517. 15. J.T. Stock and R.D. Pugliese, Analytical Chemistry, 41 (1969) 198.
16. Y. Liu, T. Yuan, J. Zhu, Y. Qin and D. Jiang, Sensors & Actuators B Chemical, 219 (2015) 100. 17. Z. Osman, K.B.M. Isa, A. Ahmad and L. Othman, Ionics, 16 (2010) 431.
18. C. Carey, Chemosensors, 3 (2015) 284.
19. C. Bora, C. Sarkar, K.J. Mohan and S. Dolui, Electrochimica Acta, 157 (2015) 225.
20. E. Asghari, H. Ashassi-Sorkhabi, A. Vahed, B. Rezaei-Moghadam and G.R. Charmi, Thin Solid Films, 598 (2015) 6.
21. Y. Huang, J. Li, T. Yin, J. Jia, Q. Ding, H. Zheng, C.T.A. Chen and Y. Ye, Journal of Electroanalytical Chemistry, 741 (2015) 87.
22. A.T.L. Al and S.B. Adeloju, Talanta, 114 (2013) 191. 23. F. Tafesse and M. Enemchukwu, Talanta, 83 (2011) 1491.
24. W.H. Lee, Y. Seo and P.L. Bishop, Sensors & Actuators B Chemical, 137 (2009) 121. 25. E. Khaled, H.N.A. Hassan, A. Girgis and R. Metelka, Talanta, 77 (2008) 737.
26. S. Sasaki, S. Ozawa, D. Citterio, K. Yamada and K. Suzuki, Talanta, 63 (2004) 131.
27. T.L. Goff, J. Braven, L. Ebdon and D. Scholefield, Analytica Chimica Acta, 510 (2004) 175. 28. Shi Yong Hua Xue Shou Ce, Science Press, 2001.
29. A.F. Stalder, T. Melchior, M. Müller, D. Sage, T. Blu and M. Unser, Colloids & Surfaces A Physicochemical & Engineering Aspects, 364 (2010) 72.
30. J.F. Rouleau, J. Goyette, T.K. Bose, R. Singh and R.P. Tandon, Physical Review B Condensed Matter, 52 (1995) 4801.
31. J.H. Lee, W.H. Lee, P.L. Bishop and I. Papautsky, Journal of Micromechanics & Microengineering, 19 (2009) 25022.